Description
Enhanced our Java Monitoring feature so that Germain provides benefits similar to Dynatrace and AppDynamics
Examples
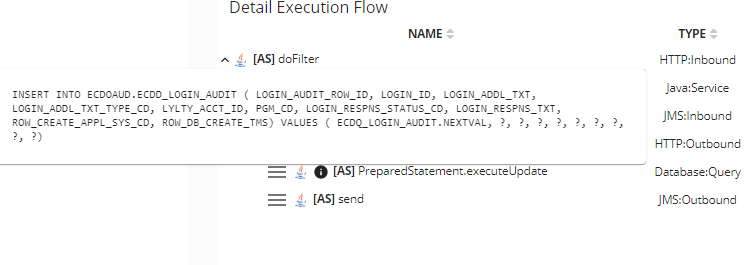
Before our changes, we were showing this for a sample request which triggers an outbound MQ request:

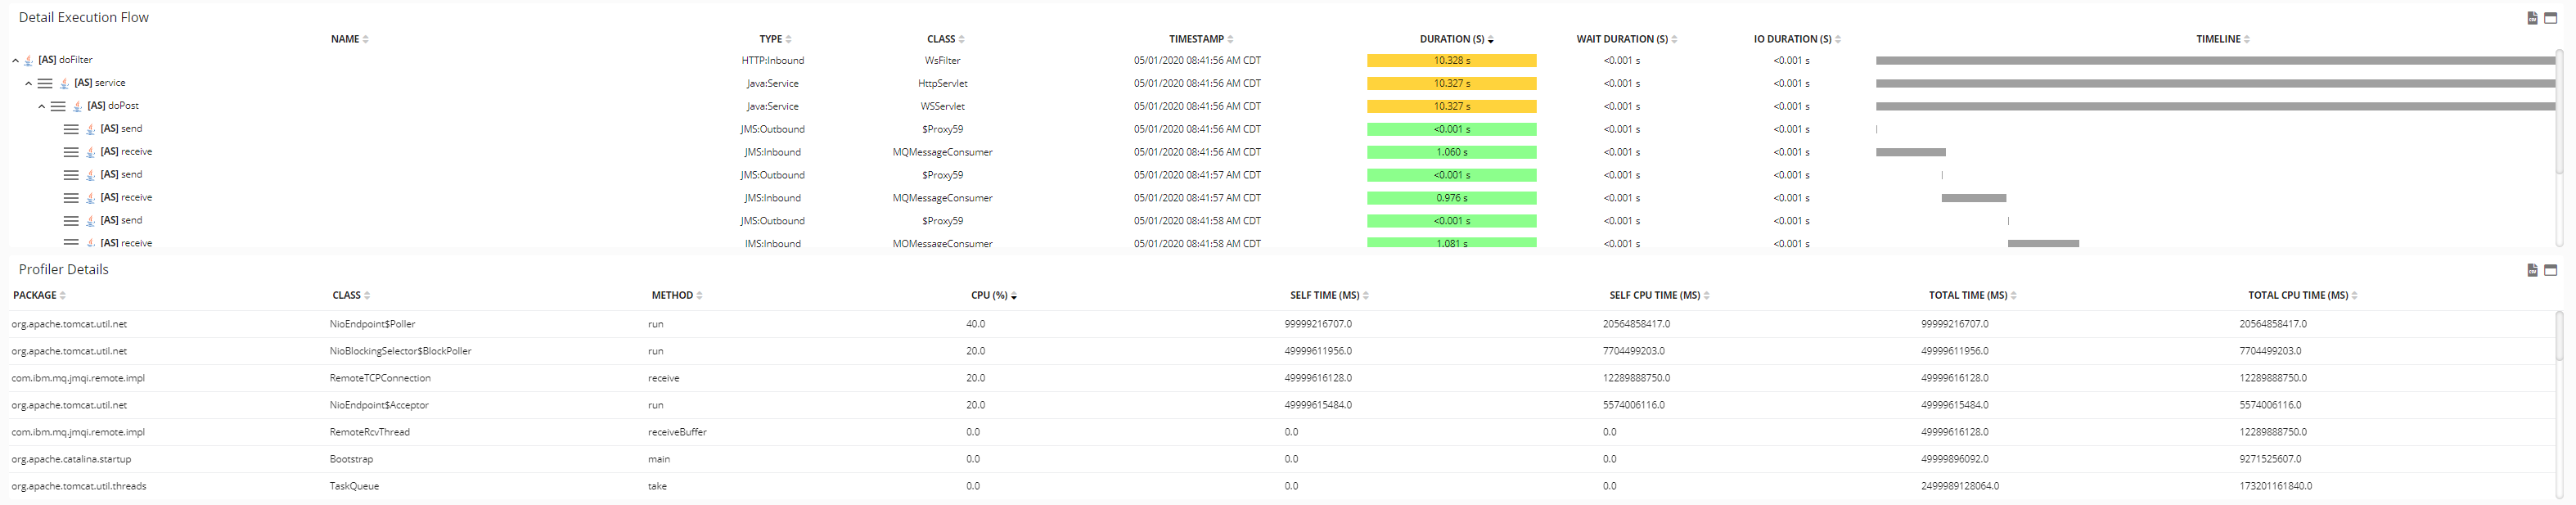
After our changes, we automatically pick up additional API calls as well as additional custom service methods e.g. com.germainsoftware.apm (because we are monitoring our own application here):

Additionally, we're now picking up asynchronous service executions. For example, SQL executed on a thread that wasn't triggered by an inbound HTTP request (ex: scheduled task):

Also, we are now getting Active (CPU) vs Wait vs IO breakdown for each java function:
And SQL statement: