Features
Germain UX offers various types of SLAs (Service Level Agreements) that can be applied to different KPIs, whether they are preconfigured or custom, and whether they relate to business or technical metrics.
Video Overview: https://youtu.be/H8P_u-LlgHk
Types of SLAs Available in Germain UX:
Fact-Based SLA
This type of SLA evaluates individual data points or facts. It allows you to measure specific metrics against predefined thresholds or targets.
Statistical SLA
Statistical SLAs evaluate collections of data points or facts. Several types of statistical SLAs are available:
-
Aggregate SLA
This evaluates a specific period of time and compares it to a constant threshold. It’s useful for monitoring trends or performance over a defined time frame. -
Color Percentile SLA
This evaluates a period of time and compares the percentile of data points in the GREEN range to a constant threshold, helping to determine if performance is within an acceptable range. -
Percent Change SLA
This evaluates a period of time and compares it to a previous period, measuring the percentage change. It’s ideal for monitoring performance improvements or regressions over time. -
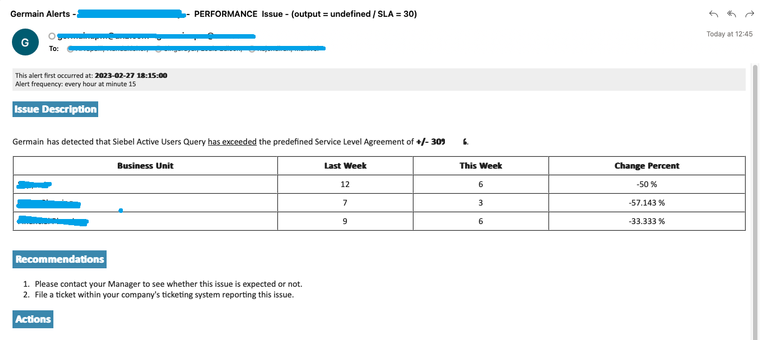
“In Range” Operator
This operator can be used with a Percent-Change SLA and a Threshold of -/+30%.
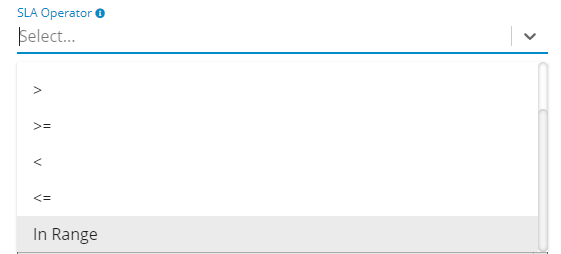
Example: Alert leveraging the In-Range operator – Germain UX
Predictive SLA
Predictive SLAs use past data points or historical trends to create predictions. These SLAs help forecast future performance or identify potential issues before they arise.
Smart Insights SLA
Smart Insights SLAs automatically identify abnormal trends or noteworthy deviations. They evaluate a business period (e.g., year-end, quarter-end, month-end, or specific weekdays) and compare it to similar periods, providing alerts or notifications when significant deviations occur.
Examples of Smart Insights include predictions like:
-
Disk usage exceeding a certain threshold.
-
Changes in user error volume compared to previous periods.
-
Sales forecast accuracy predictions.
-
Predicted visitor increases on an eCommerce site by month-end.
The Smart Insight engine can be enabled for any KPIs that are active in your system, whether they are related to Technology, Processes, or User Behavior.
In Summary
Germain UX provides a variety of SLAs, including fact-based and statistical SLAs, to monitor and evaluate KPIs effectively. These SLAs enable organizations to set performance targets, track trends, and gain predictive insights. The Smart Insight SLAs offer automated detection of abnormal trends, helping businesses with proactive monitoring and decision-making.
Examples of Alerts:
-
Alert 1: Disk Usage is predicted to exceed 90% in a week.
-
Alert 2: User Errors Volume has increased by 22.7% this Monday compared with last Monday.
-
Alert 3: Sales Forecast predicted to be 70% accurate by month-end.
-
Alert 4: eCommerce visitors predicted to be 40% higher by month-end.
Filter Percent Change SLA with Baseline and Current Results
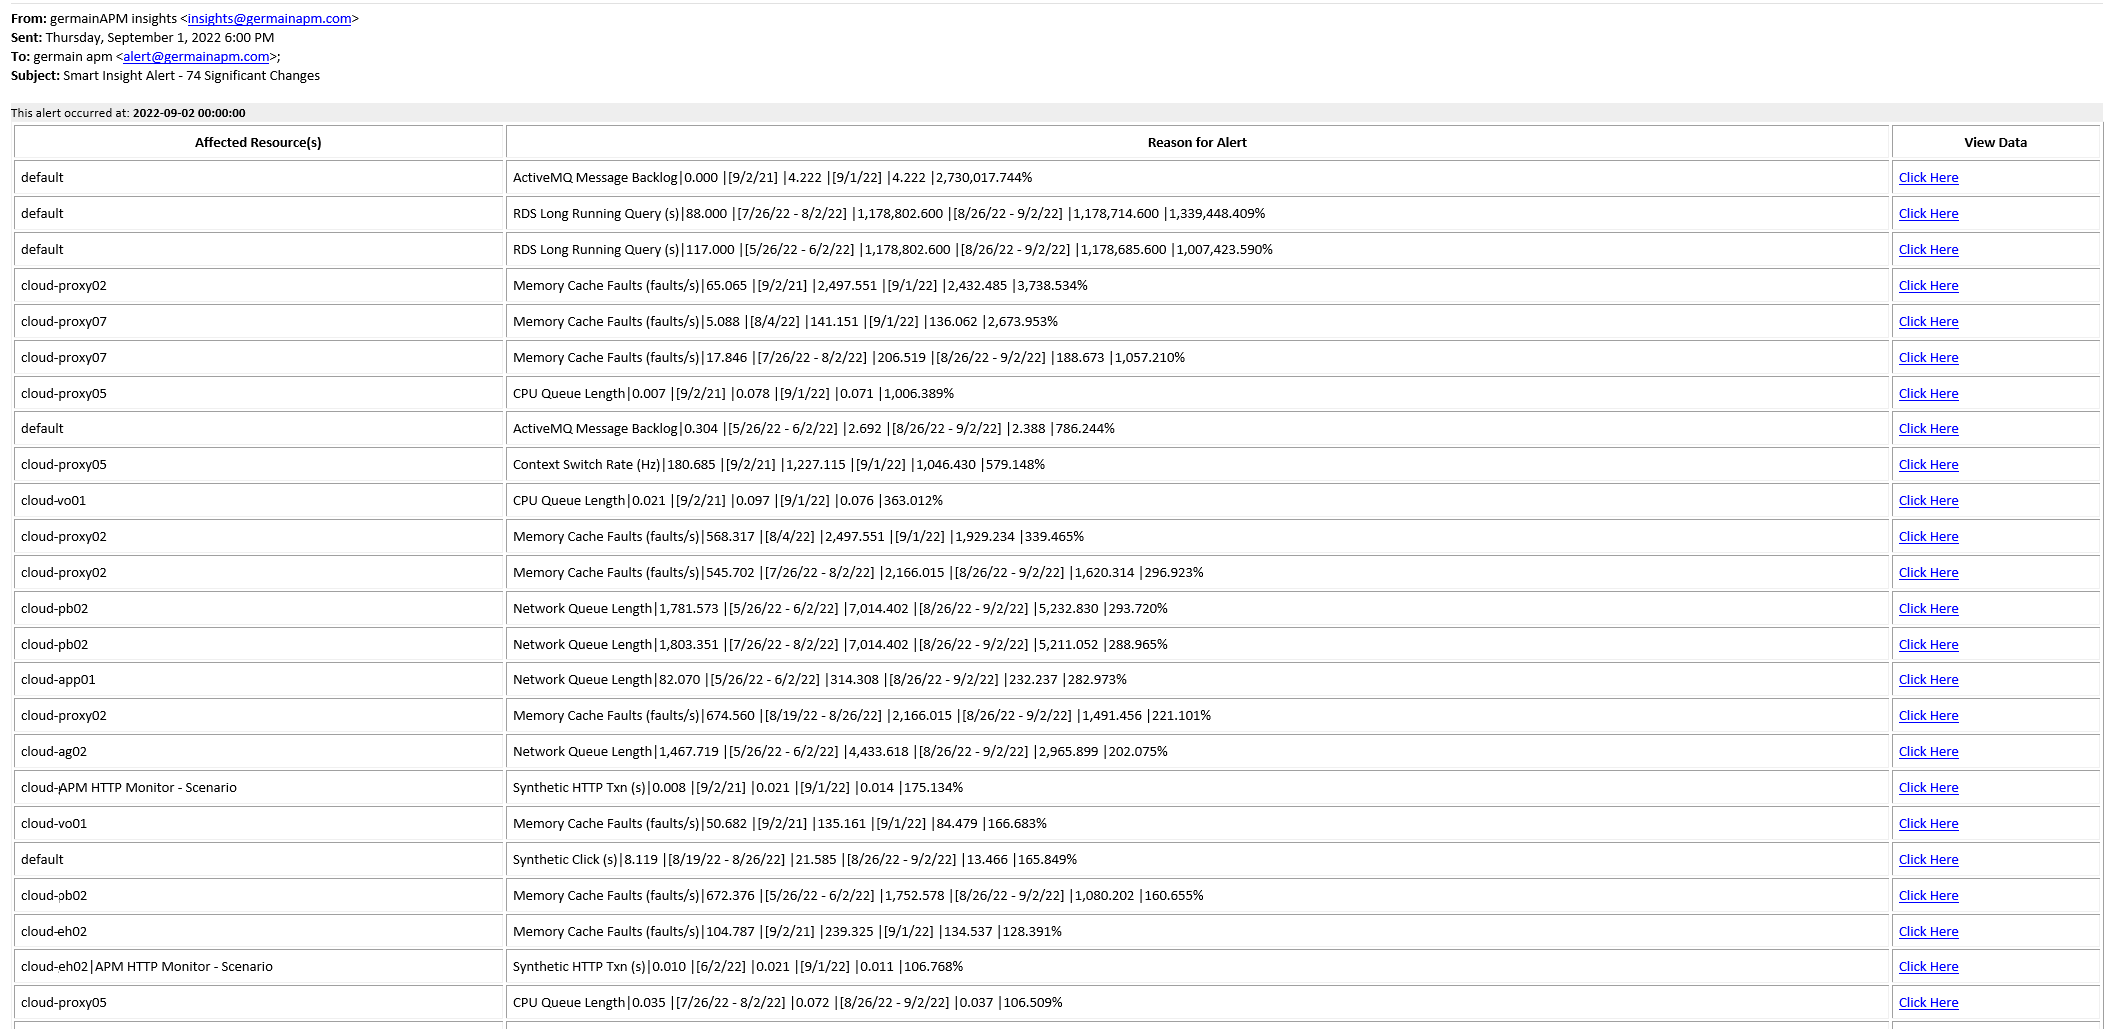
Germain UX now allows the application of constraints to a percent-change SLA based on baseline and current results. A new configuration property called "Threshold Expression" has been introduced for statistical SLAs, supporting advanced constraints. This allows for the utilization of variables such as:
-
Current: Represents the absolute value for the "current" period as defined by the SLA.
-
Baseline: Represents the absolute value for the "baseline" period as defined by the SLA.
-
Value: Represents the change between baseline and current values, either absolute or percentage.
-
Threshold: Represents the threshold value defined by the SLA.
For example, if both the baseline and current counts are less than 20, even if the percentage change exceeds a configured threshold, no alert will be triggered.
(current < 20 && baseline < 20) || (value < threshold)
SLA evaluation for multiple metrics on a single data point
Previously, only one metric (e.g., duration, value) could be evaluated against SLAs for a given data point. This feature now supports having SLAs for multiple metrics, such as Inactive Duration and Active Duration, along with color threshold values for both.
Use Case Example:
A client needed to identify how 80 employees spent their time while creating HR plans. Since every minute was significant to their business, they required Germain UX to analyze this in real-time and provide actionable insights.
Solution/Enhancement:
Germain UX now supports multiple SLAs for as many metrics as needed.
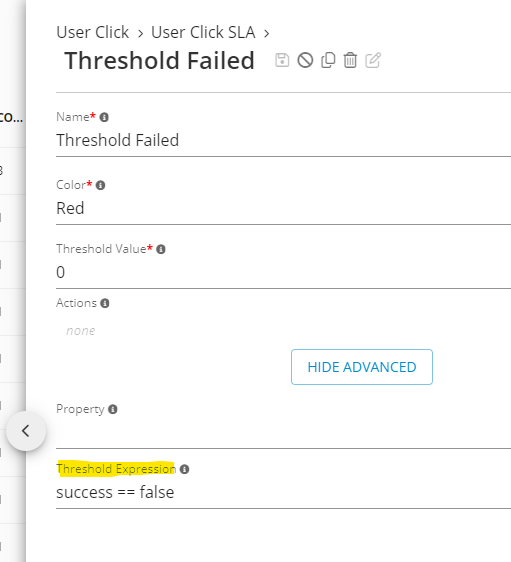
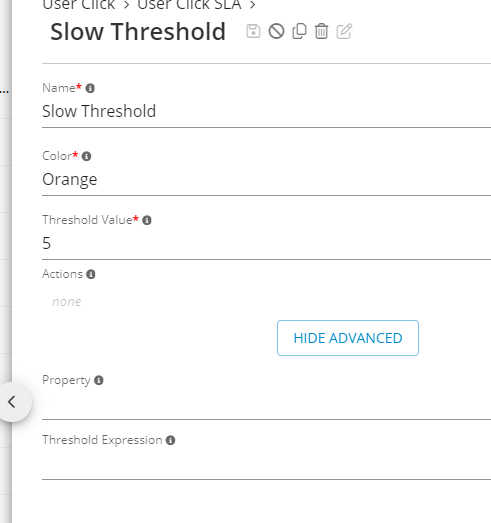
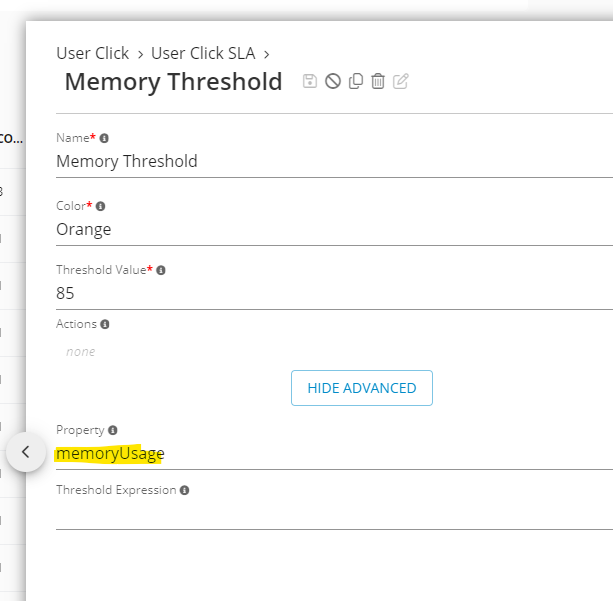
Example of User Click SLA considering 3 separate criteria or thresholds: slowness, failure, or large memory footprint.
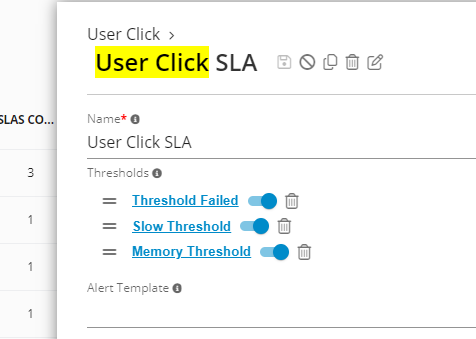
Thresholds are always evaluated in order, with the "worst" color ultimately being put onto the SLA (i.e., one threshold colors it RED, the other would color it ORANGE, the fact ends up with RED).
1st threshold uses expression to check if triggered or not:
2nd threshold evaluates against KPIs default property (duration):
3rd threshold evaluates against non-default property:
Service: Analytics
Feature Availability: 8.6.0 or later