
🔎 Element and Mark Performance Monitoring
GermainUX can collect application-specific browser performance measurements that are not included in standard page-load monitoring. These measurements help teams understand when important content becomes visible and how long custom application operations take for real users.
This monitoring is disabled by default and must be enabled for each applicable User Monitoring Profile.
⚙️ Capabilities
|
Capability |
What GermainUX monitors |
|---|---|
|
Element performance |
Rendering of image or text elements annotated by the application developer with the HTML |
|
Custom performance measures |
Durations created by the application between custom performance marks through the browser User Timing API. |
Each collected entry is stored as a GermainUX UX transaction with the type Browser:Performance Measure, making it available for analysis alongside the associated application, page, user, browser, and session context.
Common use cases
Use element and mark performance monitoring to:
-
Measure when important images or text become visible.
-
Track application-specific operations that standard browser timings do not represent.
-
Compare performance across pages, application versions, browsers, locations, or user populations.
-
Identify slow or unusual measurements affecting real users.
-
Analyze measurements through GermainUX KPIs, drill-through views, dashboards, SLAs, and session context.
Application instrumentation
Element timing
Add the elementtiming attribute to each supported image or text element that the browser should report.
<img
  src="/images/product.jpg"
  elementtiming="product-image"
  alt="Product"
/>
The browser’s Element Timing API determines which elements and properties are supported.
Custom measures
Instrument the application with browser performance marks and create a measure representing the duration between them.
performance.mark("search-start");

// Application operation

performance.mark("search-complete");
performance.measure(
  "search-duration",
  "search-start",
  "search-complete"
);
GermainUX collects the resulting measure, such as search-duration. Performance marks alone do not contain a duration; the application must create a performance measure from the relevant marks.
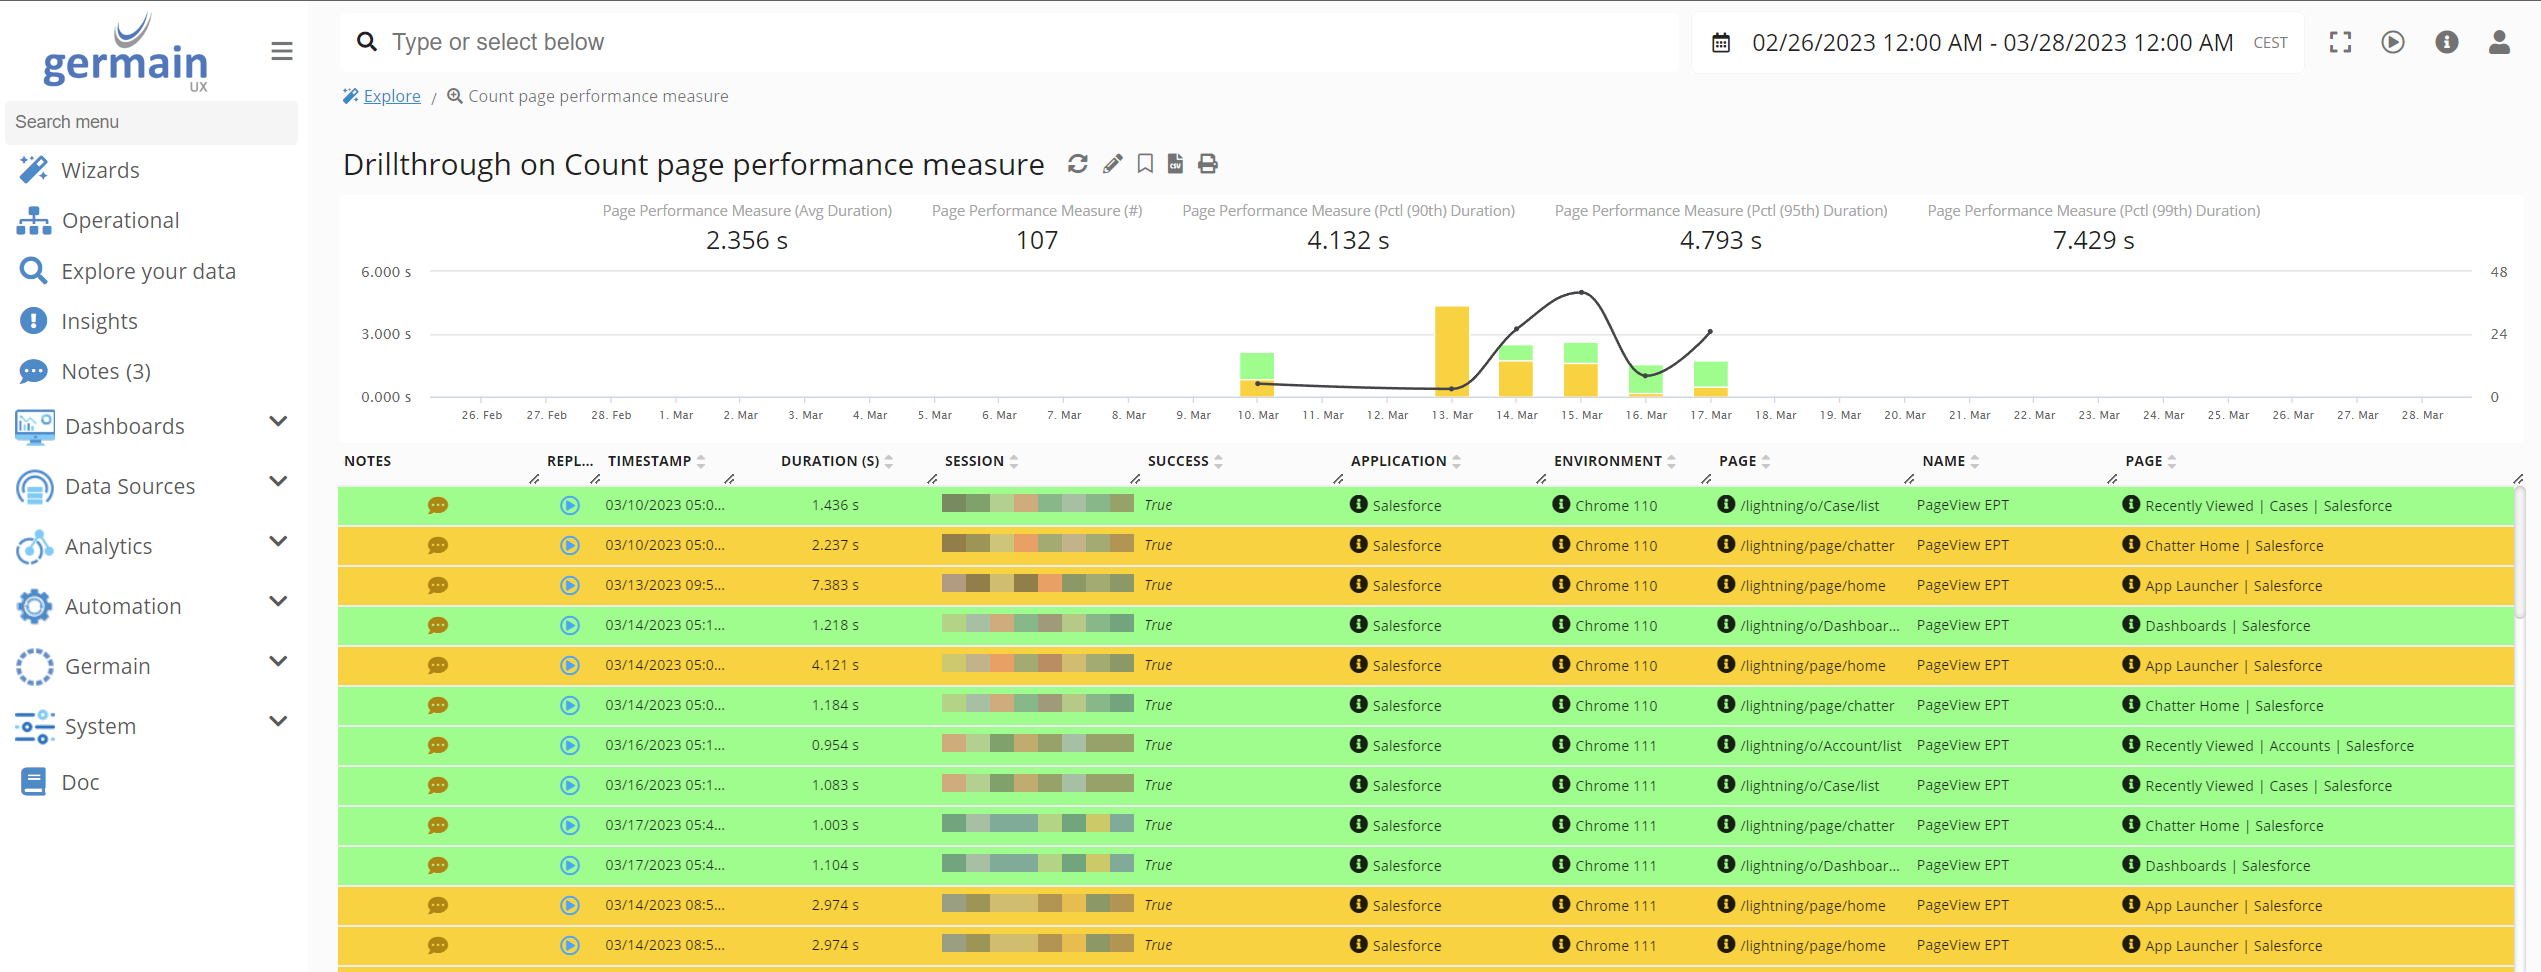
Enable element monitoring
Enable Element Timing collection in the GermainUX RUM JS initialization settings:
const settings = germainApm.getDefaultSettings();

settings.plugins.performance.elementMonitoringEnabled = true;

germainApm.start(settings);
Enable custom-measure monitoring
Enable User Timing measure collection:
const settings = germainApm.getDefaultSettings();

settings.plugins.performance.measureMonitoringEnabled = true;

germainApm.start(settings);
To collect only selected measures, specify their exact names:
const settings = germainApm.getDefaultSettings();

settings.plugins.performance.measureMonitoringEnabled = true;
settings.plugins.performance.measureMonitoringEntryNames = [
  "search-duration",
  "checkout-duration"
];

germainApm.start(settings);
If measureMonitoringEntryNames is not specified, GermainUX collects all available performance-measure entries.
Advanced configuration
|
Setting |
Purpose |
Default |
|---|---|---|
|
|
Collect entries reported through the Element Timing API. |
|
|
|
Collect measures reported through the User Timing API. |
|
|
|
Restrict collection to the specified measure names. If omitted, all measures are eligible for collection. |
|
|
|
Modify or filter generated performance data before it is sent to GermainUX. |
Not configured |
Use factProcessor only when application-specific filtering or transformation is required.
Browser support
|
Measurement |
Supported browsers |
|---|---|
|
Custom performance measures |
Recent versions of Chrome, Edge, Firefox, Opera, and Safari |
|
Element timing |
Recent versions of Chrome, Edge, and Opera |
Browser support depends on the browser’s implementation of the relevant web-performance API. Unsupported browsers do not produce the corresponding entries.
Deployment and configuration
|
For your browser environment |
|---|
|
Review Browser Monitoring. |
|
Deploy Browser Monitoring with the appropriate GermainUX browser component. |
|
Review the available Browser Monitoring configuration. |
|
Review the KPIs for User Monitoring and Replay. |
|
Review the available Browser Monitoring KPIs. |
|
Review the Browser Monitoring APIs. |
ℹ️ Get Help
The Germain Team can help you set this up. Contact GermainUX Support.
Component: JS Profiler, RUM JS, RUM Extension
Feature Availability: 2022.1 or later
Browser Support: only latest Chrome, Edge and Opera