
⚙️ Configure Error Monitoring for Salesforce
GermainUX detects, classifies, prioritizes, and analyzes errors affecting Salesforce users and business processes.
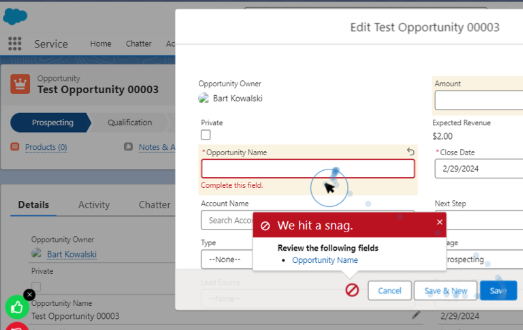
The objective is to separate actionable software failures from expected validation messages and technical noise, allowing teams to focus on issues with measurable business or user impact.
❓ GermainUX helps answer:
-
Which Salesforce errors affect users?
-
Which errors are new?
-
Which errors recur most frequently?
-
How many users, sessions, and workflows are affected?
-
Which errors prevent users from completing their work?
-
What actions occurred before the error?
-
Is the cause related to the browser, Salesforce, Apex, an API, or an integration?
-
Has the error stopped occurring after the fix?
🛰️ Error Sources
GermainUX can detect Salesforce errors from multiple sources.
|
Source |
Examples |
|---|---|
|
Salesforce user interface |
Error dialogs, error toasts, application errors, developer errors, form errors |
|
Browser |
JavaScript exceptions, console errors, unhandled browser events |
|
Network |
Failed or slow Aura requests, HTTP errors, API failures, invalid responses |
|
Salesforce server |
Apex exceptions, trigger failures, SOQL or DML failures |
|
Integrations |
Failed calls to connected applications or external services |
|
Salesforce logs and events |
Debug-log exceptions, operational events, server-side failures |
|
Business workflows |
Save, submit, approval, search, case, opportunity, and other workflow failures |
Deploy and configure the applicable monitoring components for the sources you need.
🗄️ Error Classification
Before configuring dashboards and alerts, distinguish the following categories.
|
Category |
Definition |
Example |
Recommended treatment |
|---|---|---|---|
|
User-facing technical error |
The software did not operate as intended, and the failure was presented to the user |
“An internal server error has occurred” |
Include in technical-error KPIs and prioritize by impact |
|
Background technical error |
The software failed, but the error was not directly displayed to the user |
JavaScript exception or failed API request |
Correlate with UX impact and investigate when actionable |
|
User validation |
The user attempted an invalid action and Salesforce provided expected guidance |
“Cancelled Reason is required” |
Track separately for UX or training analysis |
|
Known benign event |
A recognized event that requires no action |
Expected browser warning |
Exclude or suppress |
|
New or uncategorized error |
An error that does not match an existing category |
Newly introduced error after a deployment |
Surface and alert for review |
A message being visible to the user does not automatically mean that the user caused it. Use user-facing error for software failures displayed to users and user validation for expected feedback about incorrect or incomplete input.
Some existing GermainUX configurations use the internal field userError. In this context, it generally identifies an error relevant to the user experience. It should not be interpreted as proof that the user caused the problem.
📑 Prerequisites
Before configuring Salesforce Error Monitoring, confirm that:
|
Requirement |
Check |
|---|---|
|
Salesforce Real User Monitoring |
Salesforce Real User Monitoring is deployed for browser-level errors. |
|
RUM Extension |
The RUM Extension is installed and configured for the intended users. |
|
UX Monitoring Profile |
The Salesforce UX Monitoring Profile is active. |
|
HTTPS Connectivity |
Browsers can send HTTPS data to GermainUX. |
|
CSP Trusted Sites |
Salesforce CSP Trusted Sites are configured. |
|
Engine integration |
The GermainUX Engine integration is active for server-side monitoring. |
|
Server-side logging |
Apex, Debug Log, Event, or Log Monitoring is configured when required. |
|
Privacy |
Privacy rules are applied to error messages, request data, and Session Replay. |
For deployment instructions, see Deploy GermainUX for Salesforce.
💻 Configure Browser and User-Facing Error Monitoring
📂 Open the Salesforce UX Monitoring Profile
In GermainUX Workspace, navigate to:
GermainUX Workspace → Left Menu → Settings → Analytics → UX Monitoring Profiles → Salesforce
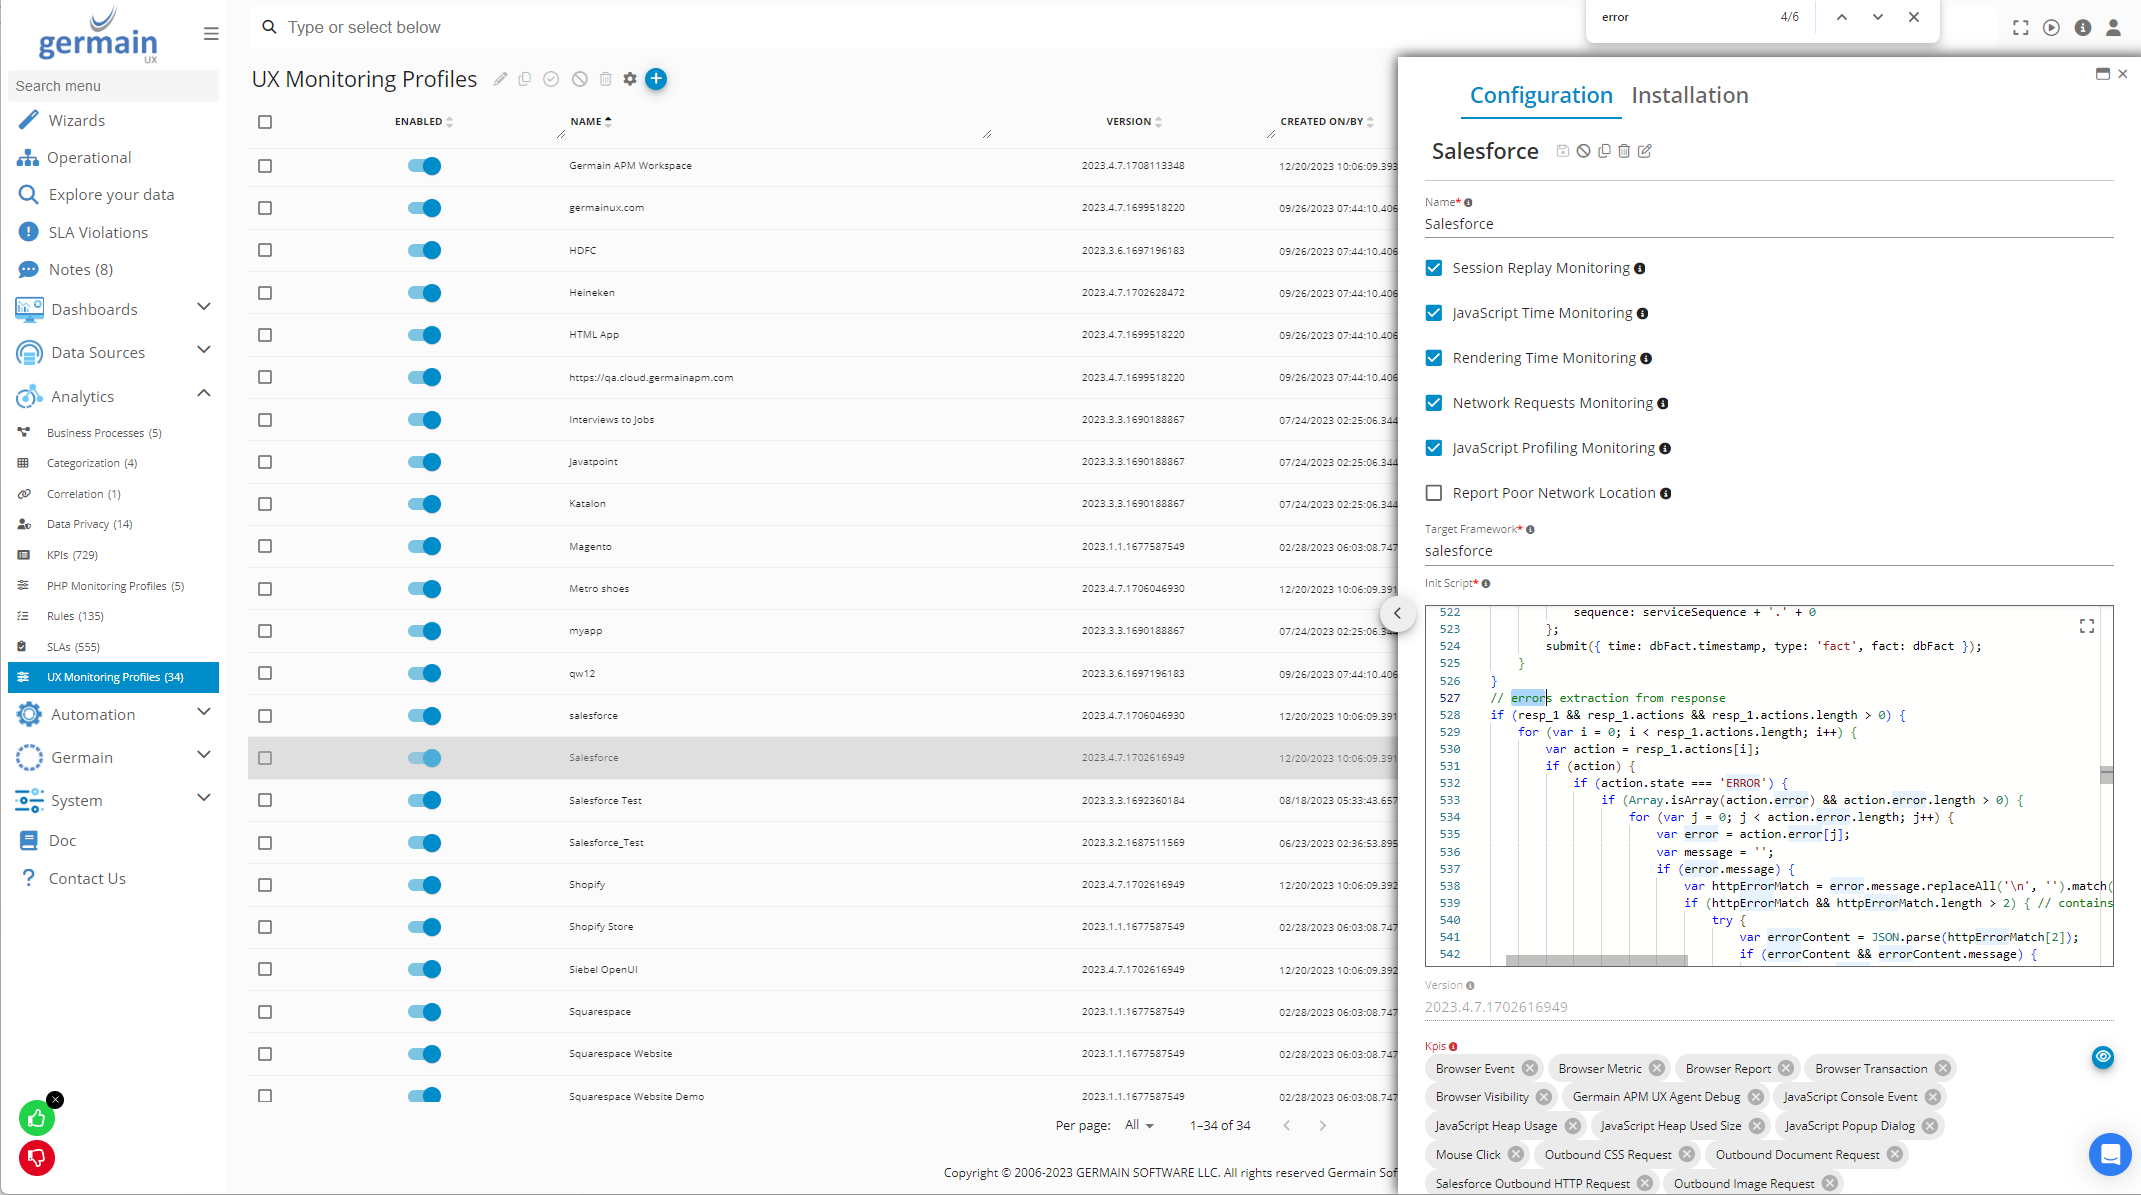
The Salesforce UX Monitoring Profile controls the browser-side monitoring used to detect and enrich Salesforce errors.
🧰 Profile Capabilities
The current Salesforce profile should provide the applicable configuration for:
-
Salesforce-specific browser integration
-
User and session identification
-
Salesforce application and component metadata
-
Console
errorandwarnevents -
Salesforce Aura errors
-
Application and developer errors
-
Error toasts and form-level errors
-
Network processing
-
Salesforce request and response processing
-
User clicks
-
Page and interaction performance
-
Session termination on logout
-
Search and workflow monitoring when configured
Use the current profile supplied with your GermainUX version. Do not replace it with code copied from an older documentation page unless instructed by Germain Software Support.
✅ Recommended Profile Settings
Review the following behaviors in the profile.
 Browser Log Threshold
Configure which browser log levels should generate facts.
A typical Salesforce profile emits:
settings.constants.logLevelToEmitAsFacts = "WARN";
This allows warnings and errors to be analyzed while avoiding lower-level console noise.
Increase or reduce the threshold according to the required diagnostic detail and data volume.
🚪 Session End Markers
Configure logout labels so GermainUX closes the user session when the user logs out.
Example:
settings.constants.sessionMarkerEnd = [
    "Log Out",
    "Logout"
];
Validate these labels against the organization’s language and Salesforce customization.
🔖 User and Application Metadata
Configure metadata providers for attributes such as:
-
Session ID
-
Username or anonymized user identifier
-
Salesforce application
-
Active Salesforce component
-
Business object
-
Page or view
-
Organization and environment
These attributes improve segmentation and correlation.
Do not collect raw identifiers when organizational privacy policies require anonymization.
📃 Console Errors and Warnings
Enable processing for:
settings.plugins.console = {
    methods: ["error", "warn"]
};
The Salesforce-specific processor should determine whether each console message is:
-
An actionable error
-
A relevant warning
-
Known noise
-
Sensitive and requiring sanitization
💬 Salesforce Error Dialogs and Toasts
The Salesforce integration can detect events such as:
-
Aura application messages
-
one:applicationError -
Lightning developer errors
-
force:showToasterror messages -
Form-page errors
-
Validation dialogs
-
Other supported Salesforce popup events
Captured facts should include available attributes such as:
-
Error name
-
Title
-
Message
-
Stack trace
-
Business-object identifier
-
User-facing status
-
Salesforce component
-
Timestamp
🌐 Network Errors
The Salesforce profile can process Aura and other Salesforce network activity.
Review:
-
Excluded URLs
-
Failed-status handling
-
Request and response parsing
-
Sensitive-body exclusions
-
Duplicate-request detection
-
Salesforce-specific request names
-
Correlation identifiers
Exclude monitoring of endpoints that generate irrelevant or high-volume traffic, such as configured streaming or analytics endpoints, when those calls are not required for the intended analysis.
🔁 Duplicate Request Detection
The profile can identify repeated network requests within a short period.
This may reveal:
-
Retried failed actions
-
Loops
-
Duplicate submissions
-
Repeated component requests
-
UX frustration
Configure the time window and repetition threshold according to expected Salesforce behavior.
🚀 Activate and Validate the Profile
After modifying the Salesforce UX Monitoring Profile:
-
Save the profile.
-
Confirm that it is assigned to the Salesforce application.
-
Reload Salesforce in a supported browser.
-
Start a new monitored session.
-
Trigger a safe, known error in a non-production environment.
-
Confirm that GermainUX captures the error.
-
Verify its name, message, user-facing status, session, and application metadata.
-
Open Session Replay and confirm that the error appears in context.
🗄️ Configure Server-Side Error Sources
Browser monitoring reveals what the user experienced. Configure the Engine-based Salesforce sources to add technical evidence.
|
Requirement |
Configuration |
|---|---|
|
Apex exceptions and stack traces |
|
|
Apex, SOQL, DML, and code-unit details |
|
|
Broader Salesforce log errors |
|
|
Supported Salesforce real-time events |
|
|
Salesforce instance incidents |
Combining browser and Engine telemetry helps determine whether the source is:
-
A Salesforce UI problem
-
Custom JavaScript
-
Apex code
-
SOQL or database activity
-
Salesforce platform behavior
-
An external integration
-
A network or browser problem
-
User validation rather than a technical failure
🏷️ Categorize Salesforce Errors
Without categorization, dynamically changing values can cause the same underlying error to appear as many unrelated messages.
For example:
Upsert failed. First exception on row 0 with id 001...
Upsert failed. First exception on row 0 with id 001...
These should normally receive the same category because the Salesforce record ID changes but the underlying failure pattern is identical.
🔧 Create a Categorization Rule
Navigate to:
Analytics → Categorization
Then:
-
Create or select a categorization configuration.
-
Select the error KPIs to which the rule applies.
-
Configure the fuzzy-matching threshold.
-
Add filters limiting the rule to Salesforce error facts.
-
Define exact-match prefixes or parsing logic for known dynamic messages.
-
Save the rule.
-
Test it against representative errors.
-
Reprocess historical data when appropriate.
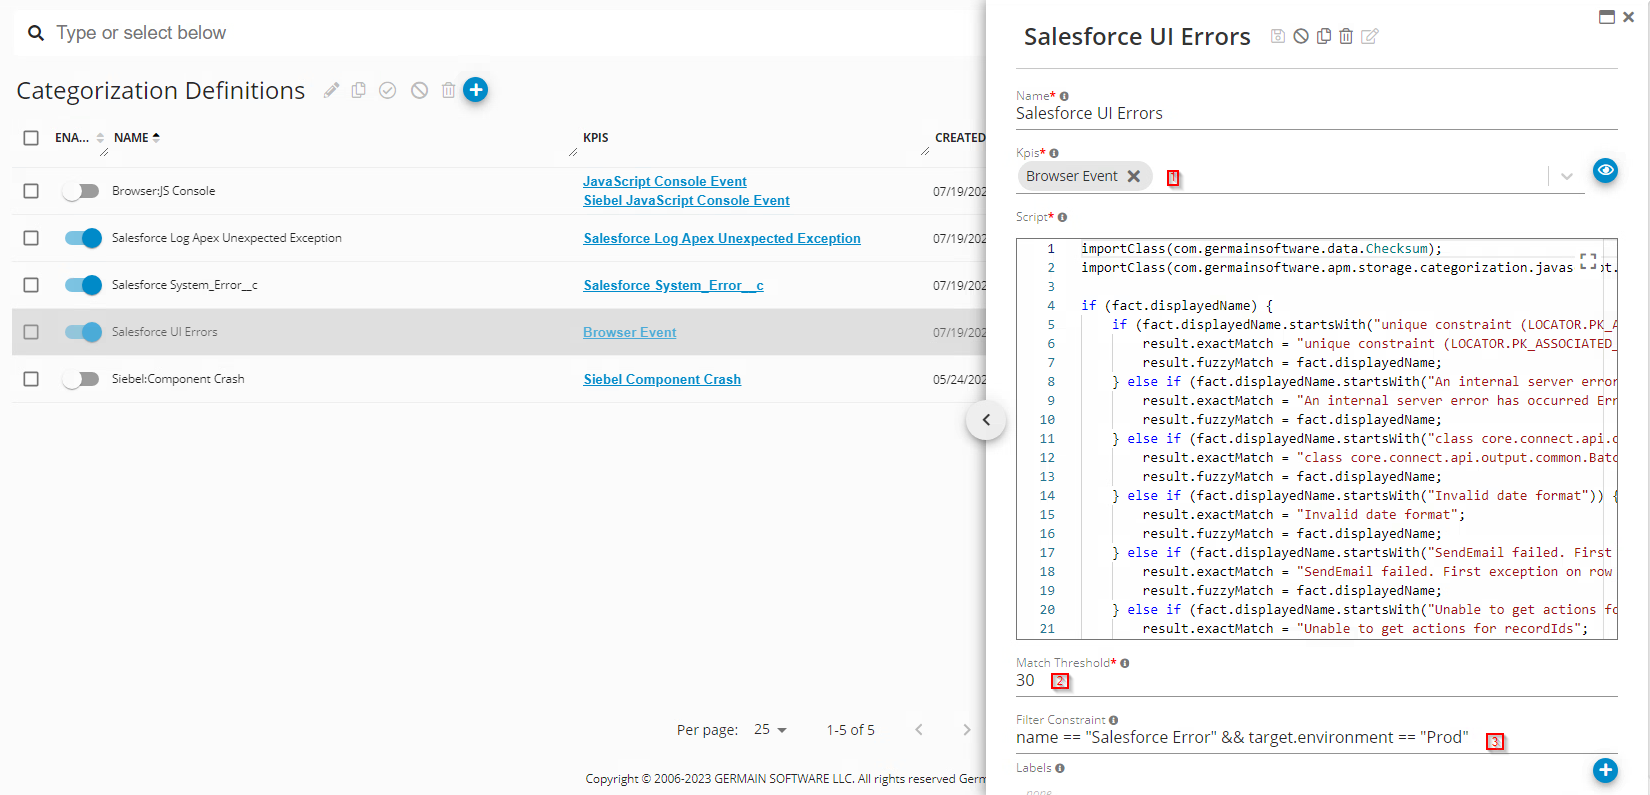
For more details, see Categorization.
✨ Simple Categorization Example
if (
    fact.displayedName &&
    fact.displayedName.startsWith(
        "Upsert failed. First exception on row 0 with id"
    )
) {
    result.exactMatch =
        "Upsert failed. First exception on row 0 with id";

    result.fuzzyMatch = fact.displayedName;
}
Every matching occurrence receives the same category identifier even when the Salesforce record ID or remaining message text differs.
💡 Recommended Salesforce Error Patterns
Common patterns that may require normalization include:
-
An internal server error has occurred Error ID -
Invalid date format -
SendEmail failed. First exception on row 0 -
Unable to get actions for recordIds -
Update failed. First exception on row 0 with id -
Upsert failed. First exception on row 0 with id -
Record ID is malformed -
This record was modified by -
Unexpected Response code -
You do not have access to the Apex class named -
You do not have the level of access necessary -
Messages containing changing
gackIdvalues
Organization-specific validation messages may also need classification, but they should be categorized separately from technical errors.
Examples include:
-
Required fields
-
Invalid email addresses
-
Missing approvers
-
Permission guidance
-
Instructions to use a workflow button
🔁 Recommended Categorization Logic
A reusable rule can normalize known error prefixes and use a checksum for messages that do not match a known pattern.
importClass(com.germainsoftware.data.Checksum);

if (fact.displayedName) {
    if (
        fact.displayedName.startsWith(
            "An internal server error has occurred Error ID"
        )
    ) {
        result.exactMatch =
            "An internal server error has occurred Error ID";
        result.fuzzyMatch = fact.displayedName;
    } else if (
        fact.displayedName.startsWith(
            "Update failed. First exception on row 0 with id"
        )
    ) {
        result.exactMatch =
            "Update failed. First exception on row 0 with id";
        result.fuzzyMatch = fact.displayedName;
    } else if (
        fact.displayedName.startsWith(
            "Upsert failed. First exception on row 0 with id"
        )
    ) {
        result.exactMatch =
            "Upsert failed. First exception on row 0 with id";
        result.fuzzyMatch = fact.displayedName;
    } else {
        result.exactMatch =
            Checksum.calculate(fact.displayedName);
    }
} else {
    result.exactMatch =
        fact.details
            ? Checksum.calculate(fact.details)
            : null;
}
Extend the rule with patterns relevant to the organization rather than maintaining a large list of unrelated sample messages.
🆕 Existing and New Errors
After categorization:
-
A known matching error receives an existing category ID.
-
A message that does not match an existing category receives a new category ID.
-
New categories can trigger alerts or review workflows.
-
Recurring occurrences can be aggregated and ranked together.
This makes it possible to identify genuinely new failures without alerting repeatedly on minor variations of known messages.
📊 Visualize and Analyze Salesforce Errors
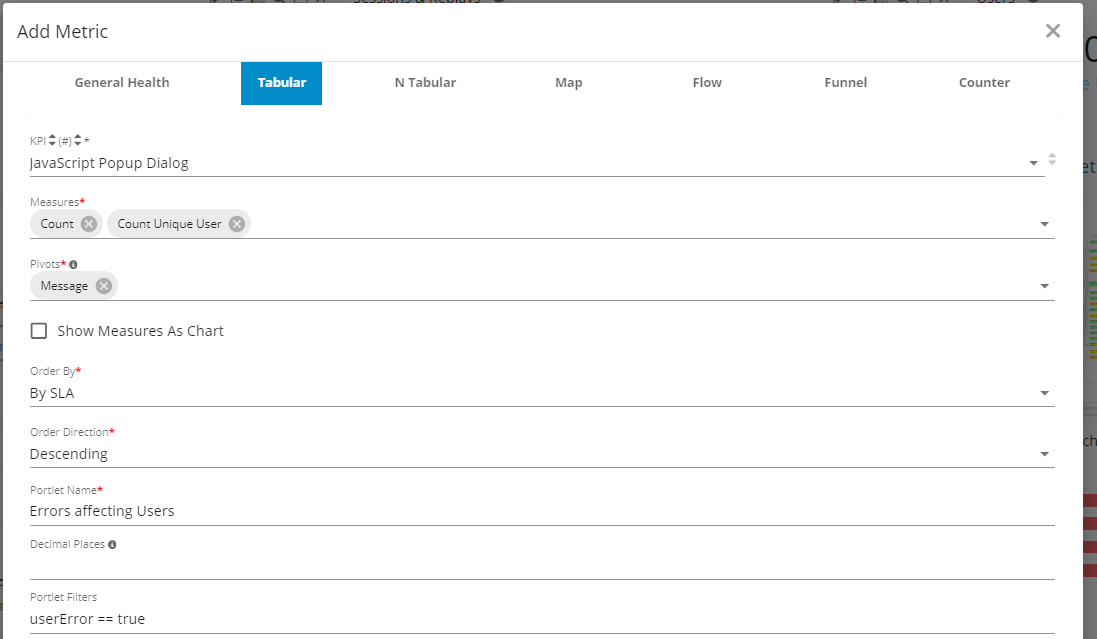
Create an error-analysis portlet using the KPIs that capture your Salesforce error sources.
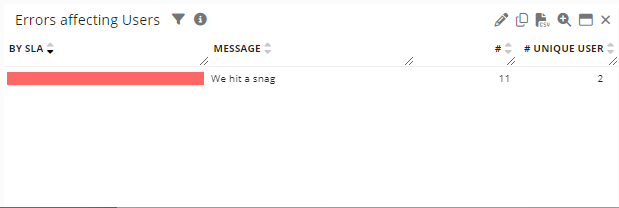
⭐ Suggested KPIs
Depending on the configuration and GermainUX version, use:
-
Browser Event
-
JavaScript Console Event
-
JavaScript Popup Dialog
-
Outbound HTTP Request
-
Apex exception KPIs
-
Salesforce Debug Log KPIs
-
Other custom Salesforce error KPIs
JavaScript Popup Dialog is particularly useful for errors displayed through Salesforce dialogs and toasts.
📏 Suggested Measures
Use measures such as:
-
Count
-
Unique error categories
-
Unique users
-
Unique sessions
-
Affected workflows
-
Total duration
-
Lost productivity
-
Failure rate
-
Percentage of sessions affected
🔄 Suggested Pivots
Use available dimensions such as:
-
Category ID
-
Name
-
Message
-
Error source
-
Application
-
Salesforce component
-
User
-
Profile
-
Page or view
-
Business process
-
Business-process step
-
Salesforce organization
-
Environment
-
Browser
-
Application version
🔍 Suggested Filter
For configurations using the legacy internal marker, filter on:
User Error = true
or:
userError = true
The precise label depends on the GermainUX version and fact schema.
This filter should represent user-relevant or user-facing errors—not necessarily errors caused by users.
🔬 Include or Exclude Specific Errors
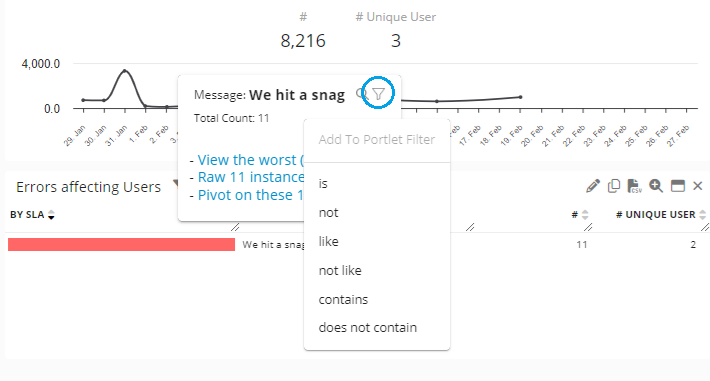
After creating the portlet, add filters to:
-
Include only user-facing technical errors
-
Exclude known benign messages
-
Separate user validation
-
Focus on one workflow or Salesforce component
-
Analyze only new categories
-
Exclude test users or non-production environments
-
Limit analysis to critical errors
Prefer classification over permanent exclusion when a message may still have UX or training value.
🔔 Configure Alerts and Reports
⚡ Immediate Alerts
Configure an alert when:
-
A new error category appears.
-
A critical user-facing error occurs.
-
Error volume exceeds a baseline.
-
An error affects multiple users.
-
A business-critical Salesforce workflow fails.
-
A previously resolved error returns.
-
Failure rate increases after a deployment.
-
An integration error blocks Salesforce users.
See Alerts.
📅 Scheduled Reports
Create scheduled reports showing:
-
New error categories
-
Highest-volume errors
-
Most affected users
-
Most affected workflows
-
Error trends
-
Resolved and recurring errors
-
Errors introduced after a release
-
User validations requiring UX improvement
-
Estimated productivity or business impact
See Automated Reports.
✅ Validate Error Monitoring
Test the configuration using representative controlled scenarios.
Verify that:
-
A Salesforce error dialog is captured.
-
An error toast is captured.
-
Browser console errors are captured.
-
Failed Salesforce requests are identified.
-
Apex exceptions appear when server-side monitoring is enabled.
-
Error messages are categorized correctly.
-
User validation is separated from technical failures.
-
Known benign events are excluded or suppressed.
-
New errors receive new category IDs.
-
User, application, page, and workflow context are present.
-
Session Replay shows the events leading to the error.
-
Alerts and reports include only the intended errors.
-
Sensitive values are masked or excluded.
No Errors Appear
If known Salesforce errors are missing:
-
Confirm that the RUM Extension is installed and active.
-
Confirm that the Salesforce UX Monitoring Profile is assigned.
-
Verify the application and profile names.
-
Confirm Salesforce CSP Trusted Sites.
-
Check browser connectivity to GermainUX.
-
Verify that console, popup, and network monitoring are enabled.
-
Check whether the error occurs inside an unmonitored or isolated context.
-
Review privacy, exclusion, and filtering rules.
-
Confirm that the selected dashboard time range and environment are correct.
-
For server-side errors, verify the Engine, OAuth, and applicable Salesforce monitors.
🔉 Too Many Errors or Too Much Noise
If dashboards contain too many non-actionable events:
-
Raise the browser log threshold.
-
Exclude known noisy endpoints.
-
Improve Salesforce-specific error processing.
-
Categorize dynamic messages.
-
Separate validation messages.
-
Exclude recognized benign categories.
-
Alert only on new, critical, or high-impact errors.
-
Rank issues by affected users, workflows, and business impact rather than raw count alone.
🔒 Security and Privacy
Salesforce error messages can contain:
-
User identifiers
-
Salesforce record IDs
-
Customer or patient information
-
Field values
-
Request and response content
-
Stack traces
-
Integration endpoints
-
Internal implementation details
Before production enablement:
-
Configure masking, anonymization, and exclusions.
-
Restrict access to error details and Session Replay.
-
Avoid collecting credentials, tokens, and session identifiers.
-
Review request and response-body collection.
-
Apply appropriate retention policies.
-
Validate the configuration with Salesforce security and privacy owners.
📚 Related Documentation
-
Other Analytics Features
-
Other Automation Features
ℹ️ Get Help
The Germain Team can help you set this up. Contact GermainUX Support.
Component: Engine, JS Profiler, Mobile App, RUM Ext, RUM JS
Feature Availability: 2017.1 or later