
✨ Campaign Analytics, Conversion Insights and Automation
GermainUX connects marketing campaigns with the real user behavior, digital experience and business outcomes that follow. It helps marketing, growth, product and eCommerce teams understand which campaigns attract valuable audiences, where campaign traffic encounters friction and why visitors convert—or fail to convert.
By combining campaign dimensions, conversion analytics, customer journey analysis, Real User Monitoring, Session Replay, feedback, technical observability and automation, GermainUX helps teams move beyond traffic and click counts to understand what happened after the click, why it happened and what action should be taken.
💼 Business Outcomes
GermainUX helps organizations:
|
Outcome |
|---|
|
Identify the campaigns, channels and audiences producing the strongest conversion and engagement. |
|
Understand why campaign traffic converts, abandons or fails to engage. |
|
Connect campaign performance with user behavior, website experience and technical conditions. |
|
Identify broken links, unavailable landing pages and failed campaign journeys before more budget is wasted. |
|
Compare new and returning users, traffic sources, landing pages, devices and other audience segments. |
|
Capture and analyze feedback from users acquired through each campaign. |
|
Prioritize improvements according to conversion impact, affected users and business value. |
|
Alert the appropriate teams and automate safe responses when campaign problems occur. |
❓ Questions GermainUX Helps Answer
Campaign Analytics helps teams answer questions such as:
|
Question |
|---|
|
Which campaigns generate the most conversions or desired outcomes? |
|
Which campaigns attract users who engage deeply or return later? |
|
Where do campaign visitors abandon their journey? |
|
Which landing pages, devices or audience segments underperform? |
|
Did errors, slowness or broken links reduce campaign performance? |
|
What did users actually do after arriving from a campaign? |
|
What feedback did campaign visitors provide? |
|
Which campaign issues should be fixed first? |
📇 Campaign Data and Dimensions
GermainUX captures available campaign, acquisition and experience data and stores it in searchable dimensions, including the Campaign Dimension.
Depending on the website, campaign configuration and connected data sources, analysis can include:
|
Dimension |
Examples |
|---|---|
|
Campaign |
Campaign name, identifier, source, medium, content and term |
|
Acquisition |
Referrer, channel, search engine, social network, email or referral site |
|
Audience |
New or returning user, geography, device, browser and other available segments |
|
Entry experience |
Landing page, page performance, errors and initial user actions |
|
Engagement |
Page views, interactions, active time, inactive time, session duration and bounce |
|
Journey |
Pages, actions and milestones completed after arrival |
|
Outcome |
Purchase, registration, form submission, lead, application or another configured conversion |
|
Feedback |
Rating, NPS, comments, sentiment and associated Session Replay |
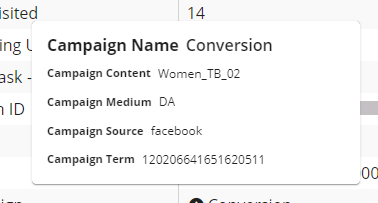
Preconfigured and custom KPIs can analyze these dimensions individually or together. This allows teams to compare campaign performance, identify trends and isolate the factors associated with successful or unsuccessful outcomes.
🔗 Campaign Attribution
GermainUX associates user activity and configured outcomes with the campaign and acquisition data available in the monitored session.
Attribution analysis can help teams:
|
Capability |
|---|
|
Measure the contribution of campaigns to conversions and other desired outcomes. |
|
Associate user actions with the campaign or touchpoint that brought the user into the monitored experience. |
|
Compare campaign sources, media, content, terms and landing pages. |
|
Follow campaign-acquired users through the monitored digital journey. |
|
Connect campaign data with behavior, performance, errors and feedback. |
GermainUX can capture standard campaign parameters such as Google Analytics UTM parameters and can ingest campaign data from compatible third-party sources.
The attribution model available depends on which campaign identifiers, user identifiers, touchpoints and connected data sources are captured. GermainUX should not be presented as providing complete multi-touch attribution unless the required cross-session and cross-channel data has been configured.
💸 Conversion Tracking and Analysis
GermainUX monitors the outcomes that matter to each organization, such as:
|
Conversion |
|---|
|
Purchases and revenue |
|
Registrations and account creation |
|
Form submissions |
|
Lead generation |
|
Product or service applications |
|
Trial activation |
|
Content engagement |
|
Workflow or journey completion |
Conversion analysis can compare rates and business outcomes by campaign, audience, traffic source, landing page, device, geography, product or any other captured dimension.
Teams can move from a conversion change to:
-
The campaigns and audiences most affected
-
The journey stage where users abandoned
-
The behavioral or technical friction associated with the drop-off
-
The relevant user sessions and supporting evidence
-
The corrective action with the greatest likely impact
Tracking implementation varies by application and conversion type. GermainUX can support campaign analysis across platforms such as Salesforce and , with site-specific configuration where required.
👥 Engagement and Interaction Quality
Traffic volume alone does not indicate whether a campaign attracted the right audience. GermainUX analyzes what users do after arriving.
Engagement measures can include:
|
Measure |
|---|
|
Active, inactive and total session duration |
|
Page views and navigation depth |
|
Clicks, interactions and feature usage |
|
Bounce and early abandonment |
|
Journey milestones completed |
|
Searches and content consumption |
|
Repeated or confused behavior |
|
Return visits and subsequent activity, when identifiable |
These measures help teams distinguish campaigns that generate superficial traffic from campaigns that attract users who engage meaningfully and progress toward conversion.
🔁 New Versus Returning Users
Campaign performance can be segmented by new and returning users to understand both acquisition and re-engagement.
Teams can compare:
|
Aspect |
|---|
|
Traffic volume |
|
Engagement and session duration |
|
Conversion rate |
|
Journey completion |
|
Feedback and satisfaction |
|
Errors and performance conditions |
|
Products, pages or content viewed |
This helps determine whether a campaign attracts new audiences, brings existing users back or performs differently for each group.
🚦 Traffic Sources, Referrers and Landing Pages
GermainUX captures available referrer and entry-page information to show where users came from and where their monitored journey began.
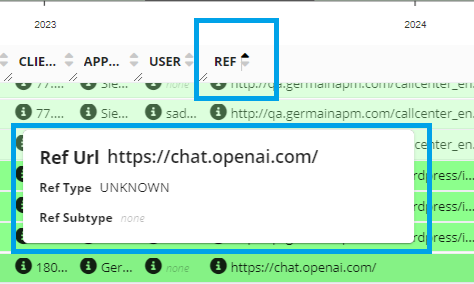
Traffic can be categorized as:
|
Referrer type |
Description |
|---|---|
|
Direct |
The user entered the site directly, used a bookmark or arrived without an available referrer. |
|
Internal |
The user navigated from another page within the monitored website or application. |
|
Search |
The user arrived from a recognized search engine. |
|
Social |
The user arrived from a recognized social platform or social link. |
|
Unknown |
The source could not be classified from the available data. |
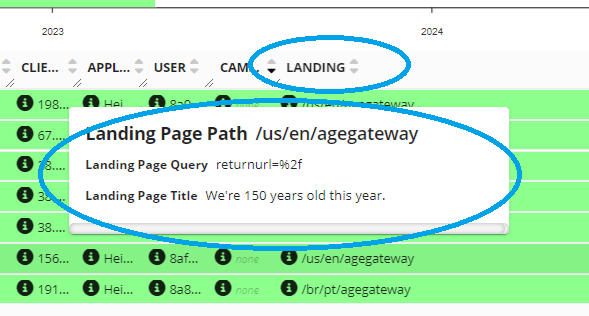
Referrer URLs, domains, query information and landing pages can be analyzed alongside campaign parameters, behavior and conversion.
Referrer Info:
Browser privacy controls, application architecture, redirects and referring-site policies may limit referrer information. “Direct” therefore means that no usable external referrer was available; it does not always prove that the user manually typed the URL.
🧭 Campaign Journey and Drop-Off Analysis
GermainUX follows campaign traffic beyond the landing page to reveal how users progress through the monitored journey.
Teams can analyze:
|
Area |
|---|
|
Entry and landing pages |
|
Navigation and content progression |
|
Product or service discovery |
|
Registration, form or checkout milestones |
|
Drop-off and abandonment points |
|
Errors and performance issues encountered |
|
Conversion and post-conversion activity |
Funnel and flow visualizations quantify progression at scale. Teams can then drill into underperforming stages, affected segments and individual sessions to understand why users dropped off.
🎞️ User Behavior and Session Replay by Campaign
GermainUX Real User Monitoring and Session Replay show what campaign visitors actually experienced.
Teams can filter and search sessions by campaign, traffic source, landing page, outcome, error, behavior or audience attribute. Session Replay can reveal:
|
Insight |
|---|
|
Whether campaign messaging matched the landing-page experience |
|
Which content and calls to action users engaged with |
|
Where navigation or forms created confusion |
|
What users did immediately before abandoning |
|
Whether an error, slowdown or unavailable feature blocked progress |
|
Why users from one campaign behaved differently from another |
Quantitative campaign results can therefore be supported by qualitative evidence without requiring teams to watch random recordings.
Learn more about Real User Monitoring and Session Replay.
💬 Feedback and Satisfaction by Campaign
The GermainUX Feedback Popup—or a compatible third-party feedback source—can collect feedback from users in real time.
Feedback can be analyzed by:
|
Dimension |
|---|
|
Campaign and traffic source |
|
Landing page and journey stage |
|
New or returning user |
|
Conversion outcome |
|
Device, geography or other audience segment |
|
Rating, NPS, comment category or sentiment |
Each response can be connected with the corresponding user session, allowing teams to understand what the user experienced before providing feedback.
High-risk feedback can trigger alerts, follow-up workflows or approved automated actions.
Learn more about the Feedback Popup
Learn more about GermainUX automation
🔧 Broken Campaign and Landing-Page Detection
GermainUX identifies campaign links that lead to missing, unavailable or failing pages. This helps organizations prevent paid and organic traffic from being sent into a broken experience.
Detection can occur in two complementary ways:
|
Detection method |
Purpose |
|---|---|
|
Proactive website crawling |
Tests configured pages and links before or independently of real-user traffic. |
|
Real-time HTTP analysis |
Detects failures encountered by actual campaign visitors. |
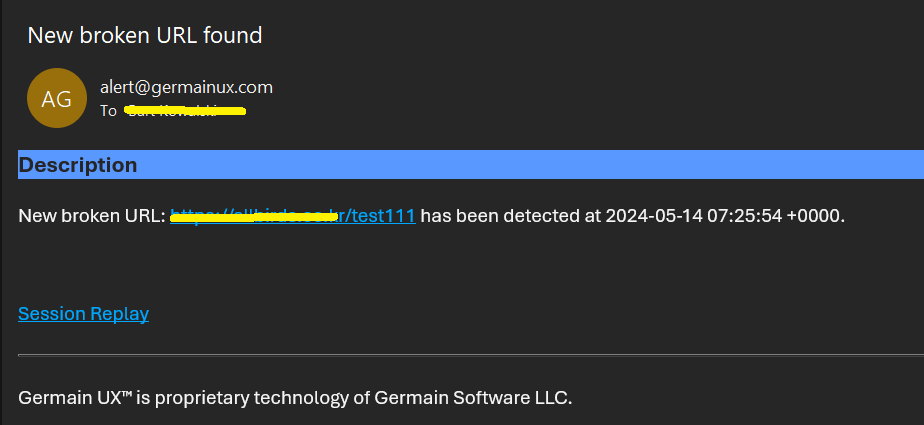
When a problem is detected, GermainUX can alert the appropriate team and provide evidence about the affected URL, campaign traffic and resulting user impact.
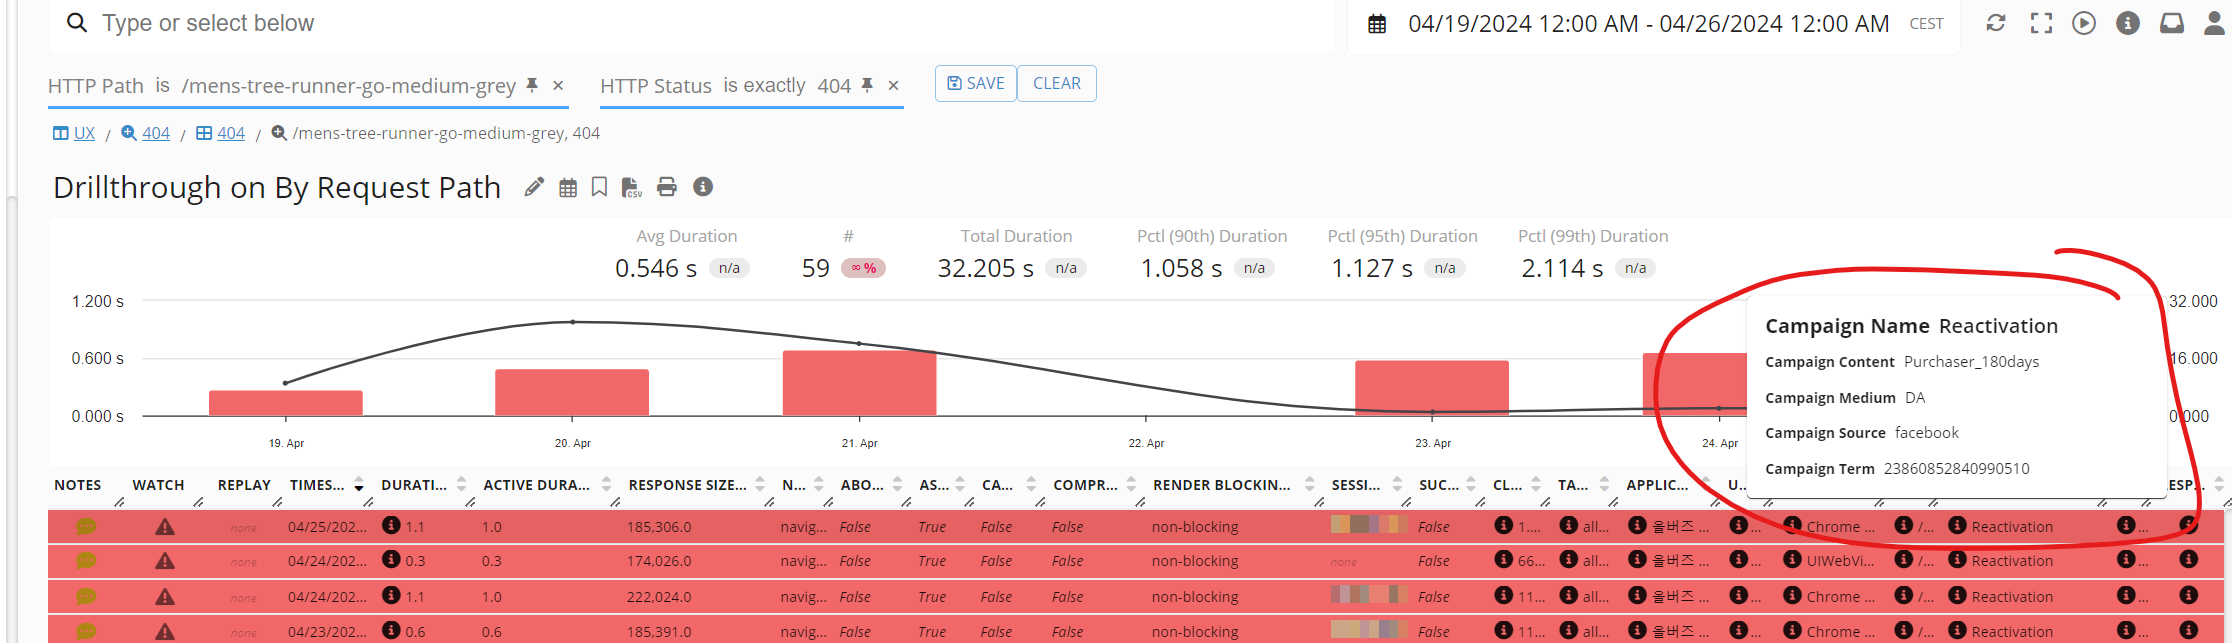
Alert are automatically sent when a broken campaigns are detected:
⚙️ Technology Impact on Campaign Performance
Campaigns can underperform even when their targeting and creative are effective. GermainUX correlates campaign outcomes with technical experience to identify issues such as:
|
Issue |
|---|
|
Slow or unavailable landing pages |
|
Failed resources and HTTP requests |
|
Browser errors and freezes |
|
Poor mobile performance |
|
Slow forms, searches, carts or checkout flows |
|
Failed APIs and third-party integrations |
|
Performance differences across devices, browsers or geographies |
This helps marketing and technical teams distinguish a campaign problem from a digital-experience problem and work from the same evidence.
🤖 AI-Assisted Campaign Analysis
AI Explore allows teams to ask natural-language questions about campaigns, audiences, engagement, journeys, conversions, feedback and technology issues.
GermainUX can also assist teams by:
|
Capability |
|---|
|
Detecting unusual changes in campaign performance |
|
Identifying the segments and journey stages most affected |
|
Summarizing relevant user sessions |
|
Categorizing feedback and friction patterns |
|
Ranking issues by conversion or business impact |
|
Recommending areas for further investigation or corrective action |
AI-generated findings should support—not replace—appropriate marketing, product and technical review.
🔔 Alerts, Reports and Automation
GermainUX can turn campaign analysis into action through:
|
Capability |
Purpose |
|
Real-time alerts |
Notify teams about broken campaigns, conversion drops, errors or high-risk feedback |
|
Scheduled reports |
Summarize campaign performance, issues and recommendations for each stakeholder |
|
Anomaly detection |
Identify unusual changes in traffic, engagement, conversion or technical health |
|
Guided investigation |
Link teams directly to the affected segments, sessions and supporting evidence |
|
Automated workflows |
Execute approved follow-up or remediation actions when automation is considered safe |
Reports, KPIs, measures, dimensions and recommendations can be customized for the organization’s campaign strategy and business outcomes.
📊 KPIs and Custom Analytics
GermainUX provides preconfigured campaign KPIs covering acquisition, engagement, conversion, user experience and technical health. Additional KPIs can be created for organization-specific campaigns, conversion events and business measures.
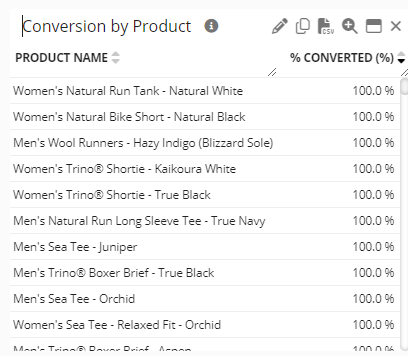
Review the preconfigured Campaign KPIs.
🔒 Security and Privacy
Campaign and user data should be collected and analyzed according to the organization’s consent, privacy, retention and access requirements.
Depending on the deployment, GermainUX can mask, anonymize or exclude sensitive information. The availability of cross-session, demographic or user-level analysis depends on the identifiers and consented data the organization is permitted to collect.
📖 Get More Information
GermainUX can help determine which campaign dimensions, conversion events, KPIs and integrations are appropriate for your website or application.
View the campaign analytics case study
ℹ️ Get Help
The Germain Team can help you set this up. Contact GermainUX Support.
Service: Analytics
Component: RUM JS, RUM Extension, RUM Windows
Feature Availability: 2014.1 or later