
⚙️ Oracle Siebel CRM Monitoring, Analytics and Automation
GermainUX continuously monitors Oracle Siebel CRM environments end to end, 24/7 and in real time. It helps organizations identify and resolve the user experience, workflow and technology issues that reduce CRM adoption, employee productivity, operational efficiency and application reliability.
By combining Real User Monitoring, Session Replay, process mining, application performance monitoring, analytics and automation, GermainUX helps teams understand not only what happened, but also why it happened, who was affected and what action should be taken. When appropriate and considered safe, remediation can also be automated.
🎯 Business Outcomes
GermainUX helps organizations using Oracle Siebel CRM:
|
Outcome |
Details |
|---|---|
|
Increase user adoption |
Increase user adoption by identifying the screens, actions and workflows that create friction. |
|
Improve employee productivity |
Improve employee productivity by detecting bottlenecks, excessive complexity and time lost within business processes. |
|
Reduce time to resolve issues |
Reduce the time required to detect, diagnose and resolve UX, workflow and technology issues. |
|
Improve application reliability |
Improve application availability, performance, capacity and operational stability. |
|
Strengthen user support |
Strengthen user support with searchable evidence and millisecond-precise Session Replay. |
|
Prioritize improvements |
Prioritize improvements according to the number of users affected and the resulting business impact. |
|
Proactive detection & remediation |
Detect emerging issues proactively and automate safe remediation workflows. |
🔍 What GermainUX Monitors
GermainUX provides visibility across the complete Siebel experience and technology stack.
|
Area |
Examples of monitored activity |
|---|---|
|
User experience |
User clicks, navigation, searches, browser activity, errors, crashes, feedback and user sessions |
|
Adoption and productivity |
Feature usage, workflow completion, process delays, bottlenecks, repeated actions and time lost |
|
Browser and network |
Browser-side eScript, JavaScript, page activity and inbound and outbound HTTP requests |
|
Siebel application |
Enterprise Servers, Object Managers, components, tasks, workflows, EAI and web services |
|
Infrastructure |
Web servers, load balancers, capacity, availability, uptime and resource constraints |
|
Data and integrations |
SQL activity, databases, integration transactions and connected systems |
|
Diagnostic data |
Object Manager logs, browser logs, FDR files, core files, exceptions and custom application logs |
🎥 Real User Monitoring and Session Replay
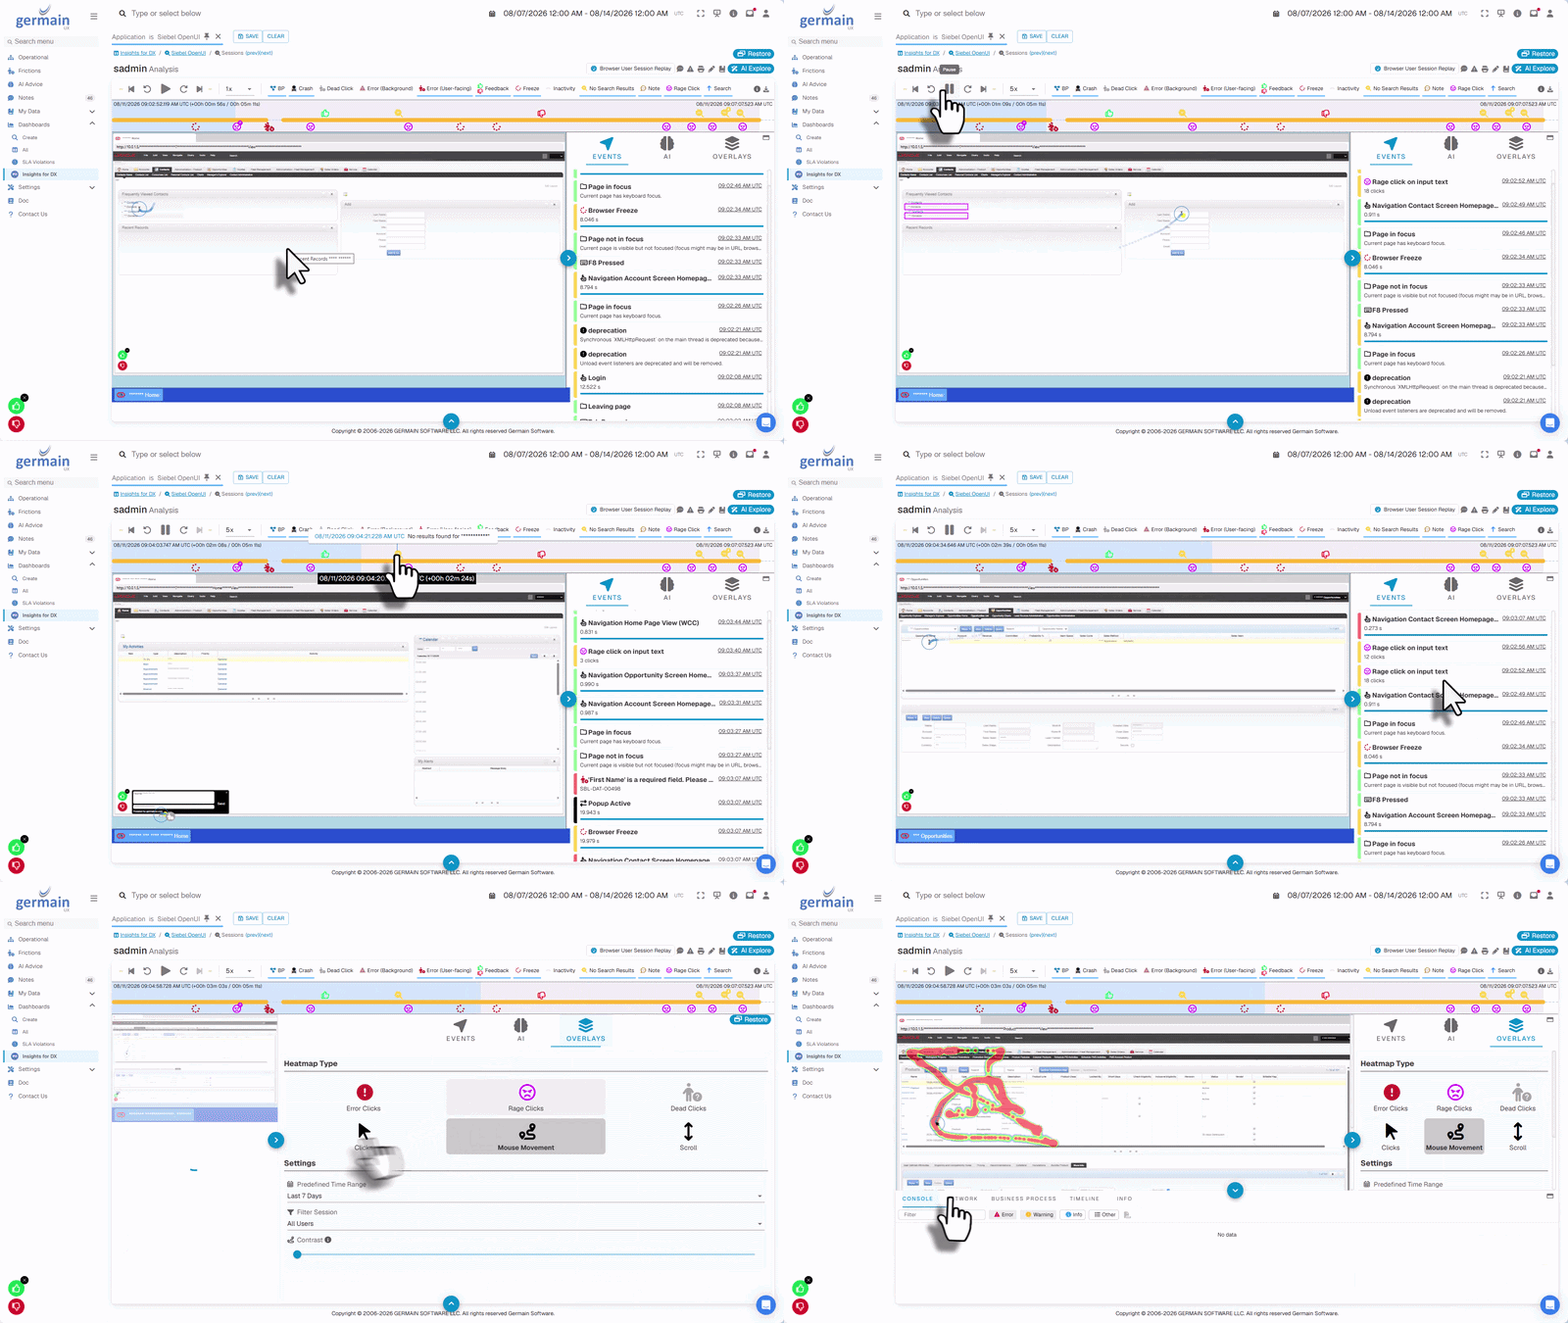
GermainUX records real Siebel user activity with millisecond-level timing precision, helping teams quickly understand what users experienced and why an issue occurred.
Instead of reviewing hours of recordings, teams can search for specific users, actions, errors, performance conditions or business events and replay the moments that matter. Session data and related metadata remain searchable both across the user population and within individual sessions.
📋 Capabilities include:
|
Capability |
Details |
|---|---|
|
Detailed recording and replay |
Detailed recording and replay of real user sessions |
|
Correlation |
Correlation of user activity with errors, performance and backend transactions |
|
Conversation Analysis |
When integrated with a chat bot, whatsapp (or equivalent), sentiment analysis of the conversion going between the siebel user and the client or chatbot. |
|
Workflow |
Identifies and analyzes when a Siebel user performs one of the critical workflow an organization cares about. |
|
Search |
Search across users, sessions, actions and business metadata |
|
Identification of friction |
Identification of UX, adoption, productivity and performance friction |
|
Heatmaps |
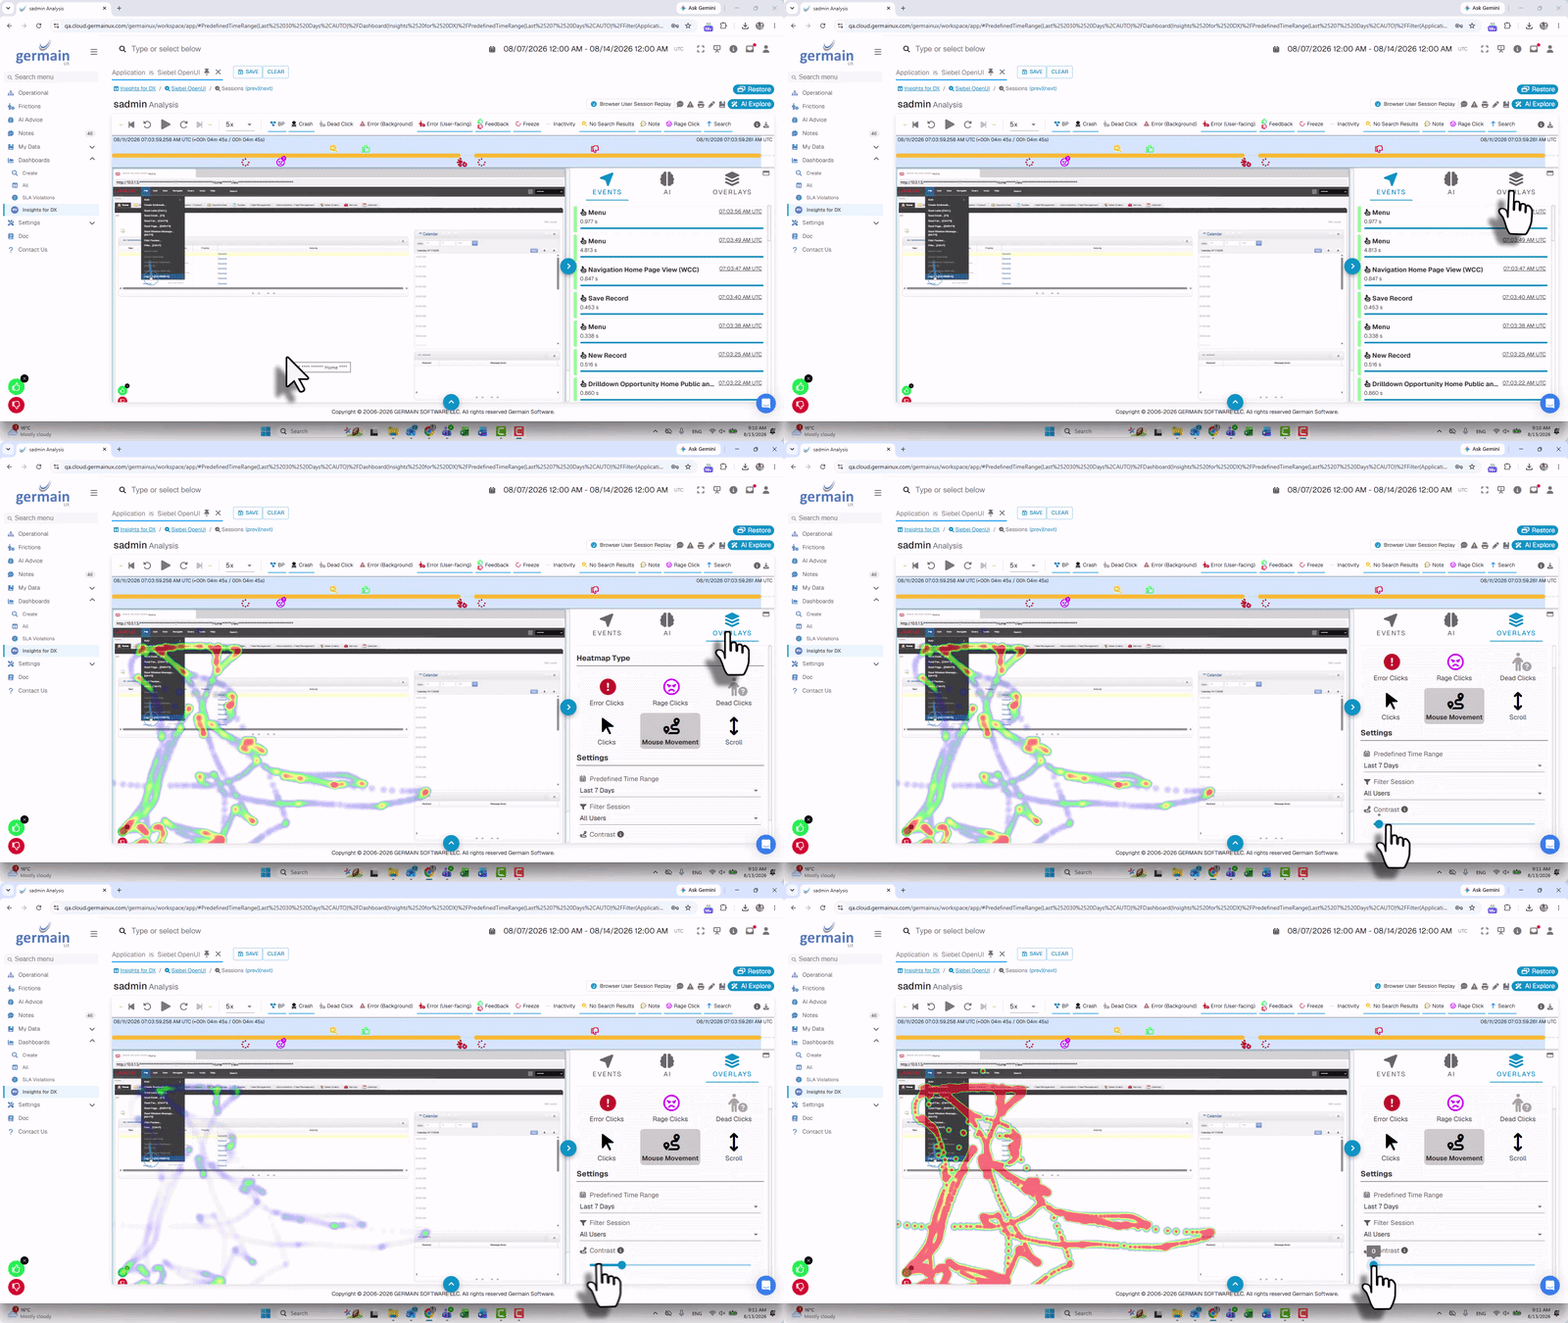
Six types of heatmaps for analyzing user behavior |
|
Privacy controls |
Privacy controls supporting the masking, anonymization or exclusion of sensitive data |
GermainUX supports Real User Monitoring across Siebel HI, SI, Open UI or Redwood interfaces. Available capabilities can vary by Siebel version, interface and deployed GermainUX components.
Replay of a Siebel User Session that was recorded in near real-time by GermainUX:
6 Heatmaps for Siebel CRM Pages:
Learn more about Real User Monitoring and Session Replay.
🤖 AI-Generated Session Summaries
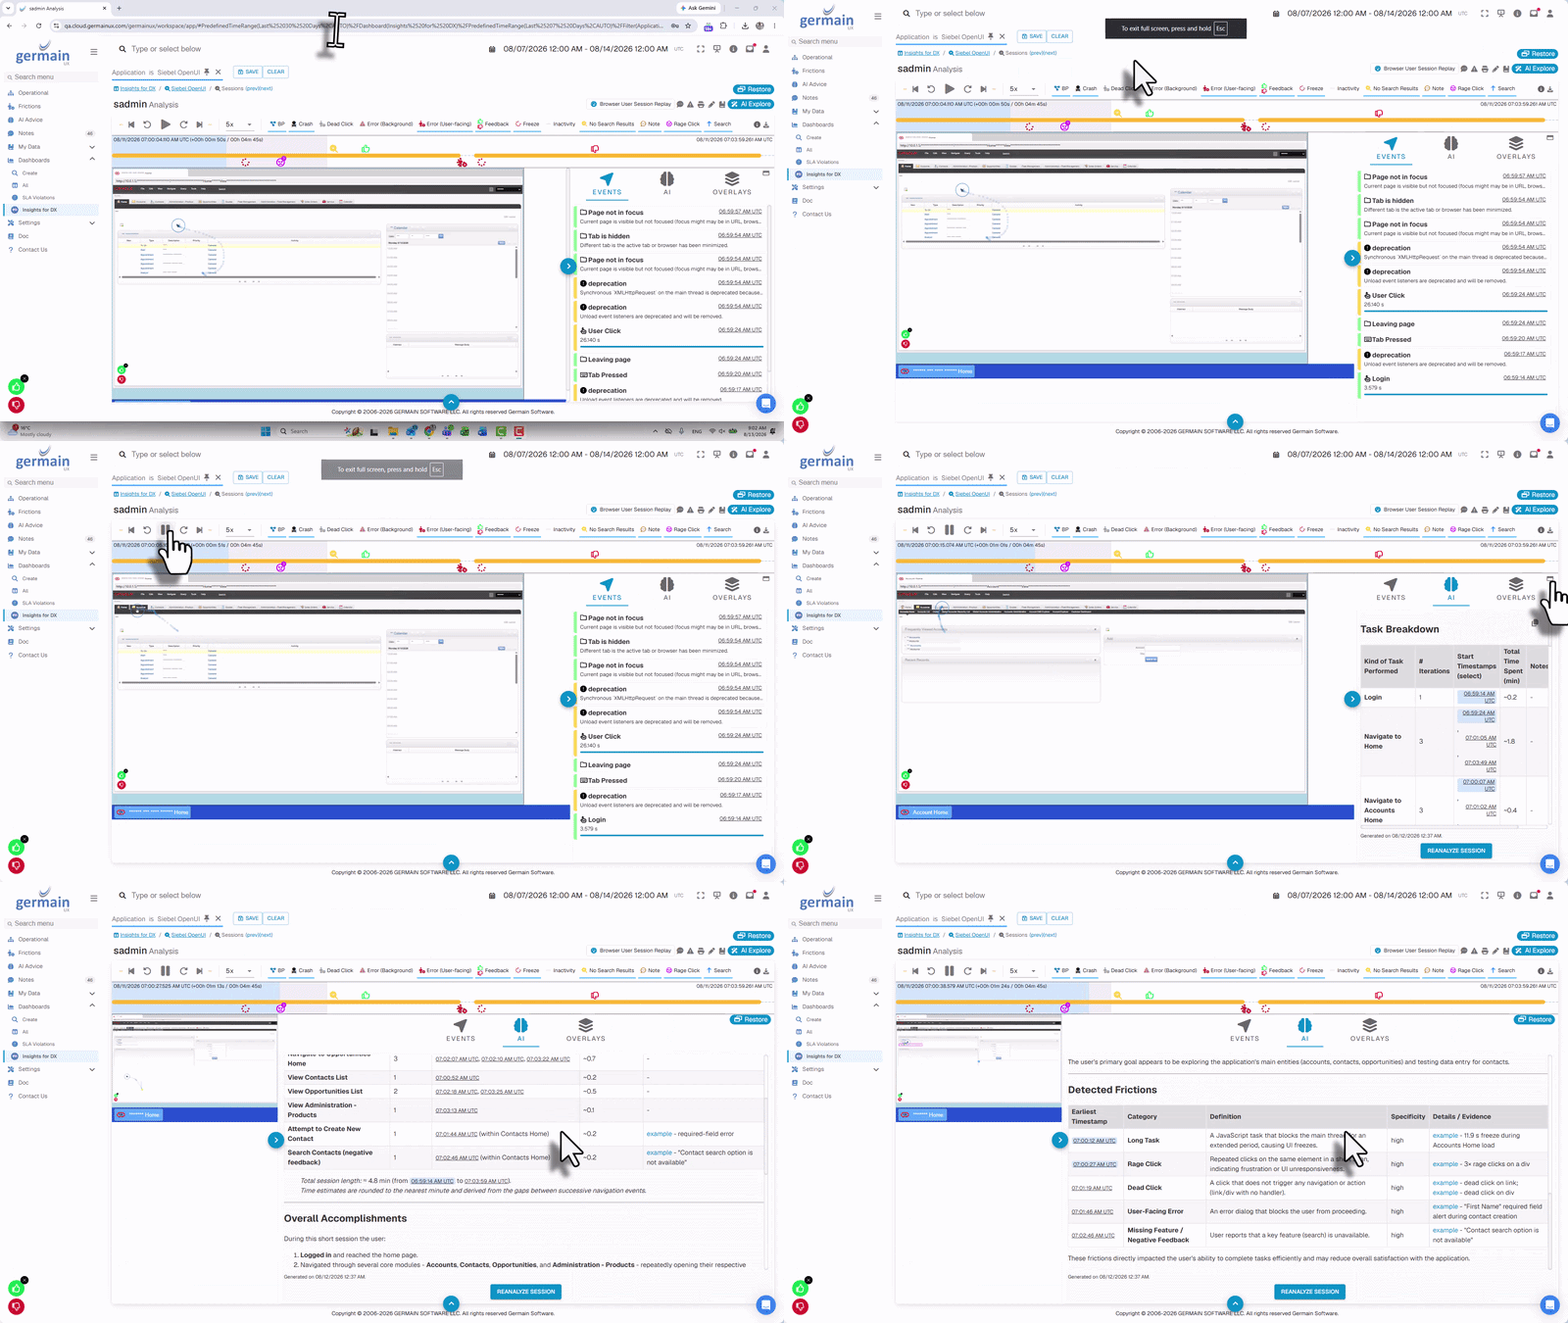
GermainUX can summarize an individual user session so teams do not need to watch an entire workday of activity. The summary describes what the user attempted to accomplish, where friction occurred and what may have affected productivity or adoption.
GermainUX can also analyze multiple sessions together to identify the most frequent or consequential UX, adoption and productivity issues, helping teams focus on improvements with the greatest business impact.
💬 User Feedback and Surveys
The GermainUX Feedback Popup allows users to submit feedback directly within Oracle Siebel CRM. Each response can be analyzed alongside the corresponding recorded session, providing the behavioral and technical context needed to understand the user’s experience.
Learn more about the Feedback Popup.
📈 Conversation and Sentiment Analysis
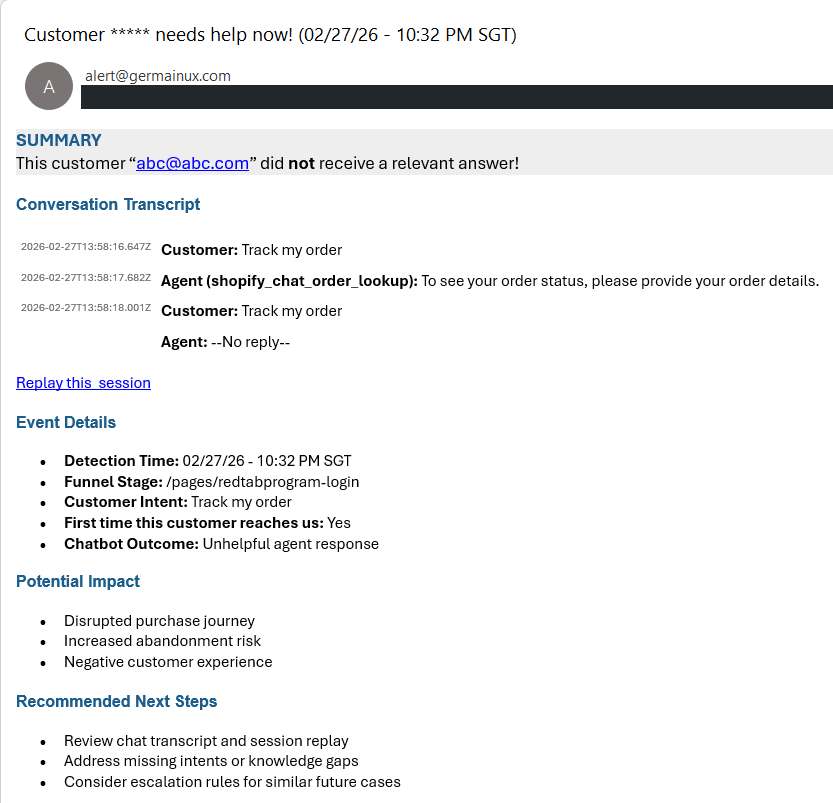
For environments where Siebel users interact with customers, colleagues or chatbots, GermainUX can analyze conversations to:
-
Detect negative or high-risk interactions
-
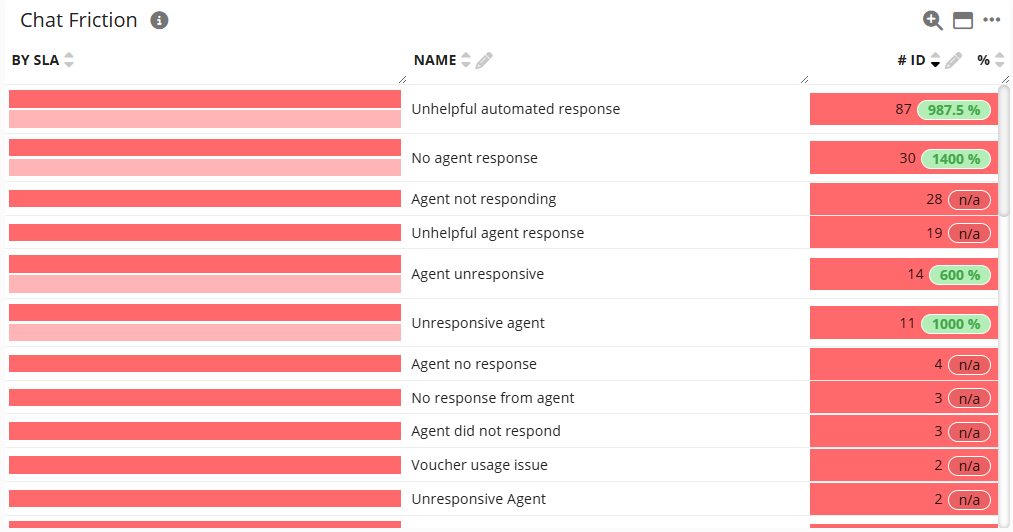
Categorize issues at scale
-
Identify recurring friction patterns
-
Alert the appropriate teams
-
Provide actionable operational insights
Bad Client Chat/Conversation detected in real-time by GermainUX (for a chat capability integrated with Siebel):
AI analysis of Chats at scale, to prioritize:
Conversation Details for an Indivudual User Session:

🏭 Adoption Analytics and Business Process Mining
GermainUX helps organizations understand how Siebel is actually used and where workflows reduce adoption or productivity.
It automatically identifies:
-
Inefficient or incomplete workflows
-
Process bottlenecks and delays
-
Excessive workflow complexity
-
Repeated or unnecessary actions
-
Productivity losses
-
Disproportionately affected groups
These insights help teams determine where training, UX improvements, process redesign or technical remediation will have the greatest effect.
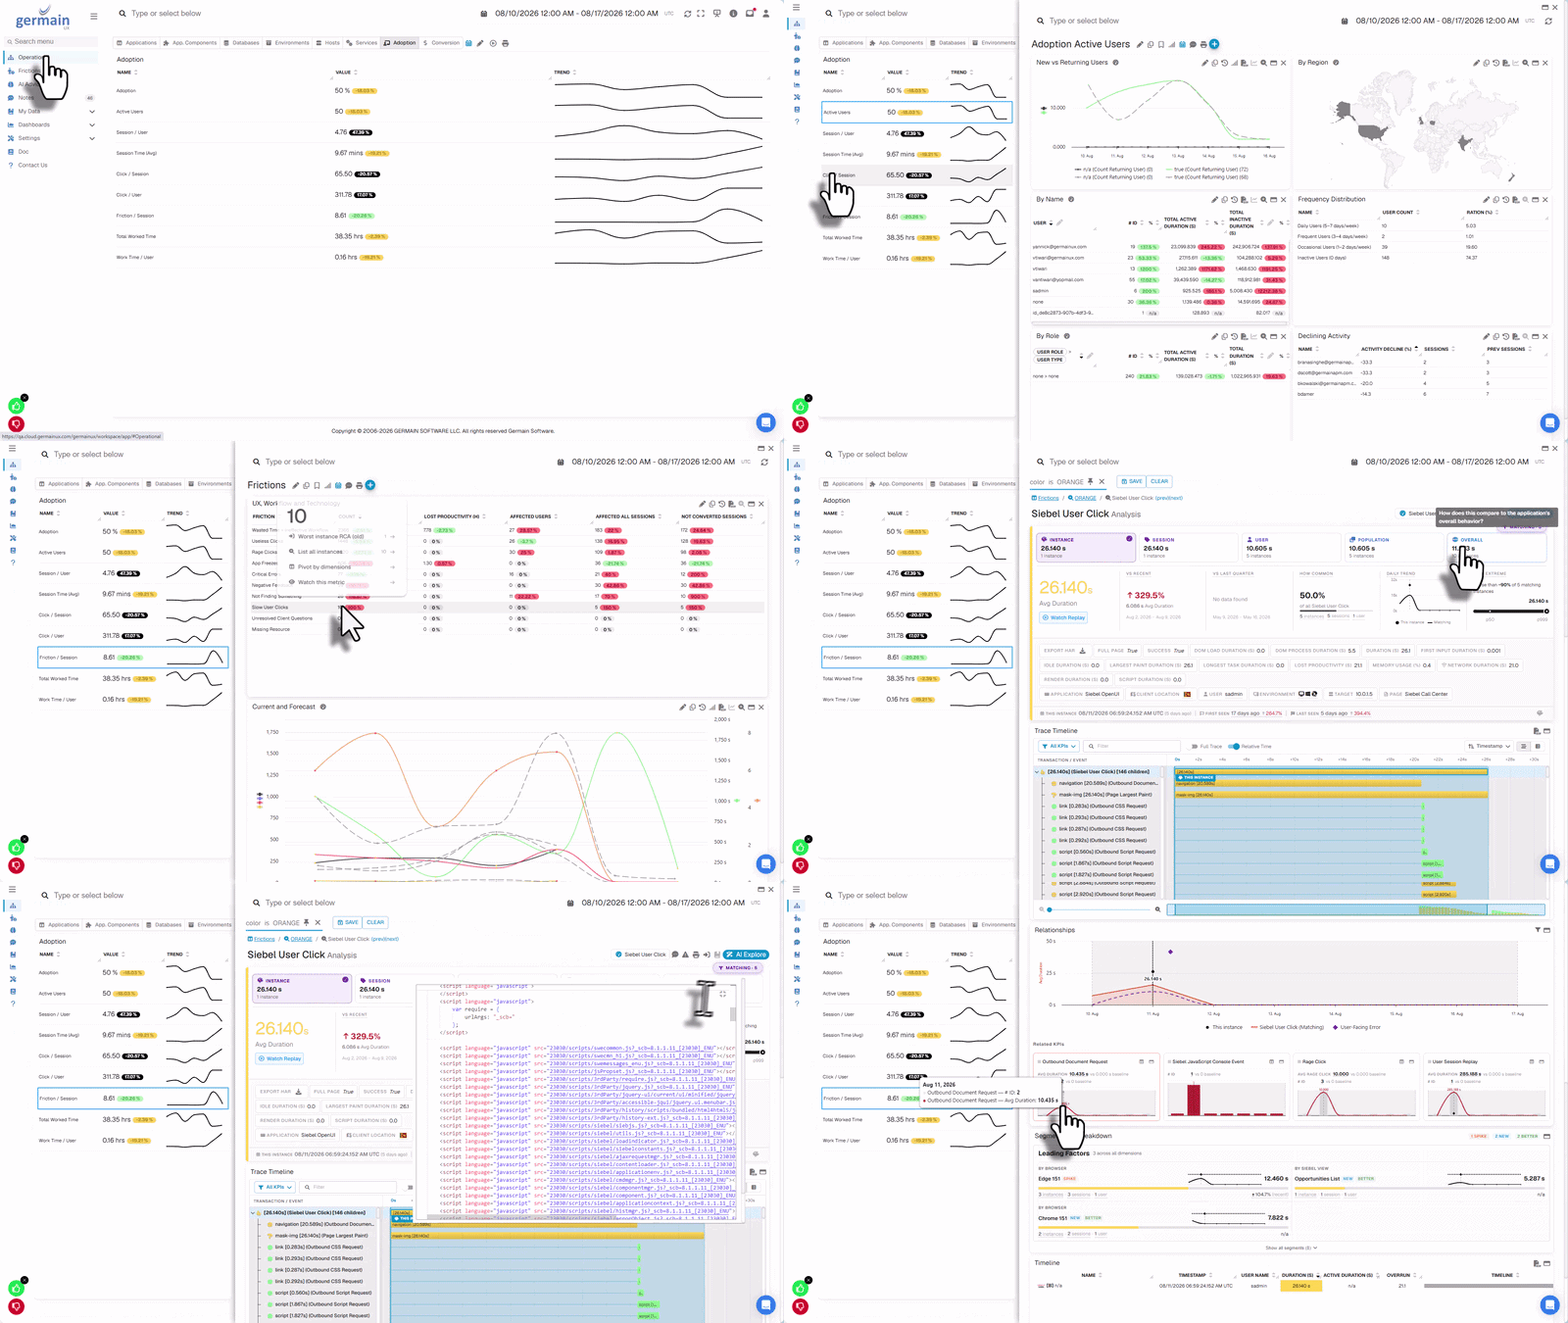
Adoption Analysis Example:
Business Process Mining Example:
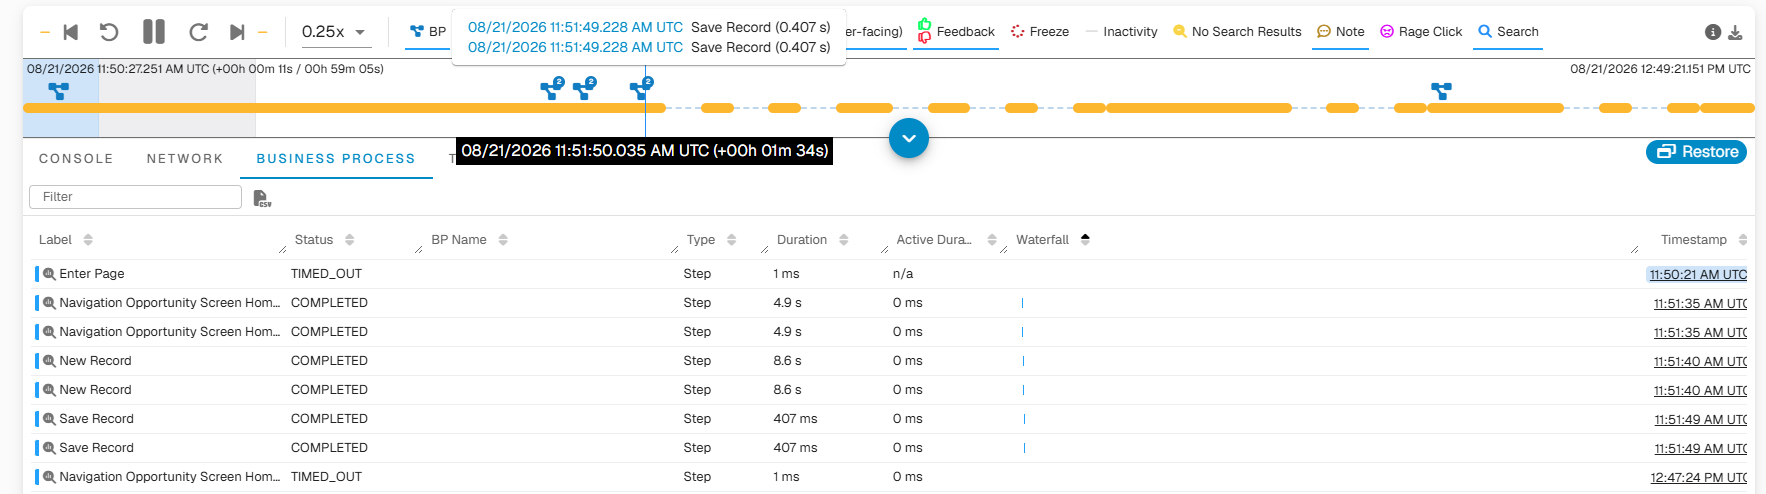
Learn more about Business Process and Workflow Monitoring.
⏱️ End-to-End Performance and Transaction Analysis
GermainUX correlates transactions across the browser, Siebel application, database and integrated systems. This enables teams to follow a user action or service transaction through every relevant layer and identify where time was spent or failure occurred.
🖱️ User Click Analysis
Every monitored user click can be broken down across:
-
Browser processing
-
Network activity
-
Siebel application processing
-
Database activity
-
Integrations and connected services
Analysis Dashboard for a Slow Siebel User Click:
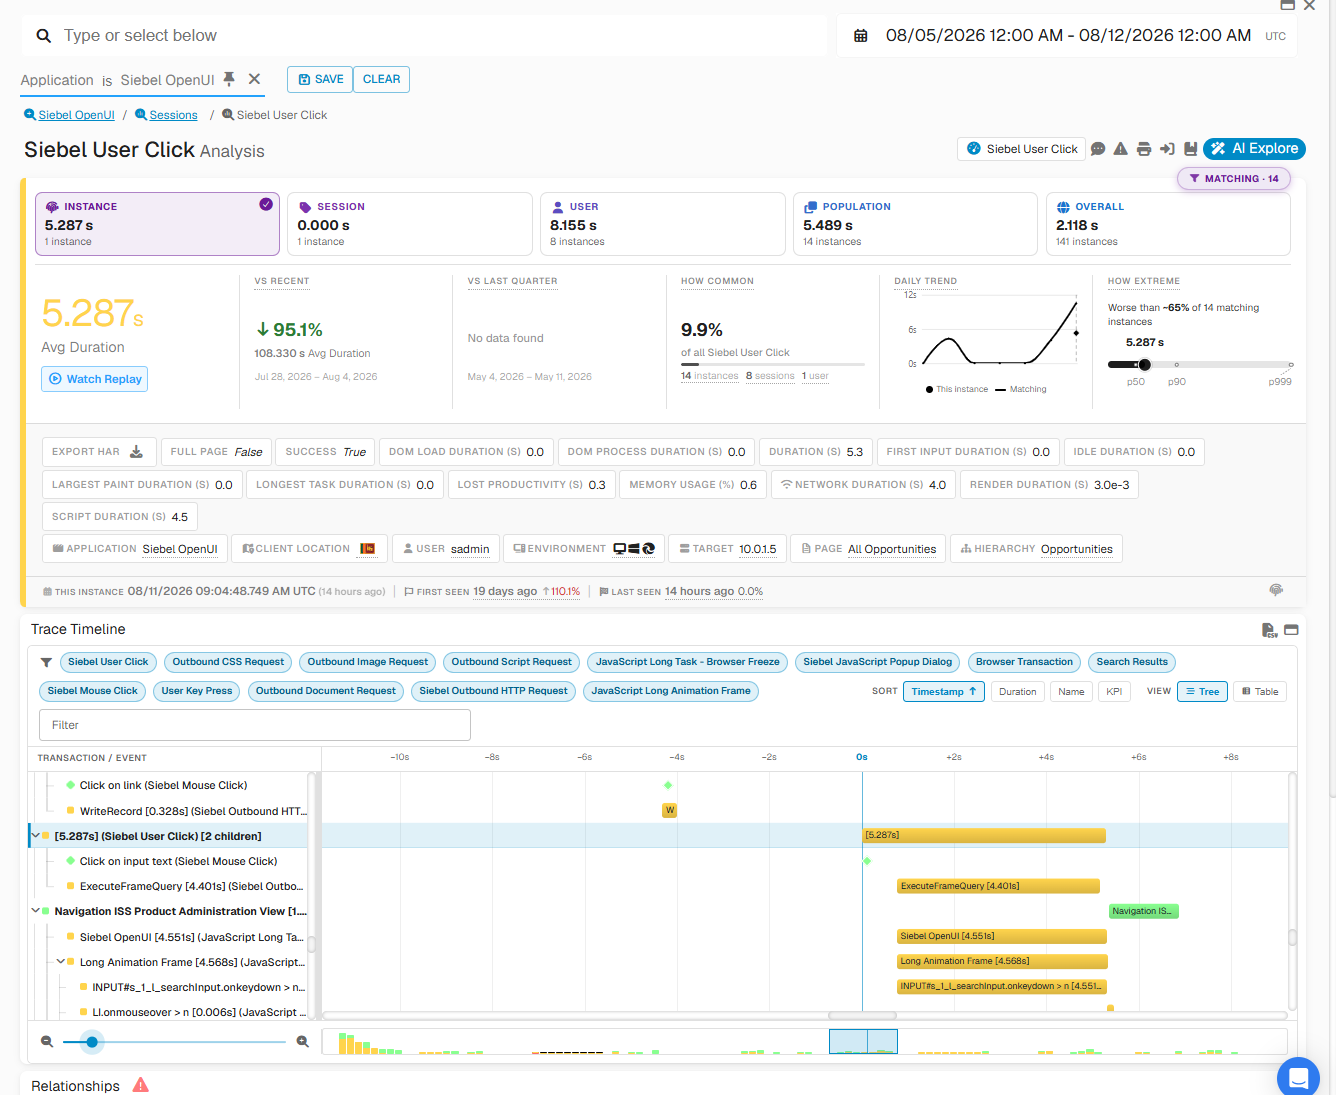
Standard browser timing analysis is available with GermainUX RUM JS. Advanced JavaScript and eScript analysis is available with the GermainUX RUM Extension. The depth of server-side analysis depends on the enabled Siebel logging and instrumentation.
🔁 Workflow, EAI and Web Service Transactions
GermainUX provides real-time timing and failure analysis for Siebel Workflow, EAI, web service and Object Manager transactions. When a transaction originates in the browser, the user’s activity can be correlated with the network, application, database and integration activity that followed.
🔧 eScript Profiling
GermainUX provides two levels of eScript performance analysis:
|
Profiling level |
Visibility |
|---|---|
|
Light profiling |
Function-level performance insights using GermainUX RUM JS |
|
Deep profiling |
Line-of-code-level analysis using the GermainUX JS Profiler |
This helps developers identify inefficient or problematic code contributing to poor Siebel performance.
🌿 Workspace Branch Identification
Siebel Workspace Branch names can be captured and exposed throughout GermainUX analysis dashboards, helping teams correlate issues with specific configuration or development changes.
💓 Application Health, Availability and Capacity
GermainUX combines real-time observability with synthetic monitoring to assess the availability, capacity and operational health of Oracle Siebel CRM.
Monitoring can cover:
-
Siebel Enterprise Servers
-
Object Managers and individual Siebel components
-
Task availability, health and capacity
-
Transaction throughput
-
Application availability and uptime
-
Performance degradation and bottlenecks
-
Infrastructure and resource capacity
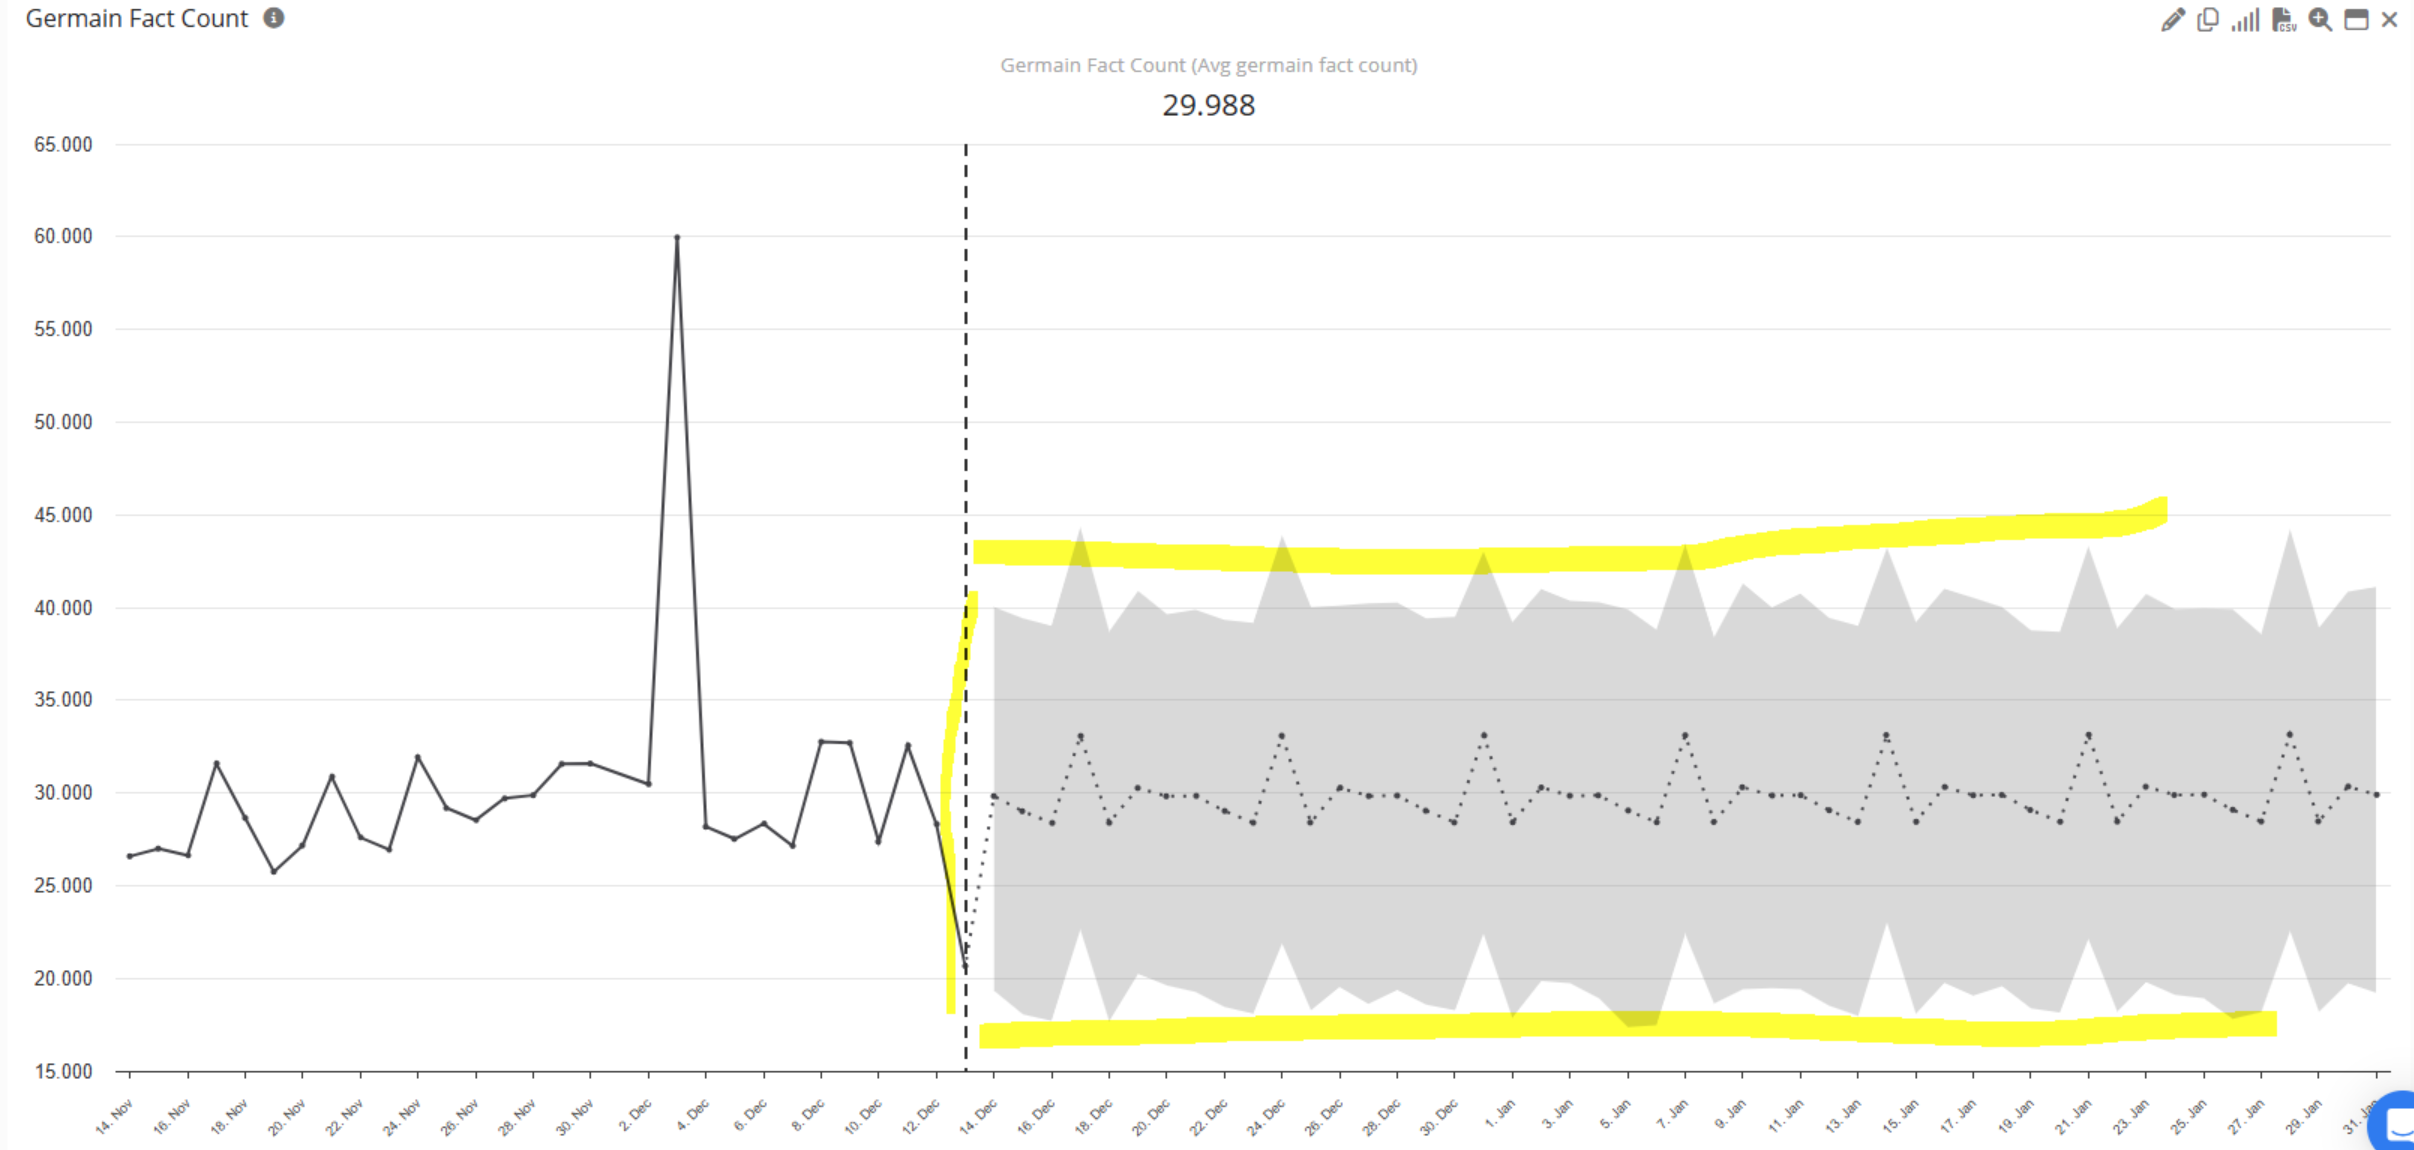
Teams can define SLA-based thresholds and alerts according to their operational requirements. GermainUX can also forecast any monitored preconfigured or custom KPI—for example, predicting disk-space usage over the next 12 months.
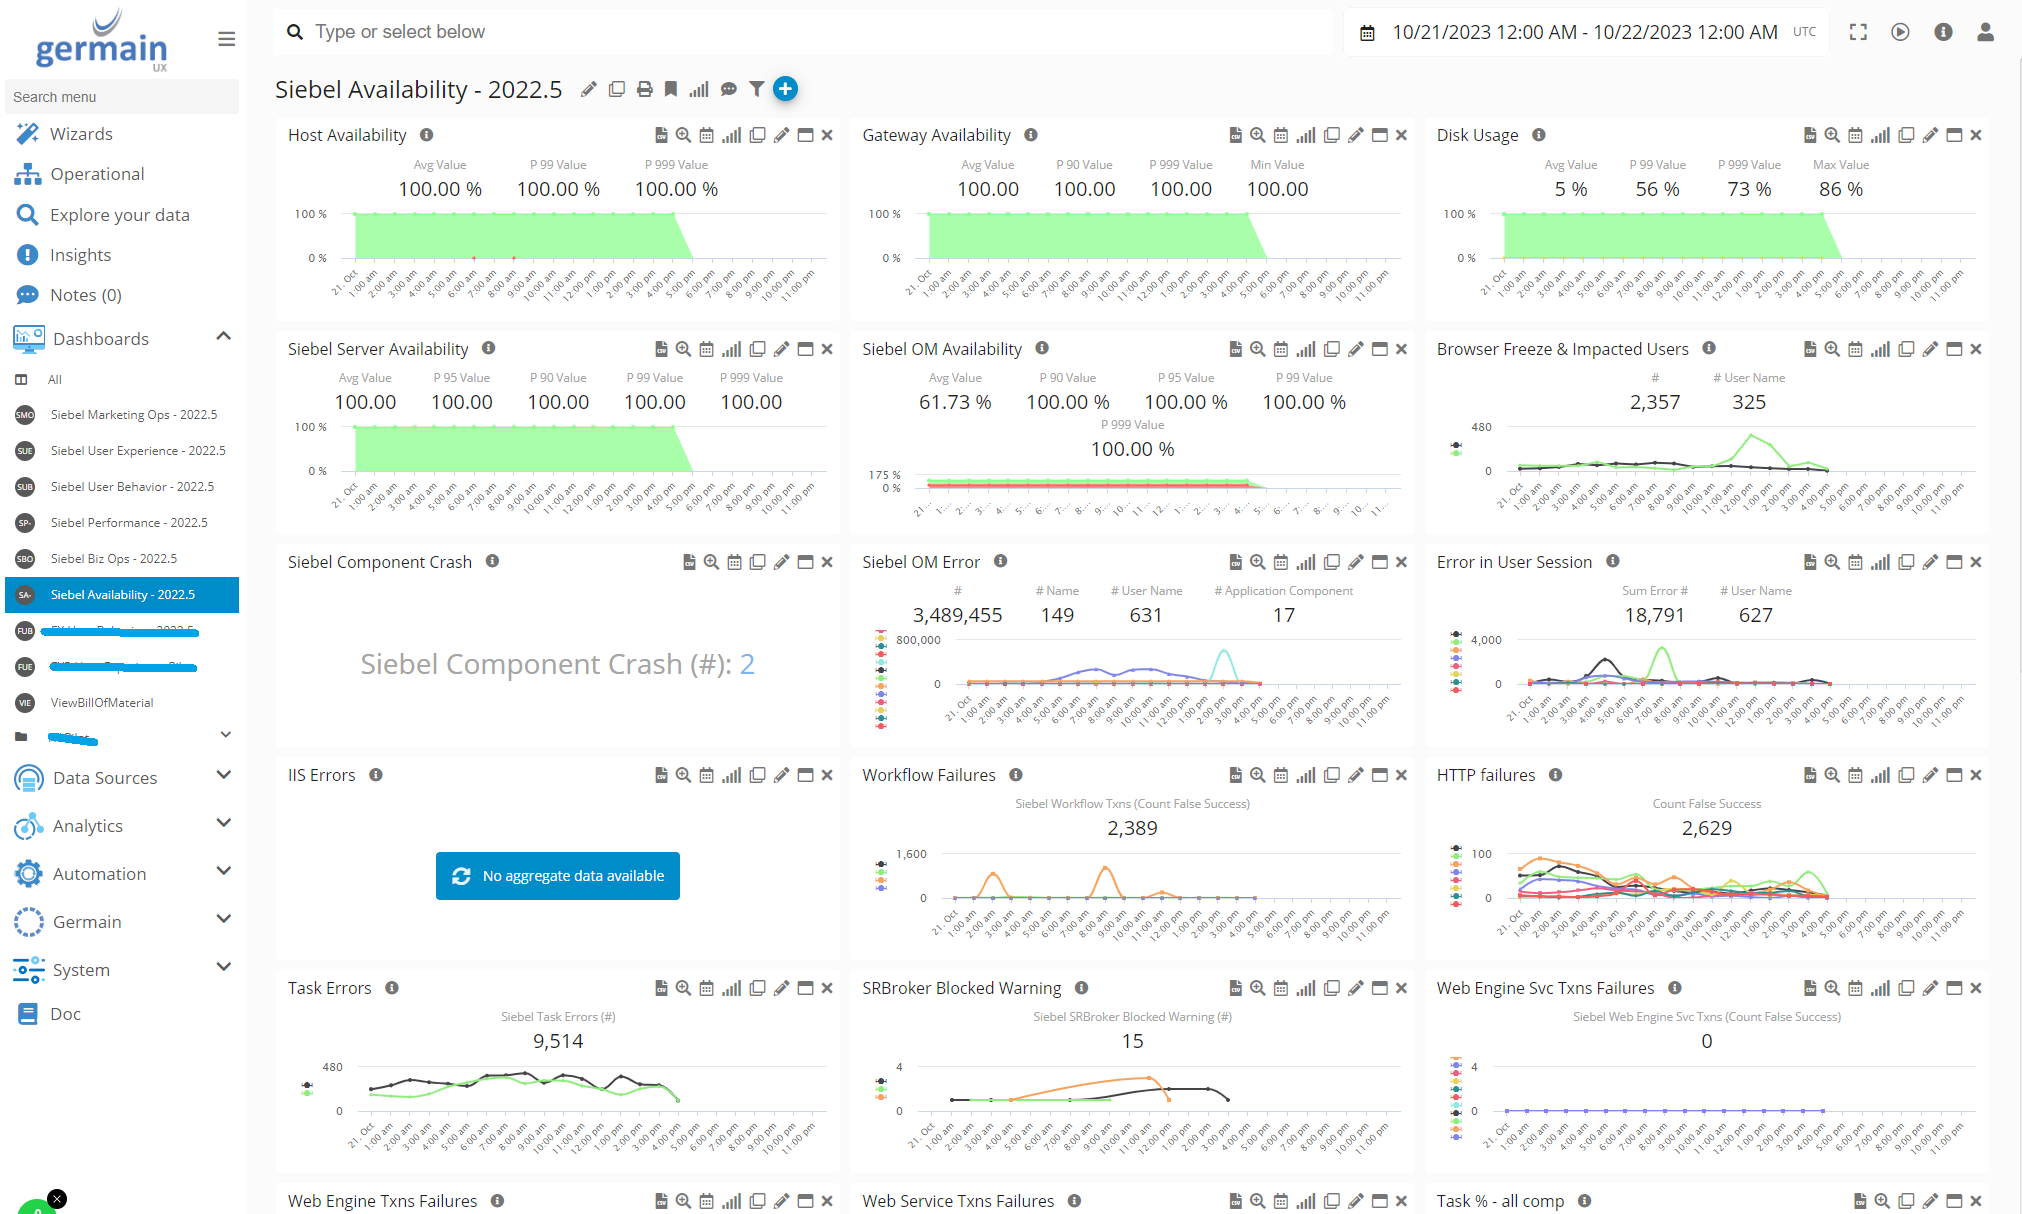
Siebel Availability & Capacity Dashboard Example (fully customizable):
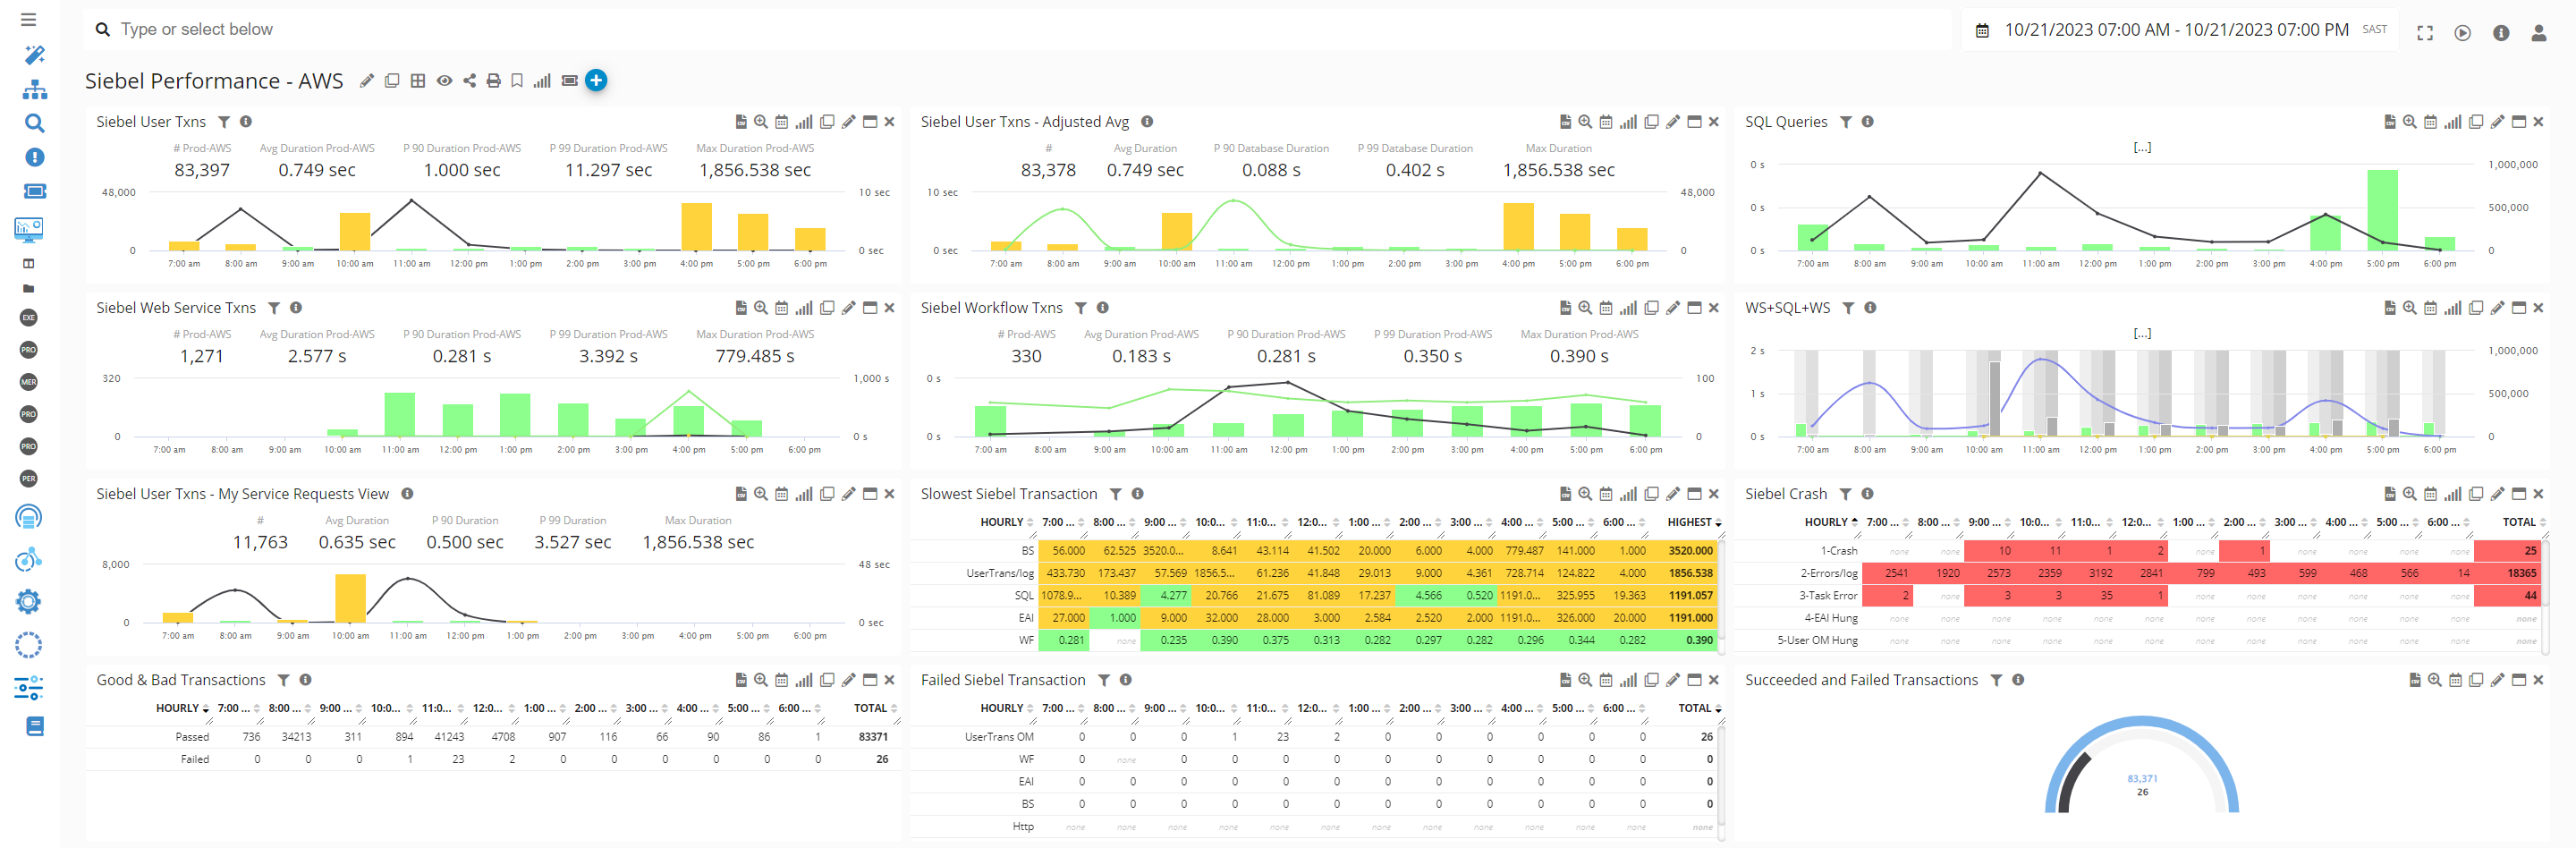
Siebel Performance Dashboard Example (fully customizable):
Forecasting available for any siebel KPI:
 Error, Crash and Log Analysis
🐛 Error Monitoring
GermainUX continuously monitors errors affecting Siebel users, workflows, integrations and infrastructure. Preconfigured Siebel-specific analysis helps teams distinguish:
|
Distinction |
Details |
|---|---|
|
New vs known errors |
New errors from known recurring errors |
|
User-facing vs backend |
User-facing errors from errors that occur only in backend systems |
|
Isolated vs widespread |
Isolated events from widespread or high-impact issues |
|
Technical failures vs validation |
Technical failures from user validation events |
Errors can be correlated with the affected user session, transaction, application component and supporting diagnostic data.
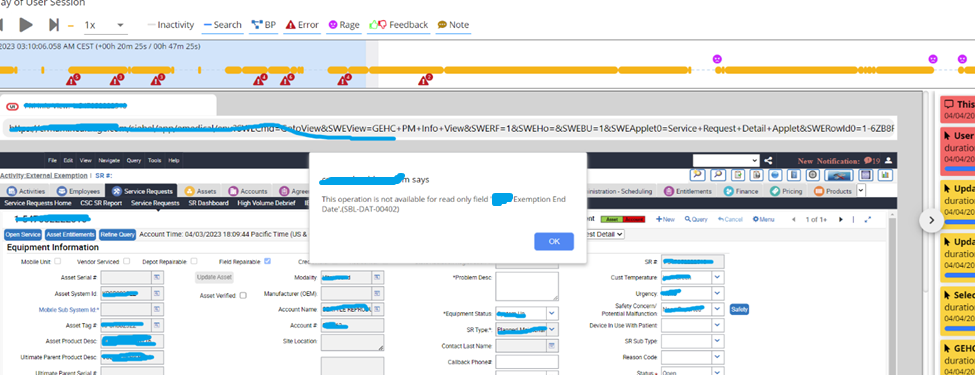
Learn more about new versus known errors and user-facing versus backend errors.
💥 Browser and Object Manager Crash Analysis
GermainUX can detect and analyze browser and Siebel object manager crashes in real time. Object Manager crash analysis can include:
|
Capability |
Details |
|---|---|
|
Automatic correlation |
Automatic correlation of crash-related evidence |
|
Log and file analysis |
Analysis of server and browser logs, FDR files, core files, transactions and exceptions |
|
AI-assisted FDR analysis |
AI-assisted identification of relevant FDR sections |
|
User scenario identification |
Identification of the user scenario associated with the crash |
|
Classification |
Classification of new versus recurring crashes |
Learn more about Exact-Match Correlation and Data Categorization.
📃 Log File Monitoring
GermainUX can monitor virtually any Siebel-related log or diagnostic file, including:
-
Object Manager logs
-
FDR files
-
Core dumps
-
Custom application logs
Learn more about log-file monitoring.
🗄️ Database Monitoring
GermainUX provides two complementary forms of visibility into the Siebel data layer:
-
Real User Monitoring, which captures data interactions and issues as experienced by users.
-
Direct database monitoring, which provides database-specific availability, performance, SQL and storage insights.
Supported technologies include DB2 UDB, Informix, Microsoft SQL Server, MySQL, Oracle Database and OBIEE. Capabilities depend on the database technology and deployed monitoring components.
SQL Captured from Siebel Logs or Database:
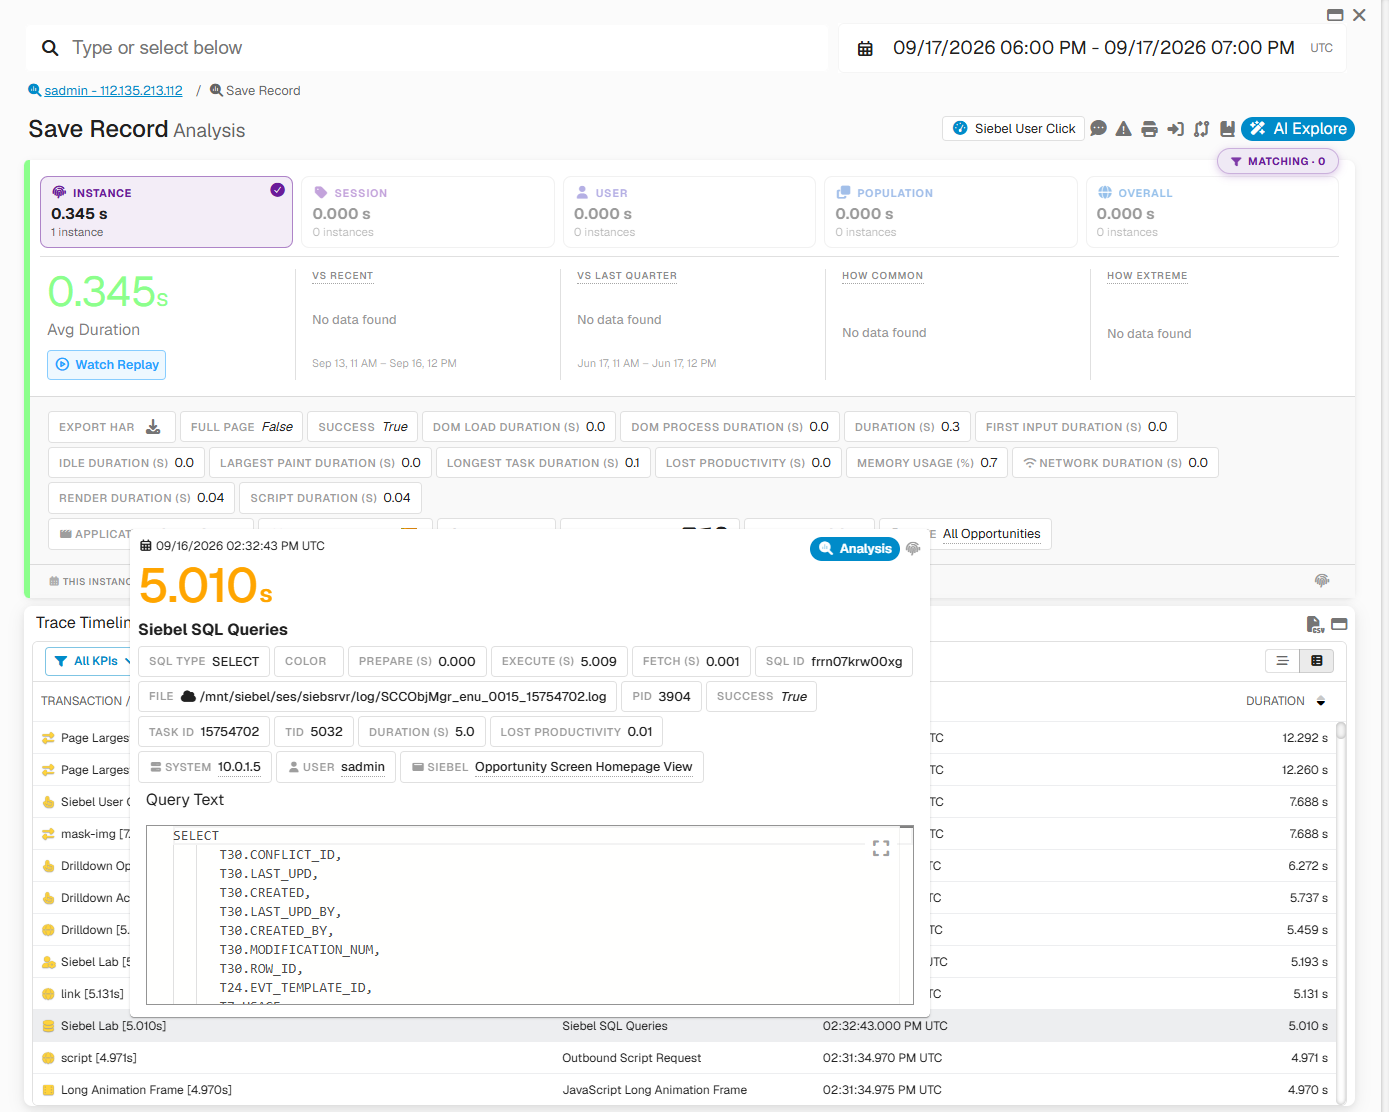
Documentation is available for DB2 UDB, Microsoft SQL Server, MySQL, Oracle Database and OBIEE.
🧠 AI-Assisted Analysis
AI Explore allows teams to ask natural-language questions about UX, adoption, productivity, workflow and technology issues. It is available across preconfigured and custom KPIs and can analyze relationships across multiple KPIs.
GermainUX also assists teams by:
|
Capability |
Details |
|---|---|
|
Detecting anomalies |
Detecting anomalies and outliers |
|
Identifying friction |
Identifying friction across behavior, workflows and technology |
|
Summarizing sessions |
Summarizing individual or multiple user sessions |
|
Categorizing |
Categorizing errors, crashes and conversations |
|
Recommendations |
Recommending areas for further investigation or corrective action |
AI-generated findings should support—not replace—appropriate operational and technical review.
🔔 Alerts, Proactive Detection and Automated Remediation
GermainUX can turn monitoring and analysis into action through:
|
Automation |
Purpose |
|---|---|
|
Real-time alerts |
Notify the appropriate teams when an issue or SLA violation occurs |
|
Synthetic monitoring |
Execute user scenarios proactively to detect issues before they affect real users |
|
Anomaly detection |
Identify unusual behavior, spikes, drops and outliers |
|
Guided investigation |
Provide direct access to relevant analysis, evidence and AI Explore |
|
Automated remediation |
Execute approved recovery workflows when automation is considered safe |
Examples of remediation include restarting failed services or components under defined and controlled conditions.
Learn more about GermainUX automation.
🔒 Audit Trail, Security and Privacy
GermainUX Audit Trail capabilities can monitor Siebel configuration files and metadata, helping organizations detect changes and maintain compliance visibility.
Security and privacy controls help restrict access to sensitive Siebel data and support requirements such as GDPR. Depending on the deployment, sensitive information can be masked, anonymized or excluded from collection.
|
Resource |
Link |
|---|---|
|
Audit Trail documentation |
|
|
Data Privacy and Security documentation |
📑 Supported Siebel Versions
GermainUX supports Siebel CRM 7.x, 8.x and later releases, including current annual releases. The precise capabilities available depend on the Siebel version, user interface, architecture, logging configuration and GermainUX components deployed.
Deployment and configuration
|
For your Oracle Siebel CRM environment |
|---|
|
Deployment Overview of GermainUX’s Oracle Siebel CRM Monitoring and Automation |
|
KPIs for Oracle Siebel CRM Monitoring |
|
Other Analytics Features |
|
Other Automation Features |
Component requirements and feature availability depend on the desired monitoring depth and the architecture of the Siebel environment.
ℹ️ Get Help
The Germain Team can help you set this up. Contact GermainUX Support.
Component: Engine, JS Profiler, Mobile App, RPA Bot Recorder, RUM JS
Feature Availability: 2014.1 or later