Features
Germain monitors the uptime and performance of Solaris servers. To access this information, Germain UX utilizes either Germain UX Engines or Germain UX Agents, which establish SSH connections to the monitored Solaris systems at regular intervals and execute a set of predefined commands. By collecting data such as CPU usage, memory usage, disk utilization, network statistics, and other system metrics, Germain UX provides insights into the performance and availability of Solaris servers. This monitoring capability helps identify potential issues, optimize resource utilization, and ensure the smooth operation of Solaris-based environments.
|
Command |
|---|
|
/usr/sbin/prtconf |
|
/usr/bin/vmstat 1 4 |
|
vmstat 1 4 |
|
vmstat 1 4 |
|
df -lk |
|
iostat –d –x |
|
/bin/netstat -i -f inet |
|
kstat -p '::phys:*bytes64' 1 2 |
|
kstat -p unix:0:system_misc:boot_time |
|
ps –A |
Each of these commands can be individually configured and also disabled, if for some reason it is undesirable to collect any one of the OS metrics.
Configuration
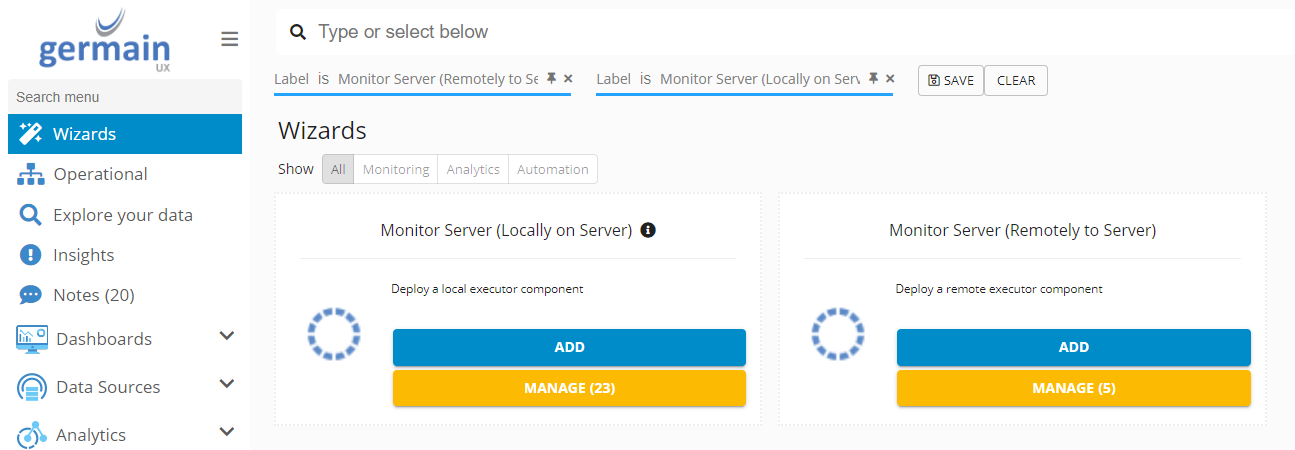
1. Log on to Germain Workspace > left menu > Wizards > Monitor Server(Local or Remote)
2. Add
Local Server Monitoring
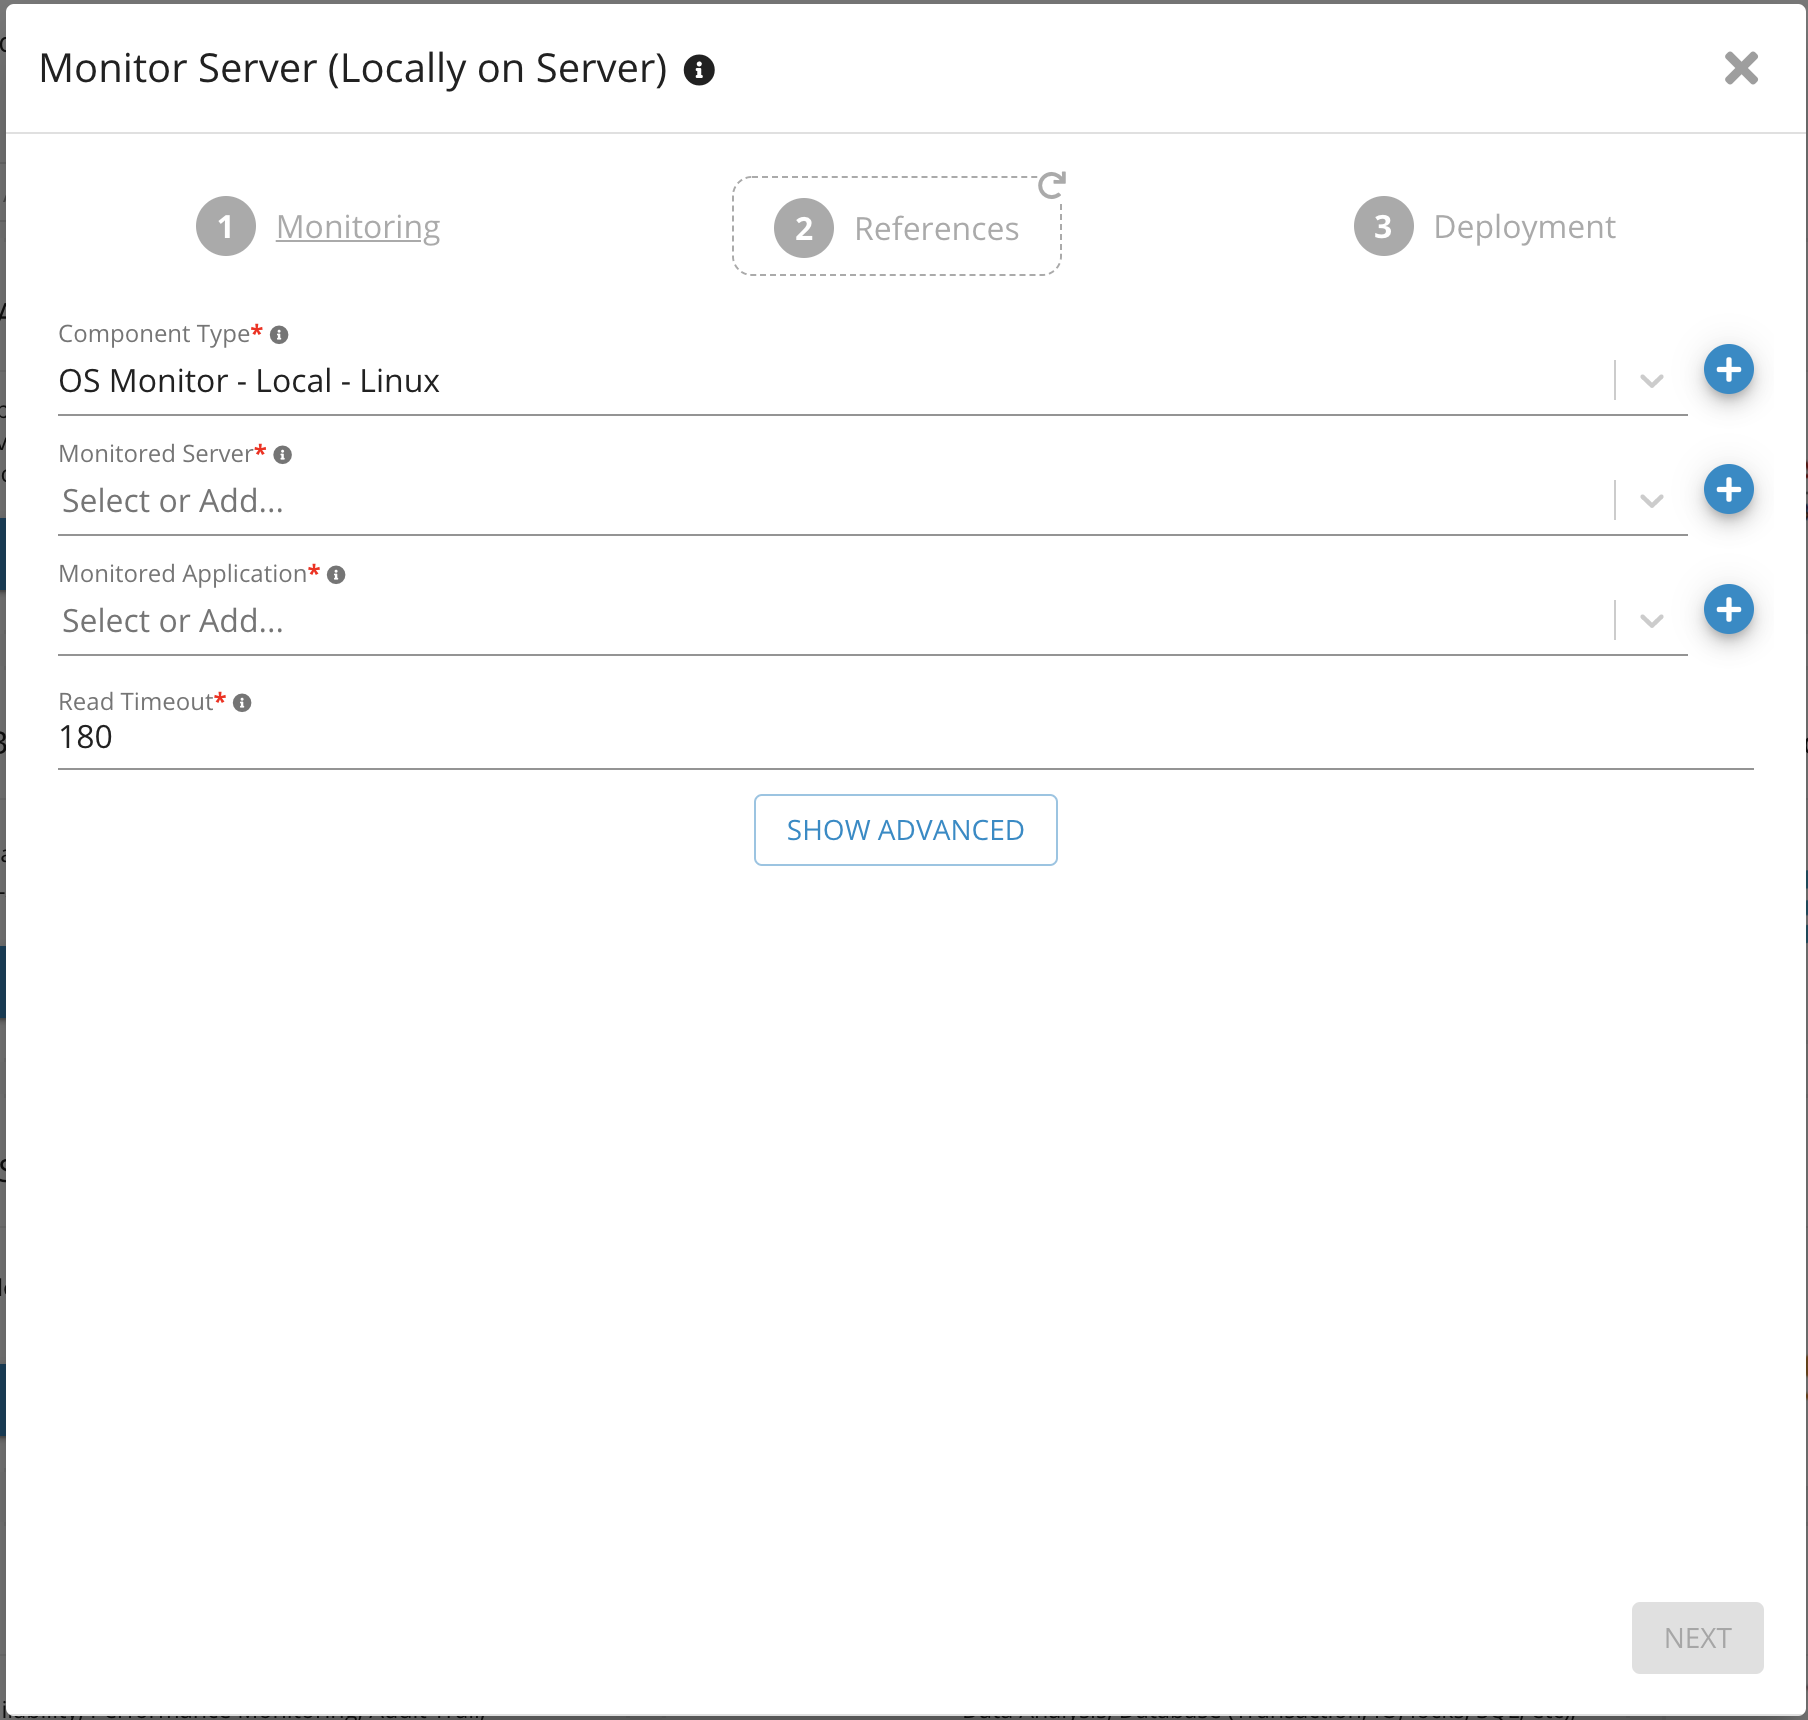
4. Select 'OS Monitor - Local - Linux' as Component Type
5. Choose a server(in this case we will choose our local server) from the dropdown list
6. Choose Operating System for Monitored Application
7. Click Next
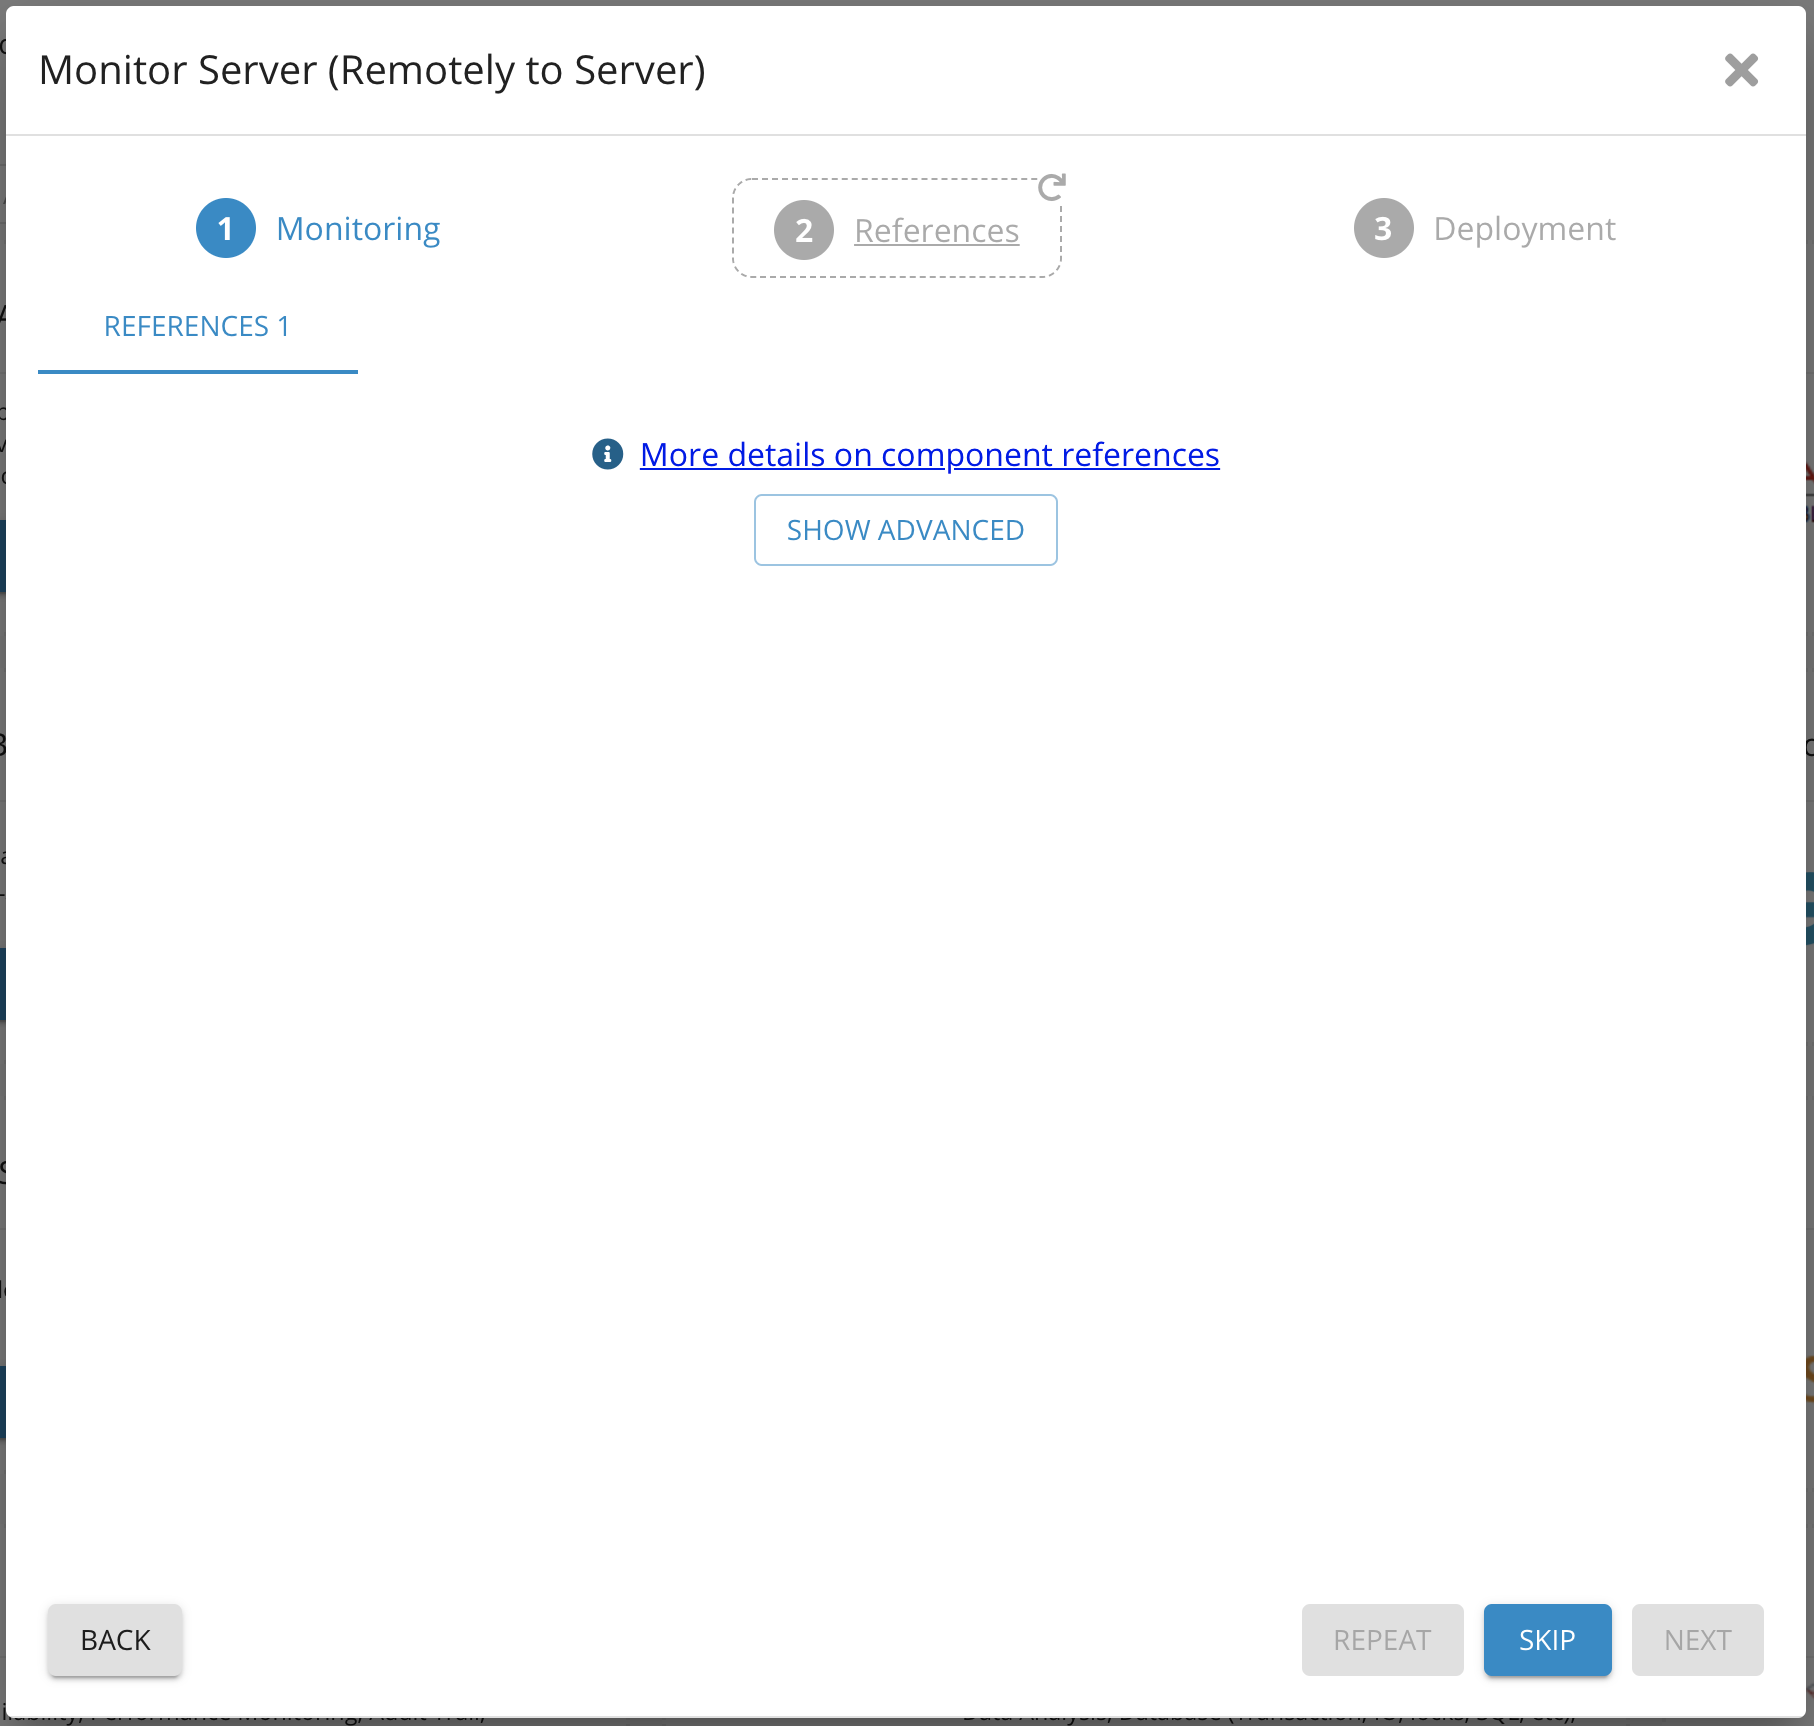
8. Click Skip

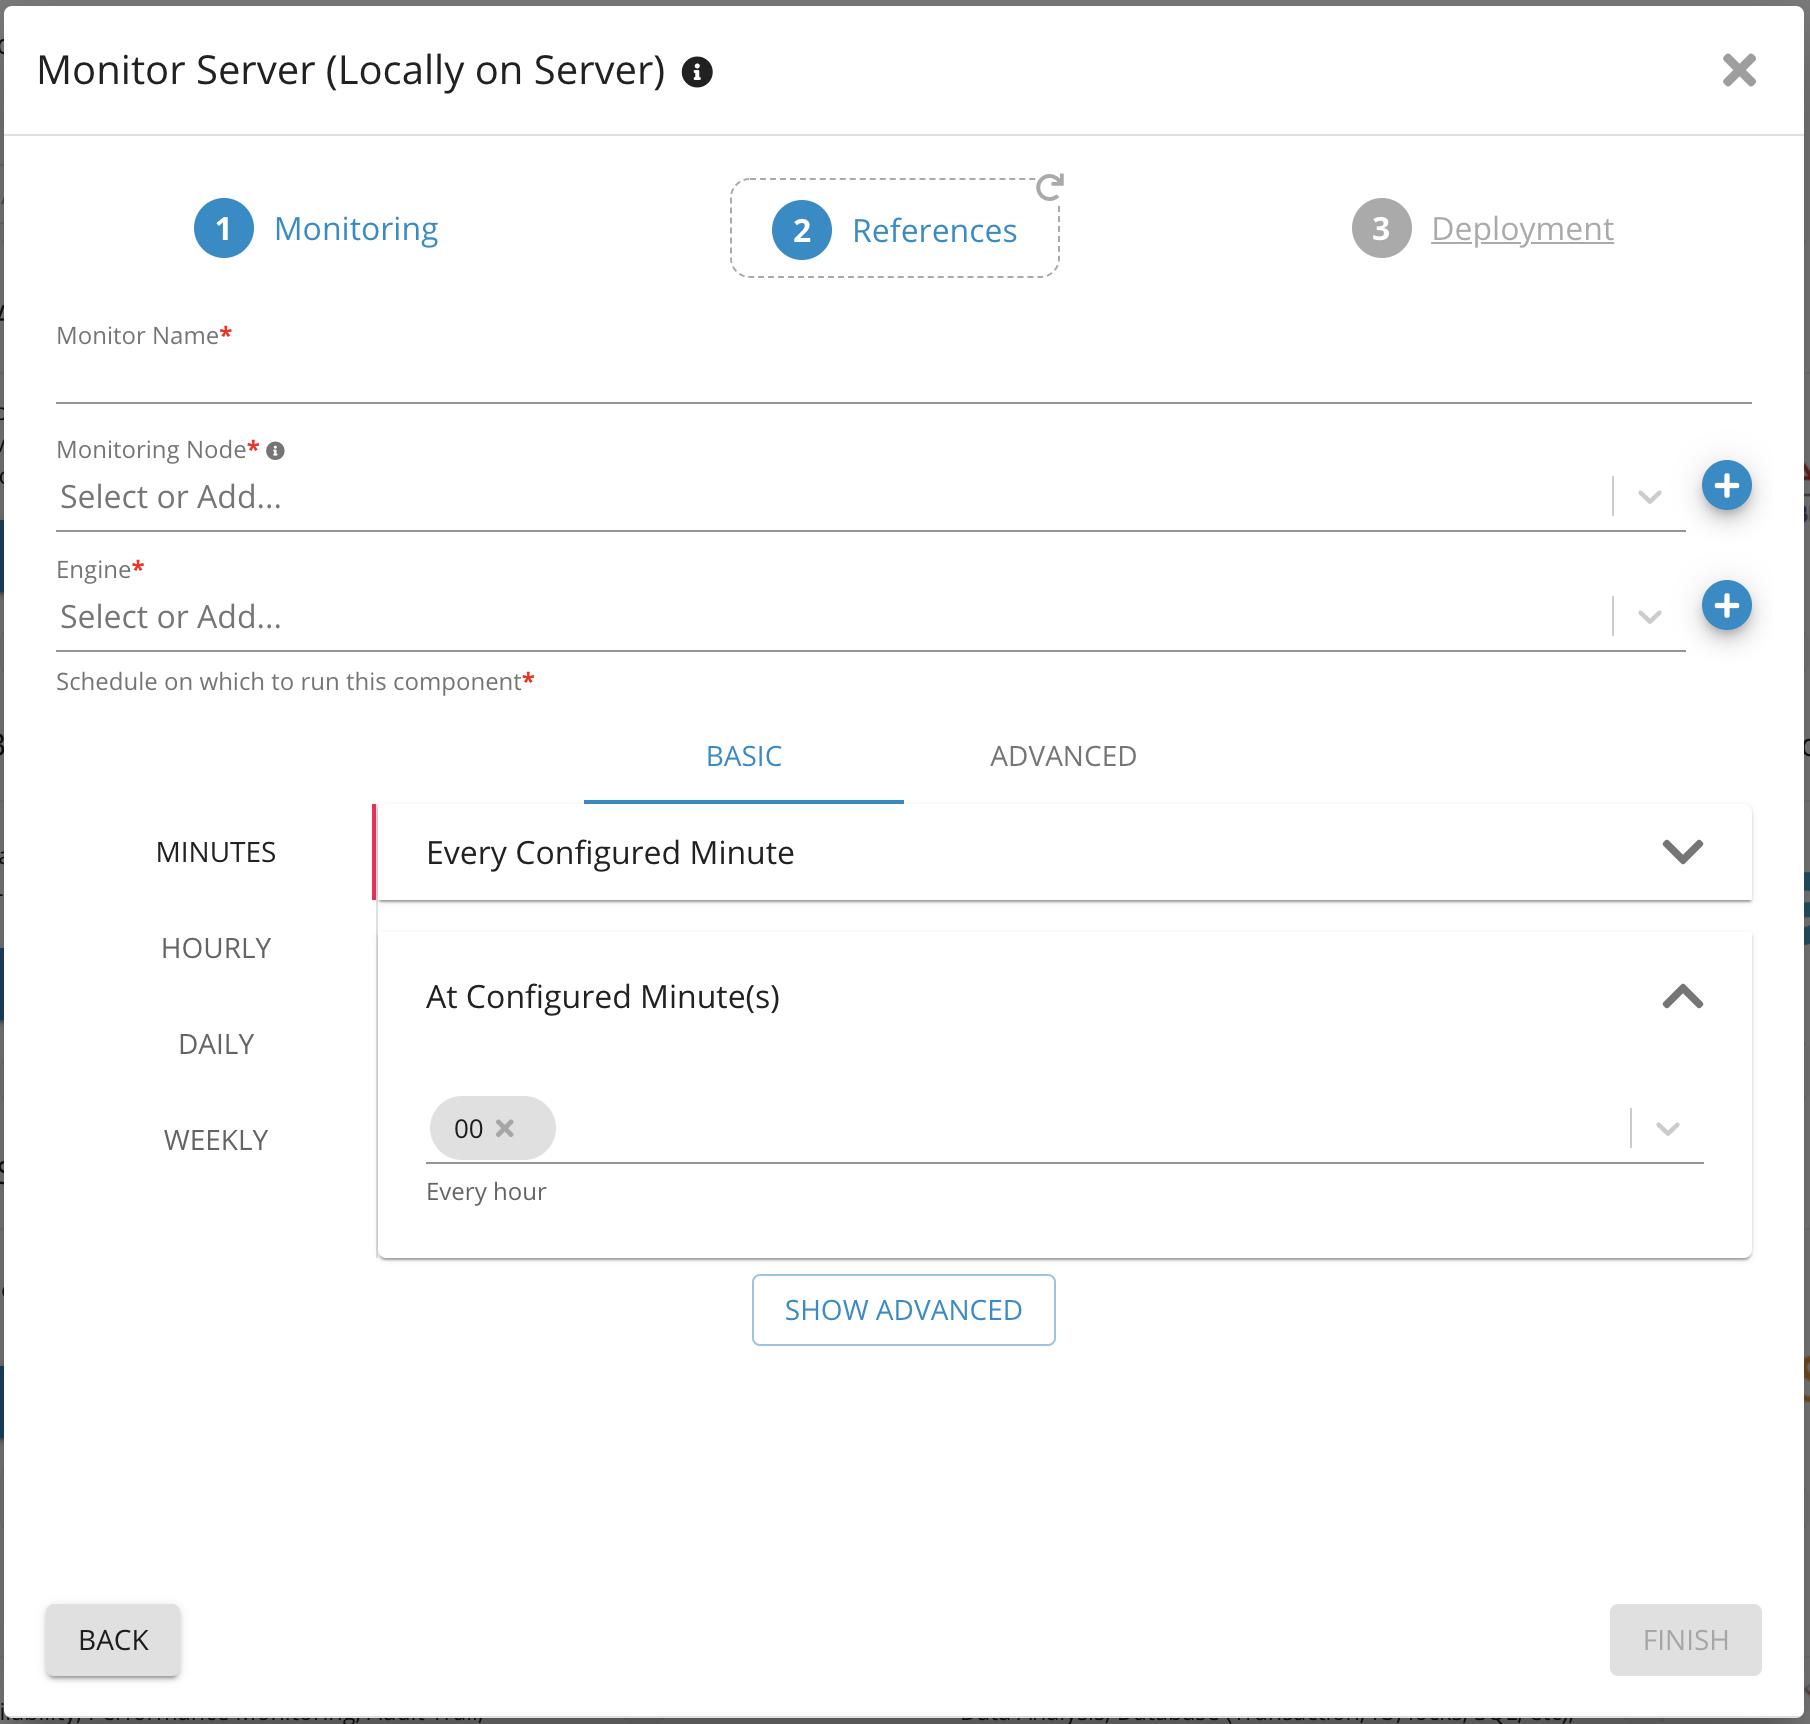
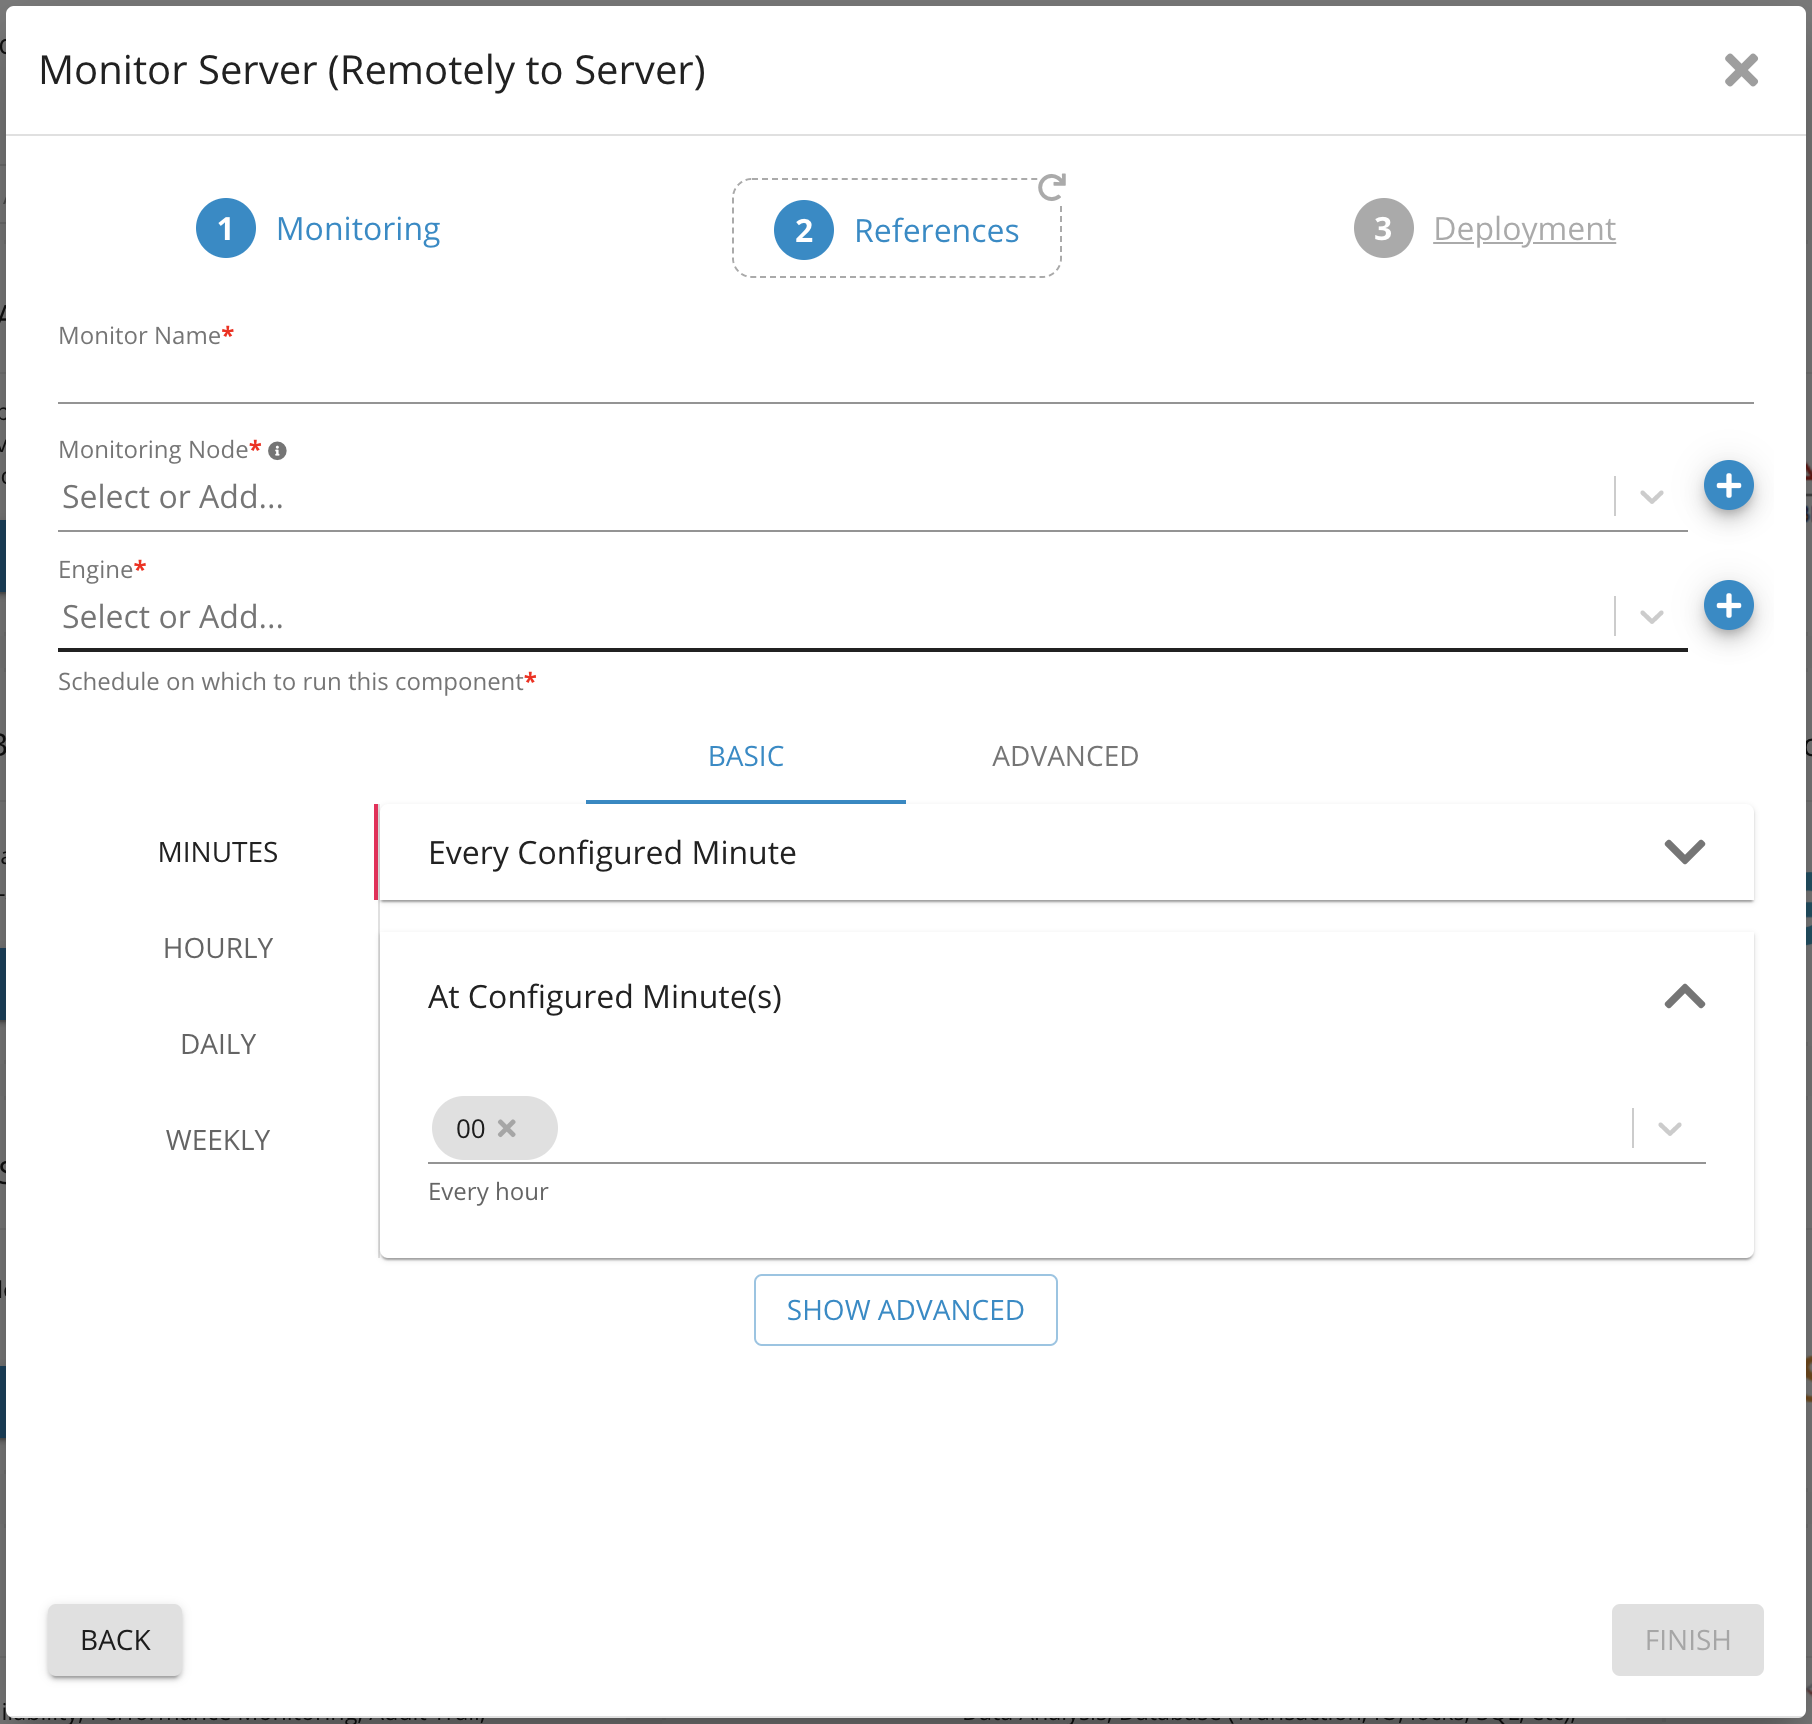
9. Provide a name for this component
10. Select the local node and the engine this component will run on
11. Set a schedule for how frequently this component will run
12. Click Finish
Remote Server Monitoring
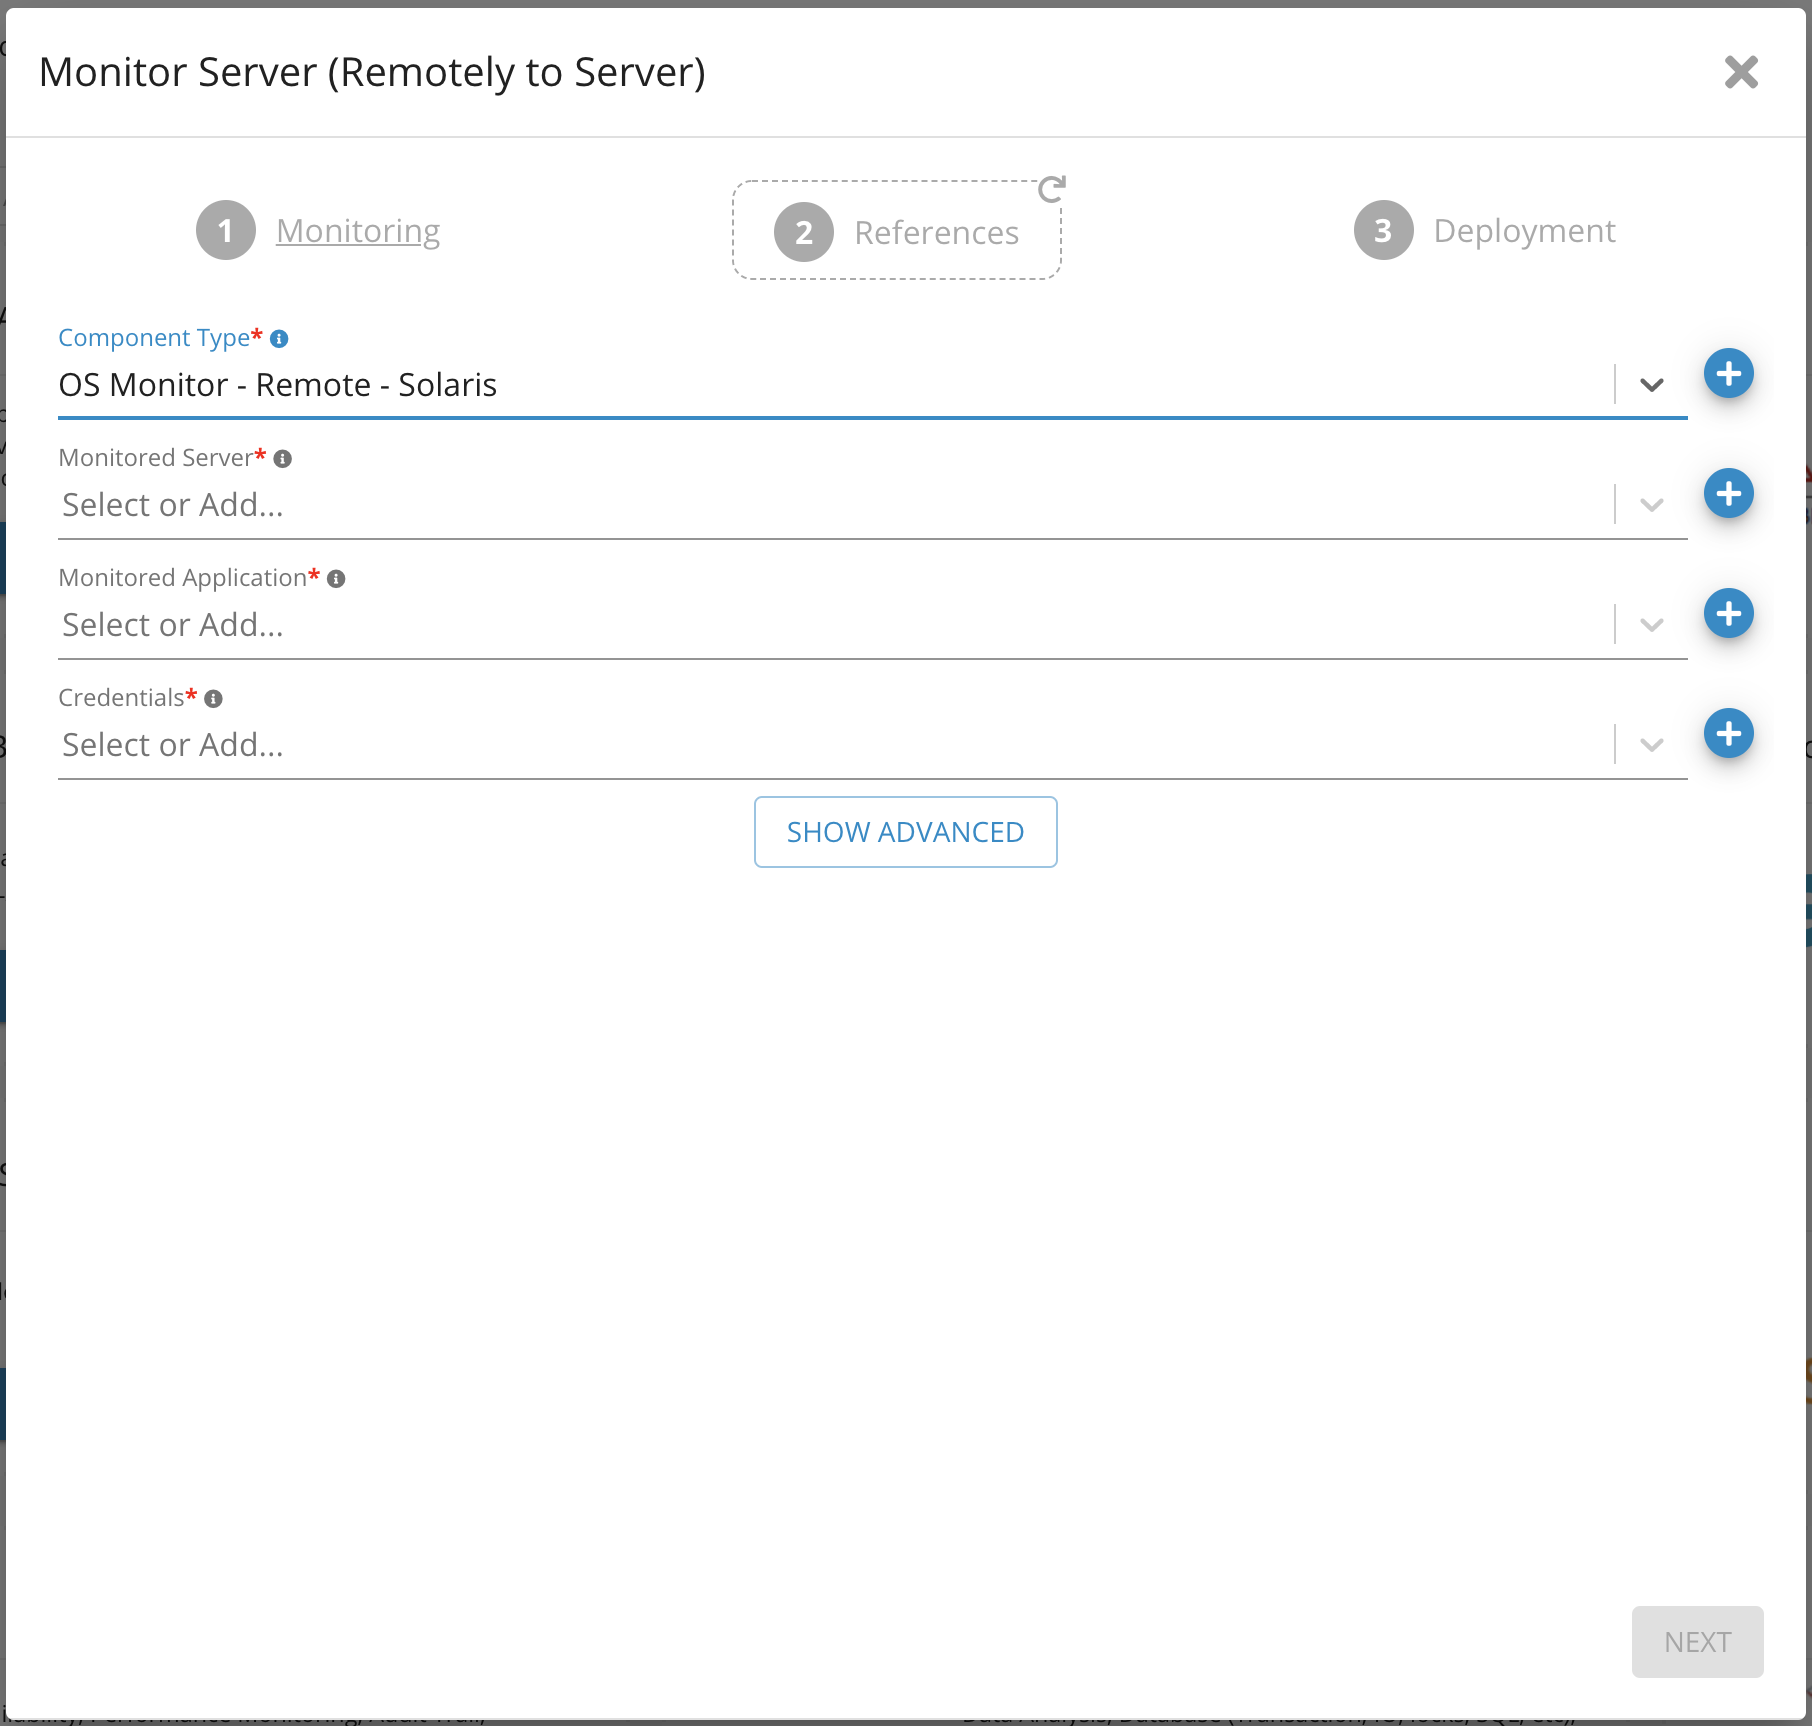
4. Select 'OS Monitor - Remote - Solaris' as Component Type
5. Choose a server(in this case we will choose our target remote server) from the dropdown list
6. Choose Operating System for Monitored Application
7. Provide credentials for SSH connection to remote server
8. Click Next
9. Click Skip
10. Provide a name for this component
11. Select the remote node and the engine this component will run on
12. Set a schedule for how frequently this component will run
13. Click Finish
Display OS data in portlet
Data from OS Monitor can be viewed by using the following KPIs
-
Memory Usage
-
Memory Cache Faults
-
CPU Usage
-
CPU Queue Length
-
Disk Usage
-
Disk Queue Length
-
Disk I/O
-
Network Queue Length
-
Network Bandwidth
-
Network Bandwidth Usage
-
Network Latency
-
OS Process
-
Process Count
Component: Engine
Feature Availability: 8.6.0 or later