Real-time Uptime, Performance and User Experience Monitoring and Insights of JavaScript Application by Germain UX.
Germain is designed to monitor the uptime, performance, and usage of JavaScript applications. With Germain, you can gain valuable insights into the availability, responsiveness, and overall performance of your JavaScript applications. Additionally, Germain offers a variety of automation features, enabling you to proactively detect and automatically resolve issues.
Real-time Monitoring and Insights for JavaScript
Key monitoring capabilities and automated insights in Germain UX for JavaScript applications, including:
Real User Monitoring & Session Replay
Monitors Real User Experience to gather data from actual users of your JavaScript application. Monitors and records videos of user sessions, user actions, clicks, form submissions, page navigation and performance metrics to gain insights into real-world usage patterns and identify areas for improvement. Captures user behavior data to gain insights into how users interact with the application and identify areas for improvement. More details on User Session Monitoring, Replay & 6 Heatmaps .
Synthetic Transactions
Germain allows you to set up synthetic transactions to simulate user interactions or application-level actions within your JavaScript application. These synthetic transactions can be configured to monitor specific functionalities, user journeys, or critical workflows. By regularly executing these synthetic transactions, Germain can proactively monitor the uptime and performance of your JavaScript application and alert you in case of any issues or deviations from expected behavior.
Uptime and Performance of JavaScript Application
Cross-Browser Compatibility
Monitors the JavaScript application across different web browsers and versions to ensure consistent behavior and compatibility. Monitors any browser-specific errors or issues that may arise.
Errors and Exceptions
Monitors and track JavaScript errors and exceptions that occur during runtime. Identifies the type of errors, their frequency, and the affected parts of the code. This helps in troubleshooting and resolving issues quickly.
Network Requests
Monitors AJAX requests, HTTP requests, and WebSocket connections made by the JavaScript application. Tracks response times, status codes, and data transfer sizes. This helps identify performance issues and potential bottlenecks in network communication.
Performance
Monitors the performance of your JavaScript code to ensure optimal execution and responsiveness. Tracks metrics such as execution time, memory usage, and CPU utilization.
Resource Usage
Monitors the usage of browser resources, such as DOM elements, memory, and CPU, by the JavaScript application. Identifies memory leaks, excessive DOM manipulation, or high CPU usage that could impact performance and user experience.
Mobile Compatibility
If your JavaScript application targets mobile devices, monitors its performance and compatibility on various mobile platforms and screen sizes.
Third-Party Dependencies
Monitors the performance and reliability of third-party libraries and APIs used in your JavaScript application. Tracks their response times, error rates, and impact on overall application performance.
Real-time Analysis of JavaScript Code
Germain offers 2 options to analyse Javascript code in real-time to understand performance at a high-level or to troubleshoot and get ideas of what part of your javascript application to optimize.
Standard Real-time JavaScript Monitoring
By default, Germain is configured to provide light analysis of JavaScript Code Execution via Germain UX RUM JS or Germain UX RUM Extension.
Example of User Click Analysis that includes Light JS Execution or other Backend Transaction Analysis (real-time)
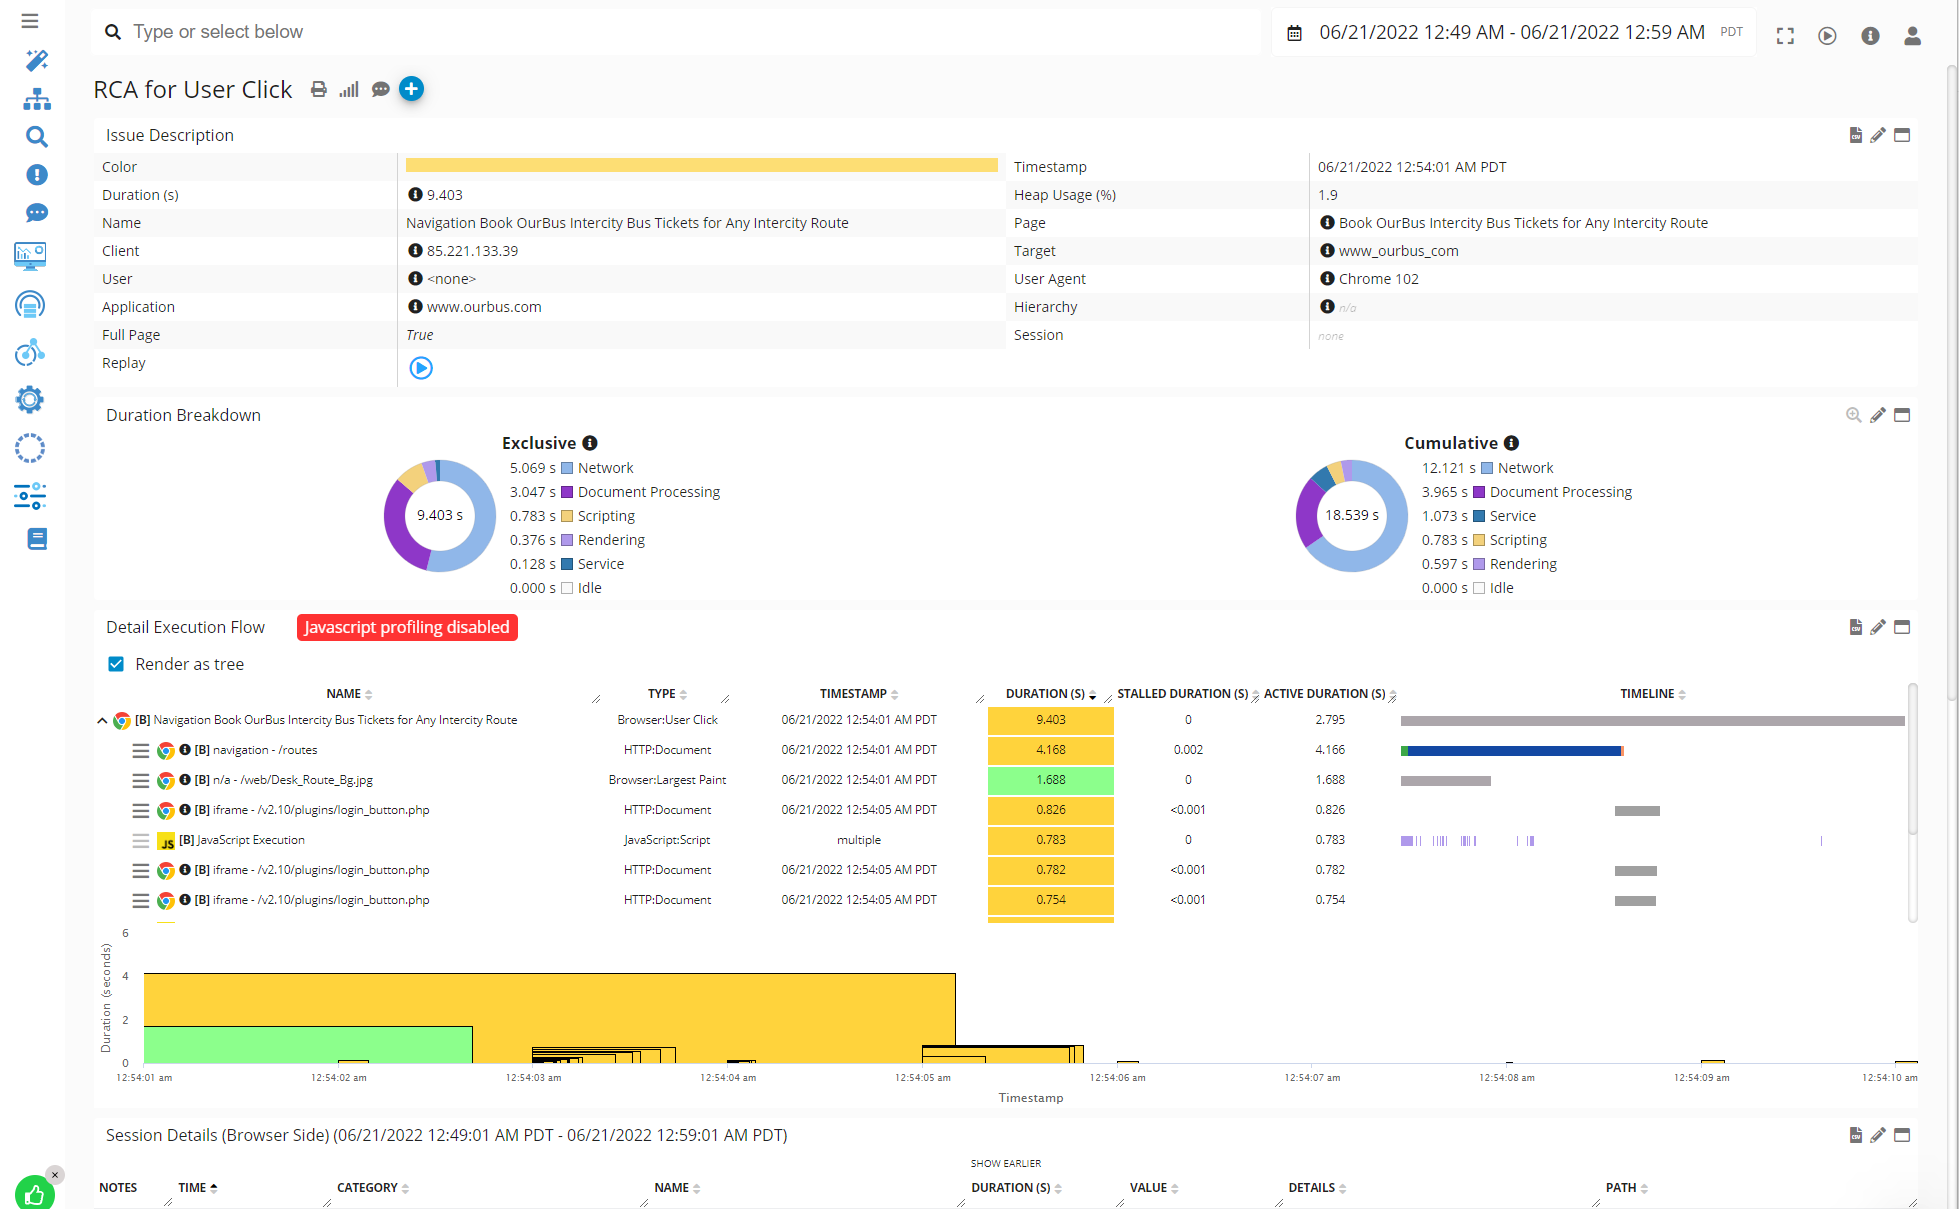
More details about the preconfigured KPIs.
Deep Real-time JavaScript Monitoring
Advanced analysis of JavaScript Code Execution can be performed with Germain UX JS Profiler browser extension.
Real-time performance monitoring and analysis of JavaScript application, down to the line of JS code can be performed by Germain UX, 24x7, in real-time.
Metrics provided:
-
JavaScript method execution time
-
JavaScript line (of code) execution time
-
Stall duration
-
Download duration
-
Wait duration
-
etc
That above feature can be used in conjunction with other Germain’s tracing features to automate end-to-end transaction analysis of User Click or other Transaction (browser>java script>network request>web request>application code>database sql,...levels and any integration layers). More details about .
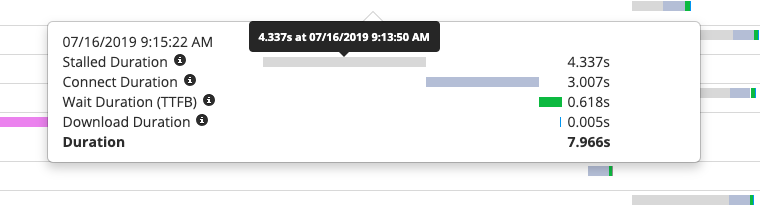
Example of a Javascript Line-by-line Time Breakdown Analysis performed in real-time by Germain UX:
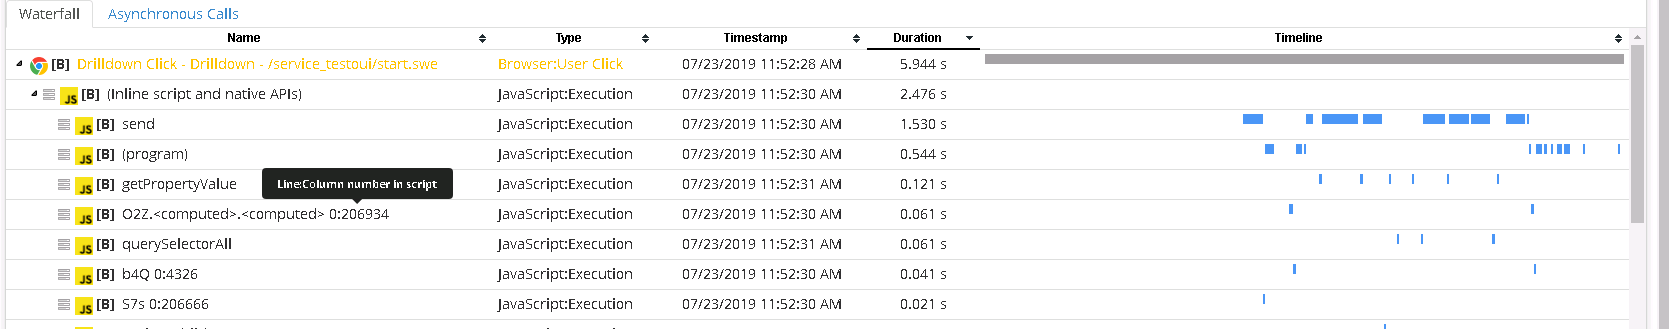
Insights about Stall, Connection, Wait, Download ,etc
KPIs
List of preconfigured KPIs for JavaScript.
Custom Real-time Insights for JavaScript
Here is a list of real-time analytics features in Germain UX that can be customized to gain more insights from your JavaScript application.
Real-time Automation for JavaScript
Germain provides key real-time automation features for JavaScript application, that can be customized to proactively detect or resolve issues that affect a JavaScript application.
Component: RUM JS, JS Profiler
Feature Availability: 2022.2 or later