
🐳 Docker Monitoring
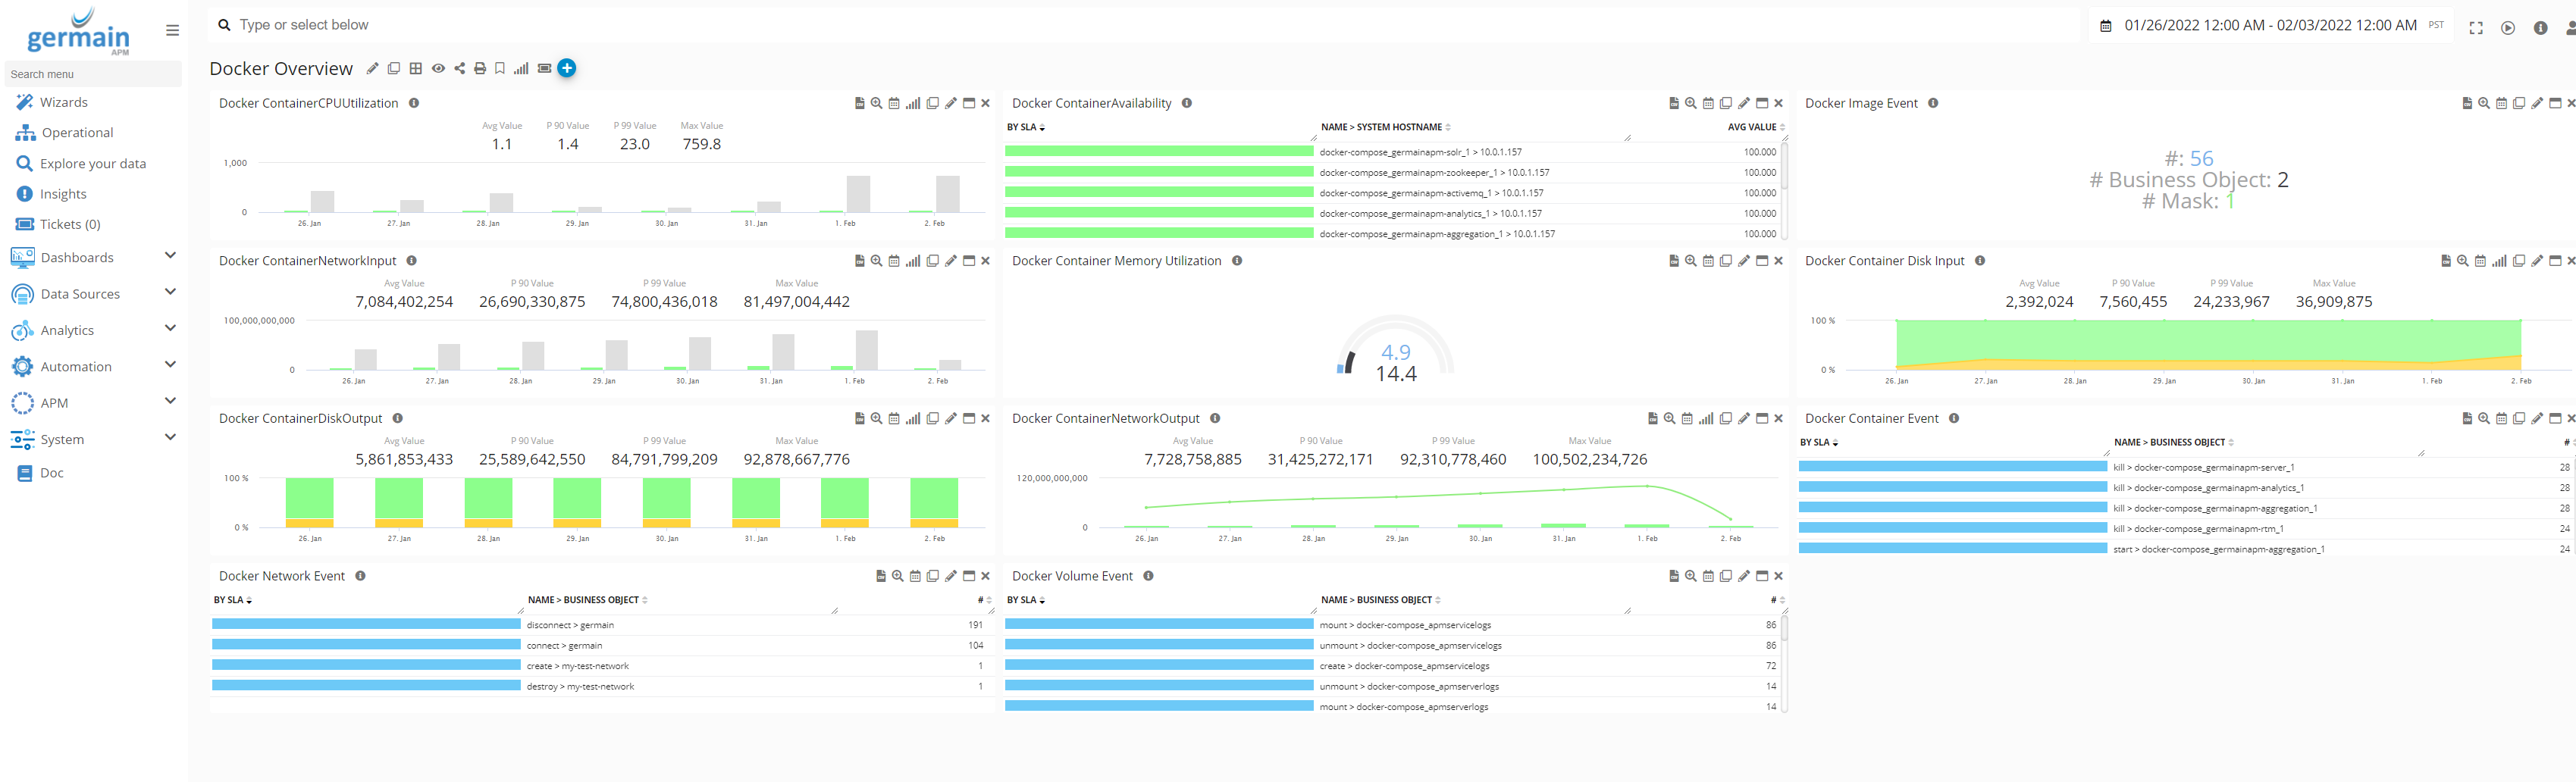
GermainUX monitors the availability, health, resource consumption, and operational activity of Docker hosts and containers.
🔗 Overview
The GermainUX Engine connects to an authorized Docker Engine API and collects container inventory, status, events, and available performance metrics. Related host metrics, application logs, and service availability can be monitored through additional GermainUX components.
⚙️ Monitoring component
|
Component |
Role |
|---|---|
|
Connects to the Docker Engine API, collects container data, monitors related infrastructure and logs, and sends the results to GermainUX for analytics and automation. |
🔍 Data sources
GermainUX can monitor Docker through:
|
Data source |
Purpose |
|---|---|
|
Docker Engine API |
Collect container inventory, status, events, resource statistics, images, networks, and volumes available through the API. |
|
Container logs |
Detect application errors, warnings, and operational events. |
|
Docker host monitoring |
Collect operating-system CPU, memory, disk, process, and network metrics. |
|
Application endpoints |
Test the availability and response time of services running in containers. |
|
Custom commands or queries |
Collect additional approved Docker or application information. |
|
External security scanners |
Ingest or analyze vulnerability results when an approved scanner or data source is integrated. |
The available data depends on the Docker version, API access, permissions, operating system, and configured GermainUX monitors.
✨ Capabilities
Docker host availability
GermainUX can monitor whether an authorized Docker Engine API is reachable and responding.
This helps detect:
-
An unavailable Docker host.
-
Docker daemon failures.
-
API connection failures.
-
Authentication or TLS problems.
-
Unexpected response times.
-
Network connectivity problems between the GermainUX Engine and Docker.
Container inventory
GermainUX can collect available container information such as:
-
Container ID.
-
Container name.
-
Image.
-
Current state.
-
Creation or start information.
-
Published ports.
-
Network associations.
-
Labels and other metadata exposed by Docker.
Inventory data can be used to identify unexpected changes and correlate containers with applications, hosts, environments, and services.
Container state and uptime
GermainUX can detect and analyze:
-
Running containers.
-
Stopped containers.
-
Container starts and stops.
-
Restarts.
-
Failed or exited containers.
-
Containers that repeatedly restart.
-
Changes in container availability.
-
Available health-check status.
A container’s reported state does not guarantee that the application inside it is functioning correctly. Configure application or endpoint monitoring when service-level validation is required.
Container CPU
Using metrics exposed by Docker, GermainUX can monitor available container CPU consumption and identify:
-
High CPU utilization.
-
Sustained CPU pressure.
-
Sudden utilization spikes.
-
Containers consuming more CPU than their peers.
-
Resource changes associated with an application slowdown.
CPU interpretation depends on host capacity, container limits, and how the Docker API reports the statistics.
Container memory
GermainUX can monitor available memory measurements, including:
-
Current memory consumption.
-
Memory utilization relative to an available limit.
-
Sustained memory growth.
-
Containers approaching their memory limit.
-
Memory conditions associated with restarts or failures.
Sustained growth may indicate a potential memory leak, but memory usage alone does not establish the root cause.
Container disk and block I/O
When exposed by Docker, GermainUX can monitor:
-
Block read and write activity.
-
I/O volume.
-
Containers with unusually high storage activity.
-
Changes in I/O behavior.
-
Available writable-layer or storage information.
Host disk capacity and storage latency require operating-system or storage monitoring in addition to Docker API data.
Container network activity
GermainUX can monitor available per-container network statistics such as:
-
Data received.
-
Data transmitted.
-
Network errors when exposed.
-
Traffic changes.
-
Containers with unusual network activity.
End-to-end latency, packet loss, route quality, and external service availability require additional network or endpoint monitoring.
Images
GermainUX can inventory image information exposed by the Docker Engine API, including available:
-
Image ID.
-
Repository and tag.
-
Creation information.
-
Size.
-
Image usage by containers.
GermainUX should not be described as a container-image vulnerability scanner unless an approved vulnerability scanner is integrated. GermainUX can ingest, correlate, report, and act on vulnerability findings from supported external data sources.
Networks
Depending on API access, GermainUX can collect Docker network inventory and associations to help determine:
-
Which containers are attached to a network.
-
Whether expected network objects exist.
-
Whether network configuration changed.
-
Which applications may be affected by a network-related Docker event.
Docker network inventory does not replace network-performance monitoring.
Volumes and storage
GermainUX can collect available Docker volume inventory and correlate it with containers.
Storage-capacity and performance monitoring may also require:
-
Host disk monitoring.
-
Filesystem monitoring.
-
Storage-platform monitoring.
-
Approved custom commands or queries.
Container events
Docker events can provide evidence of operational changes such as:
-
Container creation.
-
Start and stop activity.
-
Restarts.
-
Container termination.
-
Image activity.
-
Network or volume changes.
-
Health-status changes when available.
GermainUX can use these events to investigate what changed before an application or container problem occurred.
Logs
GermainUX can monitor container and application logs through supported Docker access or File and Log Monitoring.
Log analysis can detect:
-
Application errors.
-
Exceptions.
-
Warnings.
-
Startup failures.
-
Configuration problems.
-
Connection failures.
-
Newly observed or recurring messages.
Log collection must be configured for the application’s logging driver, log location, and retention model.
Docker host health
Deploy the applicable operating-system monitoring to collect host-level data that the Docker container statistics do not fully provide.
Host monitoring can include:
-
CPU usage and queue length.
-
Memory and swap utilization.
-
Disk capacity and I/O.
-
Network availability and utilization.
-
Docker daemon process status.
-
Host processes and services.
-
Operating-system logs and errors.
Host and container metrics can then be correlated to determine whether degradation originates from one container or the underlying Docker server.
Application availability
A running container may still contain an unavailable or unhealthy application.
Configure an HTTP, TCP, synthetic, database, or application-specific monitor when GermainUX must validate:
-
Service availability.
-
Endpoint response time.
-
Authentication.
-
A critical application transaction.
-
Database connectivity.
-
Integration availability.
-
A complete business workflow.
Business benefits
Docker Monitoring helps organizations:
-
Detect unavailable or restarting containers.
-
Identify containers consuming excessive CPU, memory, disk, or network resources.
-
Determine whether an issue originates from a container, application, Docker daemon, or host.
-
Correlate container changes with application failures.
-
Detect capacity and utilization trends.
-
Reduce the time required to troubleshoot intermittent container problems.
-
Prioritize issues according to affected applications and business services.
-
Validate container, image, configuration, and infrastructure changes.
-
Trigger approved notifications, diagnostics, and corrective actions.
Analytics
GermainUX can analyze Docker data through KPIs, measures, pivots, trends, drill-through views, correlations, and outlier detection.
|
Analysis area |
Examples |
|---|---|
|
Availability |
Docker host, container, application, and endpoint status |
|
Resource consumption |
CPU, memory, block I/O, and network usage |
|
Reliability |
Starts, stops, restarts, exits, health changes, and errors |
|
Inventory |
Hosts, containers, images, networks, and volumes |
|
Capacity |
Resource limits, host capacity, disk space, and growth |
|
Application health |
Logs, errors, endpoint response, and transaction results |
|
Impact |
Affected containers, applications, hosts, environments, and services |
|
Change |
New images, container replacements, configuration changes, and deployments |
Outlier detection
GermainUX can identify abnormal Docker behavior such as:
-
A container using significantly more CPU or memory than usual.
-
Unexpected restart activity.
-
Sudden changes in network traffic.
-
Unusual block I/O.
-
A newly failing container.
-
A container behaving differently from comparable containers.
-
Resource degradation following an image or application deployment.
-
Error rates that differ from their established baseline.
Outlier detection identifies behavior that requires investigation; it does not automatically establish a root cause.
Notifications and automation
GermainUX users can create Watches to receive notifications when existing Docker insights meet conditions of interest.
Detected conditions can also trigger approved actions such as:
-
Email or other configured notifications.
-
Reports.
-
HTTP requests or webhooks.
-
Diagnostic scripts.
-
Incident-management integrations.
-
Approved Docker commands.
-
Corrective workflows.
A container restart, stop, removal, or replacement is a service-impacting action. Automate it only with explicit authorization, restricted credentials, validation, safeguards, and an approved recovery procedure.
Prerequisites
Before deployment, confirm:
-
A GermainUX Engine can reach the Docker host.
-
The Docker Engine API is available through an approved connection method.
-
Authentication and TLS requirements are defined.
-
Firewall rules permit only the required access.
-
A least-privilege access model has been approved.
-
The Docker version and API version are supported.
-
Required container, image, network, and volume data is accessible.
-
Host and log access is available when those capabilities are required.
-
Monitoring frequency and data volume have been reviewed.
Secure Docker API access
Do not expose the unauthenticated Docker API on TCP port 2375, particularly through:
-H=tcp://0.0.0.0:2375
Access to an unsecured Docker API can provide control equivalent to root access on the Docker host.
Use an approved secure method, such as:
-
Local access through the Docker Unix socket when the GermainUX Engine runs on the host and this access is approved.
-
A TLS-protected Docker API, commonly using TCP port
2376. -
A restricted proxy or access-control layer.
-
Another supported, authenticated connection approved by the organization.
Membership in the local docker group also provides highly privileged control over Docker and should be granted only to an approved service account.
Configuration
Deploy the GermainUX Engine
Deploy the GermainUX Engine where it can securely access:
-
The Docker Engine API.
-
The Docker host when operating-system monitoring is required.
-
Container or application logs when log monitoring is required.
-
Application endpoints and dependencies.
-
GermainUX Enterprise.
Run the Docker wizard
-
Open Germain Workspace.
-
Go to Wizards > Docker.
-
Select the GermainUX monitoring node and Engine.
-
Enter the approved Docker connection information.
-
Configure authentication or TLS information when required.
-
Select the Docker host and monitoring scope.
-
Configure the execution schedule.
-
Review the generated monitoring components.
-
Finish the wizard.
-
Confirm that the components appear in Germain State.
Available fields and supported connection types can vary by GermainUX and Docker version.
Configure host monitoring
Deploy the applicable operating-system monitor for the Docker host:
-
AIX Monitoring, when applicable
-
The corresponding supported operating-system monitor for another Docker host
Configure log monitoring
Use File and Log Monitoring when container or application logs must be analyzed separately.
Define:
-
Log source or location.
-
Application and container context.
-
Parser or event rules.
-
Error categorization.
-
Rotation and retention behavior.
-
Sensitive-data exclusions.
-
Monitoring frequency.
Configure application monitoring
Add application-specific monitoring when container state alone is insufficient.
Depending on the workload, this can include:
-
HTTP or API monitoring.
-
Database monitoring.
-
Java or .NET code profiling.
-
Browser Real User Monitoring.
-
Synthetic user scenarios.
-
Business-process monitoring.
-
Integration monitoring.
Security
Docker monitoring requires privileged infrastructure access. Apply these safeguards:
-
Never expose an unauthenticated Docker TCP API.
-
Use TLS and client authentication for remote Docker API access.
-
Restrict access by network and firewall policy.
-
Use a dedicated monitoring identity.
-
Grant only the permissions required by the selected monitoring use cases.
-
Protect Docker certificates and credentials in GermainUX credential management.
-
Avoid collecting secrets from environment variables, labels, commands, or logs.
-
Restrict access to detailed container and application data.
-
Audit monitoring queries, scripts, and automated actions.
-
Rotate credentials and certificates according to policy.
Validation
After deployment:
-
Confirm that the GermainUX Engine can connect securely to Docker.
-
Verify the Docker host identity.
-
Confirm that expected containers, images, networks, and volumes appear.
-
Compare selected resource measurements with approved Docker tools.
-
Start and stop a controlled test container.
-
Verify that GermainUX detects the expected state changes.
-
Generate a controlled application or health-check failure when safe.
-
Confirm the expected KPIs, SLAs, Watches, and actions.
-
Validate host and log monitoring separately.
-
Confirm that monitoring does not create unacceptable Docker API or host load.
Deployment and configuration
|
For your Docker environment |
|---|
|
Review Deploy Monitoring for Docker. |
|
Deploy the GermainUX Engine where it can securely access the Docker environment. |
|
Enable an authenticated and encrypted Docker Engine API connection; do not expose an unauthenticated API on port |
|
Run the Docker wizard in GermainUX. |
|
Configure Linux Monitoring or the applicable operating-system monitor for Docker host health. |
|
Configure File and Log Monitoring for container and application logs. |
|
Configure application, API, database, browser, code, or synthetic monitoring according to the workloads running in Docker. |
|
Review Kubernetes Monitoring when containers are orchestrated by Kubernetes. |
|
Configure KPIs, SLAs, Watches, reports, and approved actions according to the monitoring objectives. |
ℹ️ Get Help
The Germain Team can help you set this up. Contact GermainUX Support.
Component: Engine
Feature Availability: 2021.1 or later