Marketing KPIs, Pivots & Measures
Features
A number of KPIs are preconfigured in Germain to help improve Adoption, Conversion or Retention, and help you understand Campaign Performance, Drop-offs, User/Client/Prospect Experience, perform A/B Tests, etc.
Video overview: https://youtu.be/dCDx_t9Vdro.
KPIs
Preconfigured KPIs and we/you can create your own KPI.
KPI | Description |
|---|---|
Outbound Document Request | |
User Session Replay | A recorded end-user session of an application accessed via a browser. |
User Click | A User that clicks on an application accessed via a browser (Any Web Application accessed via a Browser). |
Website Audit | SEO Analysis of a Website. |
Marketing Campaign Insights
To understand the performance of your marketing campaigns, here are further details and instructions on how to enable it.
Pivots
Available Pivots to help you further analyze these 5 above KPIs. Note there might be a few less or more Pivots for each KPIs but this is to give you an overview.
Pivot |
Access |
Application Component |
Application Name |
Campaign Content |
Campaign Medium |
Campaign Name |
Campaign Source |
Campaign Term |
Client IP |
Client Location City |
Client Location Continent |
Client Location Country |
Client Location Region |
Color |
Correlation Id |
Count Dropoff |
Count Not Dropoff |
End Time |
Environment Browser |
Environment Browser Family |
Environment Device |
Environment OS |
Exit Page Path |
Exit Page Query |
Exit Page Title |
Landing Page Path |
Landing Page Query |
Landing Page Title |
Provenance |
Ref Subtype |
Ref Type |
Ref Url |
Returning User |
Session Id |
Status |
System Environment |
System Name |
System Type |
Target Environment |
Target Hostname |
Target Location City |
Target Location Continent |
Target Location Country |
Target Location Region |
Target Name |
Target Type |
User |
User Department |
User Group |
User Location City |
User Location Continent |
User Location Country |
User Location Region |
User Role |
User Type |
Measures
Available Measures to help you further analyze 5 above KPIs.
Measures |
# Session For New User |
# Session For Returning User |
% Session For New User |
% Session For Returning User |
Average Active Duration |
Average Color Threshold |
Average Duration |
Average Error # |
Average Feedback Comment # |
Average Inactive Duration |
Average Negative Feedback # |
Average Page Visited |
Average Positive Feedback # |
Count |
Count Unique Access |
Count Unique Application Component |
Count Unique Application Name |
Count Unique Campaign Content |
Count Unique Campaign Medium |
Count Unique Campaign Name |
Count Unique Campaign Source |
Count Unique Campaign Term |
Count Unique Client IP |
Count Unique Client Location City |
Count Unique Client Location Continent |
Count Unique Client Location Country |
Count Unique Client Location Region |
Count Unique Color |
Count Unique Correlation Id |
Count Unique End Time |
Count Unique Environment Browser |
Count Unique Environment Browser Family |
Count Unique Environment Device |
Count Unique Environment OS |
Count Unique Exit Page Path |
Count Unique Exit Page Query |
Count Unique Exit Page Title |
Count Unique Landing Page Path |
Count Unique Landing Page Query |
Count Unique Landing Page Title |
Count Unique Provenance |
Count Unique Ref Subtype |
Count Unique Ref Type |
Count Unique Ref Url |
Count Unique Returning User |
Count Unique Session Id |
Count Unique Status |
Count Unique System Environment |
Count Unique System Name |
Count Unique System Type |
Count Unique Target Environment |
Count Unique Target Hostname |
Count Unique Target Location City |
Count Unique Target Location Continent |
Count Unique Target Location Country |
Count Unique Target Location Region |
Count Unique Target Name |
Count Unique Target Type |
Count Unique User |
Count Unique User Department |
Count Unique User Group |
Count Unique User Location City |
Count Unique User Location Continent |
Count Unique User Location Country |
Count Unique User Location Region |
Count Unique User Role |
Count Unique User Type |
Max Active Duration |
Max Color Threshold |
Max Duration |
Max Error # |
Max Feedback Comment # |
Max Inactive Duration |
Max Negative Feedback # |
Max Page Visited |
Max Positive Feedback # |
Min Active Duration |
Min Color Threshold |
Min Duration |
Min Error # |
Min Feedback Comment # |
Min Inactive Duration |
Min Negative Feedback # |
Min Page Visited |
Min Positive Feedback # |
Percentage Dropoff |
Percentage Not Dropoff |
Percentile (50th) Active Duration |
Percentile (50th) Duration |
Percentile (50th) Error # |
Percentile (50th) Feedback Comment # |
Percentile (50th) Inactive Duration |
Percentile (50th) Negative Feedback # |
Percentile (50th) Page Visited |
Percentile (50th) Positive Feedback # |
Percentile (90th) Active Duration |
Percentile (90th) Duration |
Percentile (90th) Error # |
Percentile (90th) Feedback Comment # |
Percentile (90th) Inactive Duration |
Percentile (90th) Negative Feedback # |
Percentile (90th) Page Visited |
Percentile (90th) Positive Feedback # |
Percentile (95th) Active Duration |
Percentile (95th) Duration |
Percentile (95th) Error # |
Percentile (95th) Feedback Comment # |
Percentile (95th) Inactive Duration |
Percentile (95th) Negative Feedback # |
Percentile (95th) Page Visited |
Percentile (95th) Positive Feedback # |
Percentile (99.9th) Active Duration |
Percentile (99.9th) Duration |
Percentile (99.9th) Error # |
Percentile (99.9th) Feedback Comment # |
Percentile (99.9th) Inactive Duration |
Percentile (99.9th) Negative Feedback # |
Percentile (99.9th) Page Visited |
Percentile (99.9th) Positive Feedback # |
Percentile (99th) Active Duration |
Percentile (99th) Duration |
Percentile (99th) Error # |
Percentile (99th) Feedback Comment # |
Percentile (99th) Inactive Duration |
Percentile (99th) Negative Feedback # |
Percentile (99th) Page Visited |
Percentile (99th) Positive Feedback # |
Standard Deviation Active Duration |
Standard Deviation Duration |
Standard Deviation Error # |
Standard Deviation Feedback Comment # |
Standard Deviation Inactive Duration |
Standard Deviation Negative Feedback # |
Standard Deviation Page Visited |
Standard Deviation Positive Feedback # |
Total Active Duration |
Total Color Threshold |
Total Duration |
Total Error # |
Total Feedback Comment # |
Total Inactive Duration |
Total Negative Feedback # |
Total Page Visited |
Total Positive Feedback # |
Average Duration |
Count |
Count Unique Access |
Count Unique Color |
Count Unique Session Id |
Count Unique Snapshot Timestamps |
Count Unique Tab Id |
Max Duration |
Min Duration |
Percentile (50th) Duration |
Percentile (90th) Duration |
Percentile (95th) Duration |
Percentile (99.9th) Duration |
Percentile (99th) Duration |
Standard Deviation Duration |
Total Duration |
Filters
Filters provide more insights, and are automatically computed by Germain UX.

Dropoff - Germain UX
Dropoffs
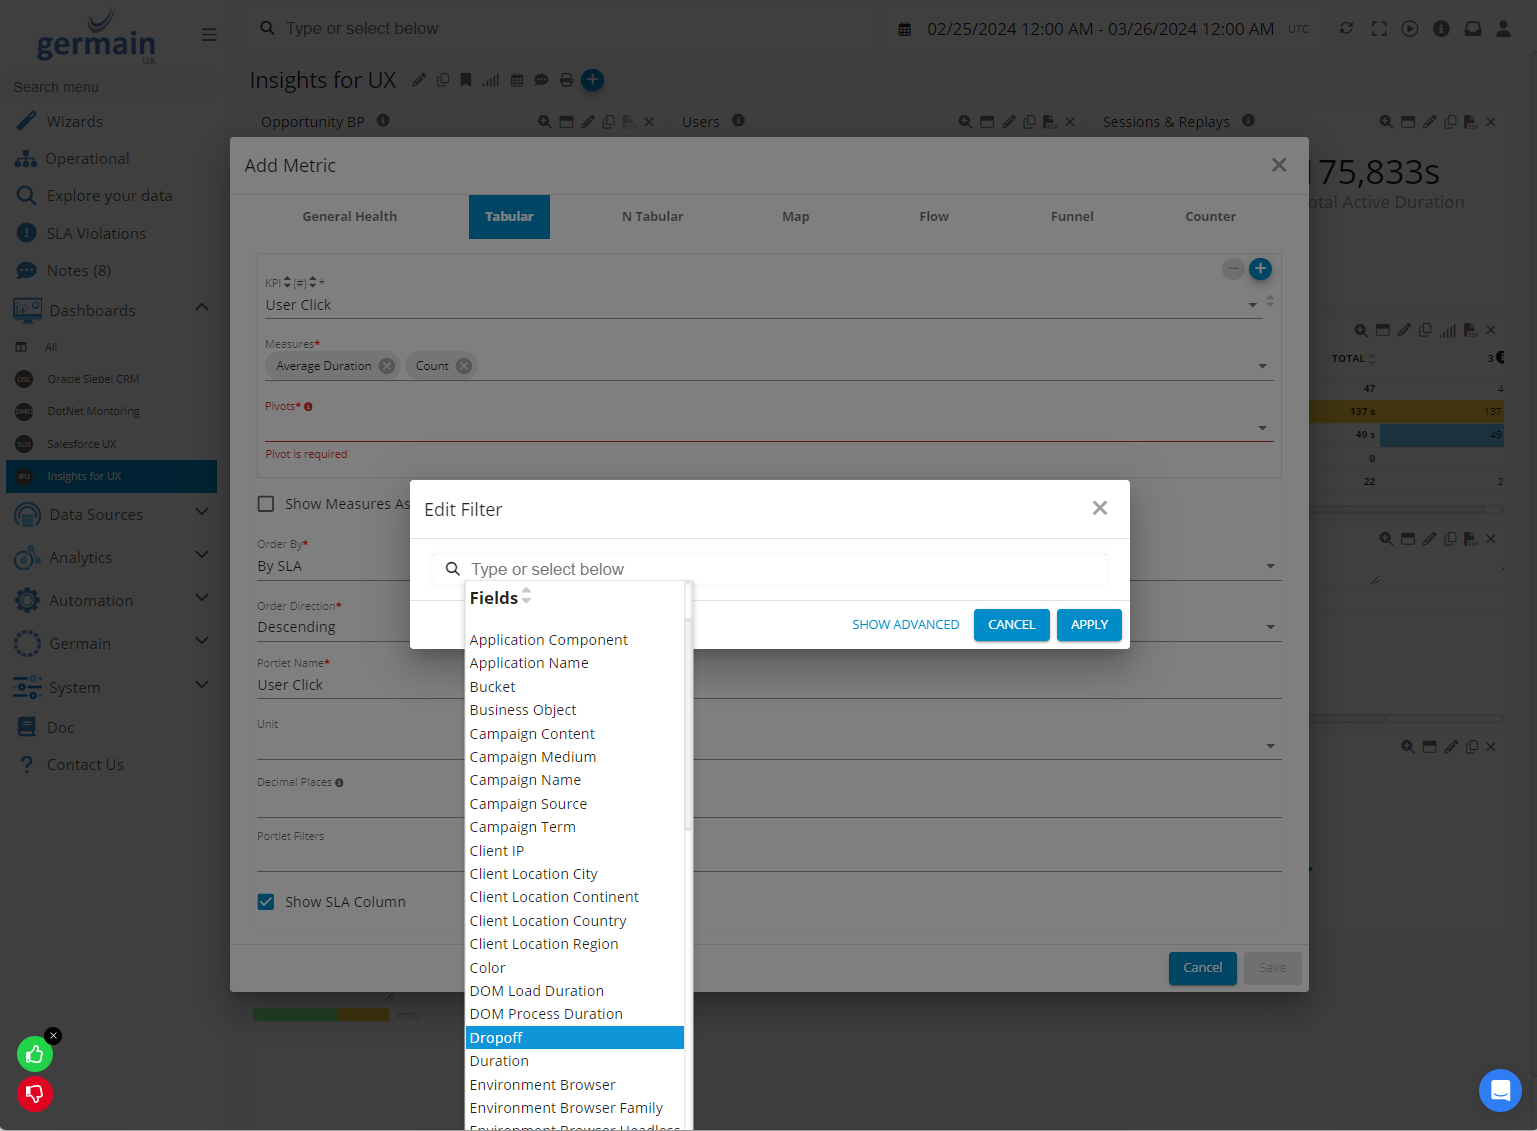
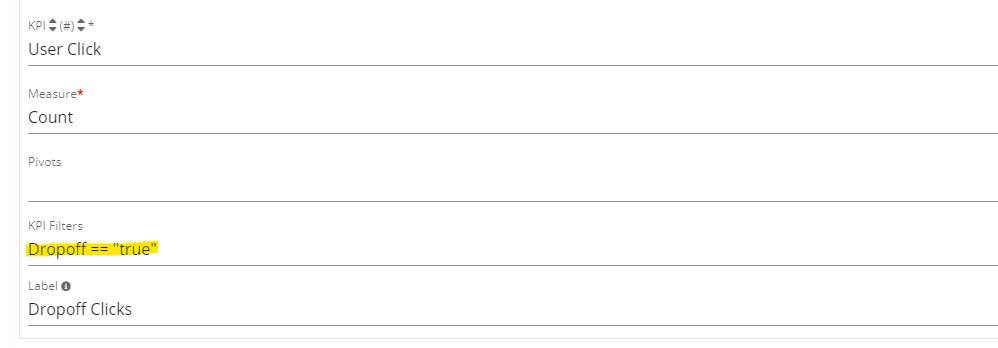
One of the many KPI filters is the Dropoff filter, which can be used as following:

Filter ‘Dropoff is True’ - Germain UX
Dropoffs can be viewed on all portlets.
For instance, you can view dropoffs on Aggregate portlet to quantify issues at scale:

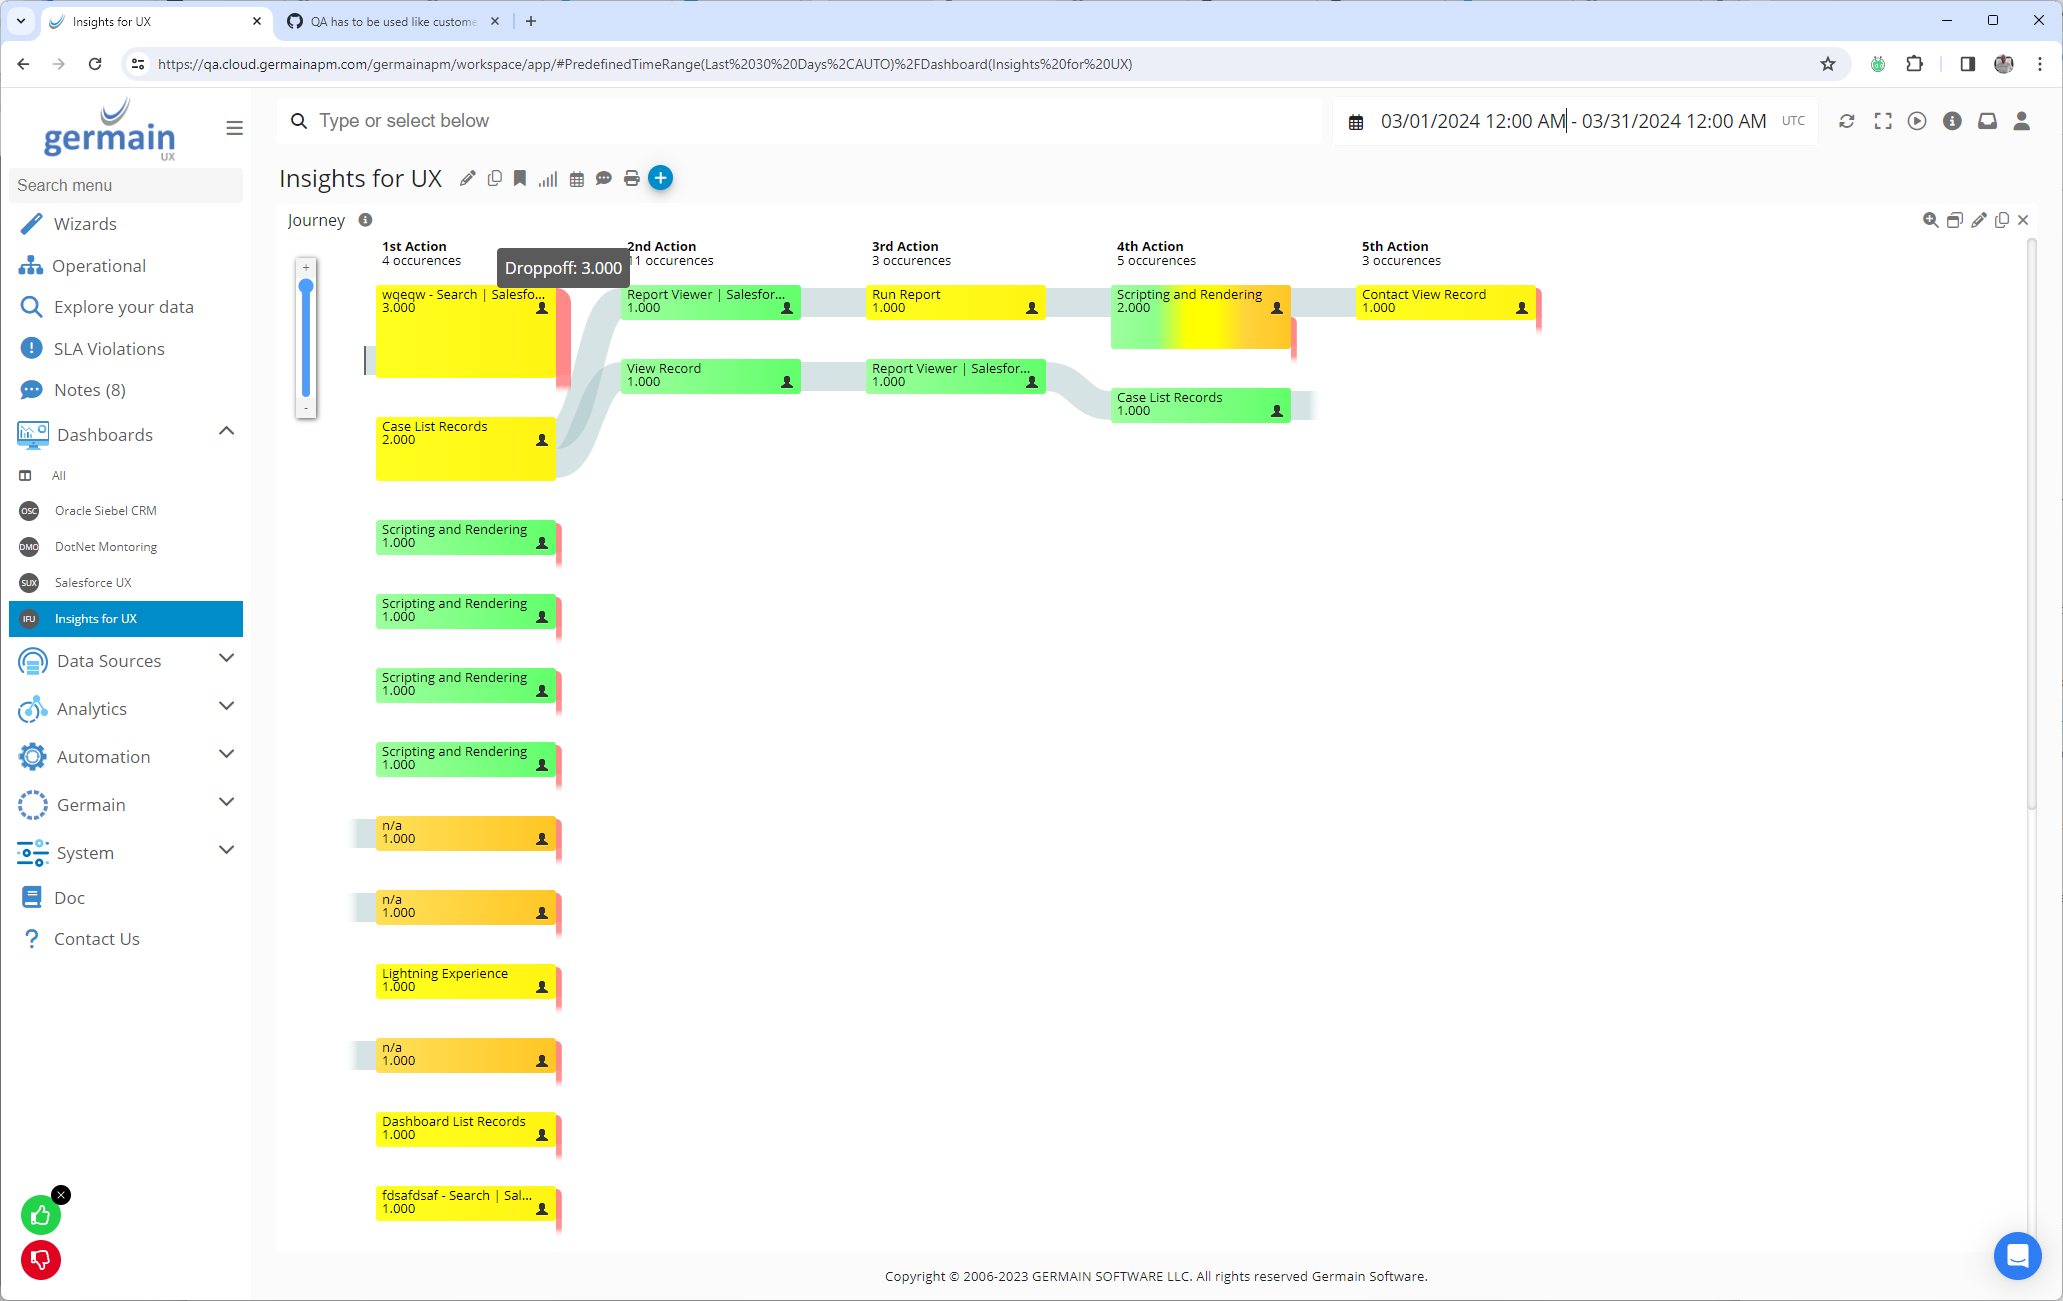
Or you can view Dropoffs on a flow graph to understand when users or processes fail to complete what they were expected to:

Dropoffs on flow graph - Germain UX
And from there, you can drilldown into Dropoffs and further analyze them a this Drillthrough dashboard:

Dropoffs on drillthrough dashboard - Germain UX
And from the Drillthrough dashboard, if you are a DevOps engineer, you can drilldown into the 4th level of analysis called the RCA dashboard.
Service: Analytics
Feature Availability: 2021.3 or later
