Steps on how to deploy Germain UX - Code Profiler for GoLang.
Add Golang profiling to you application
The official Golang documentation best explains how to add the ‘pprof’ package, and start a listener for 'pprof' in your GoLang application: https://golang.org/pkg/net/http/pprof/
Import Golang settings into Germain
The setting json files are available here
[service-disto]/install/configuration/golang/
You will need to import:
-
germain.apm.monitoringConfig.components.json -
germain.apm.monitoringConfig.keyPerformanceIndicators.json -
germain.apm.workspace.rcaDashboards.json
Optionally you can import a pre-made Golang Dasboard
-
germain.apm.workspace.dashboards.json
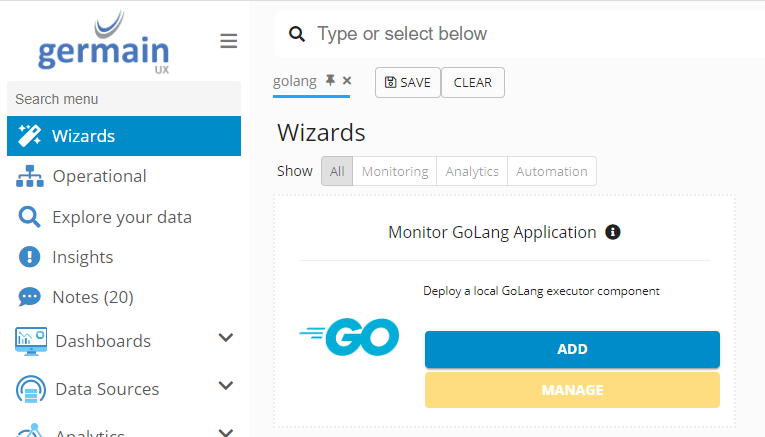
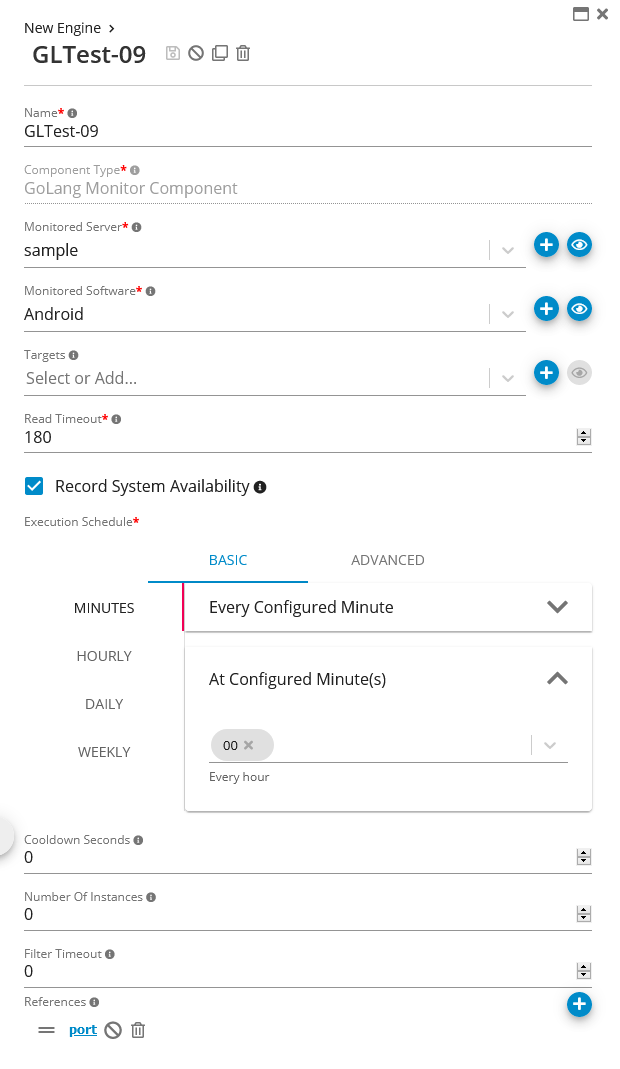
Go to Germain Workspace > Left Menu > Wizard > Golang
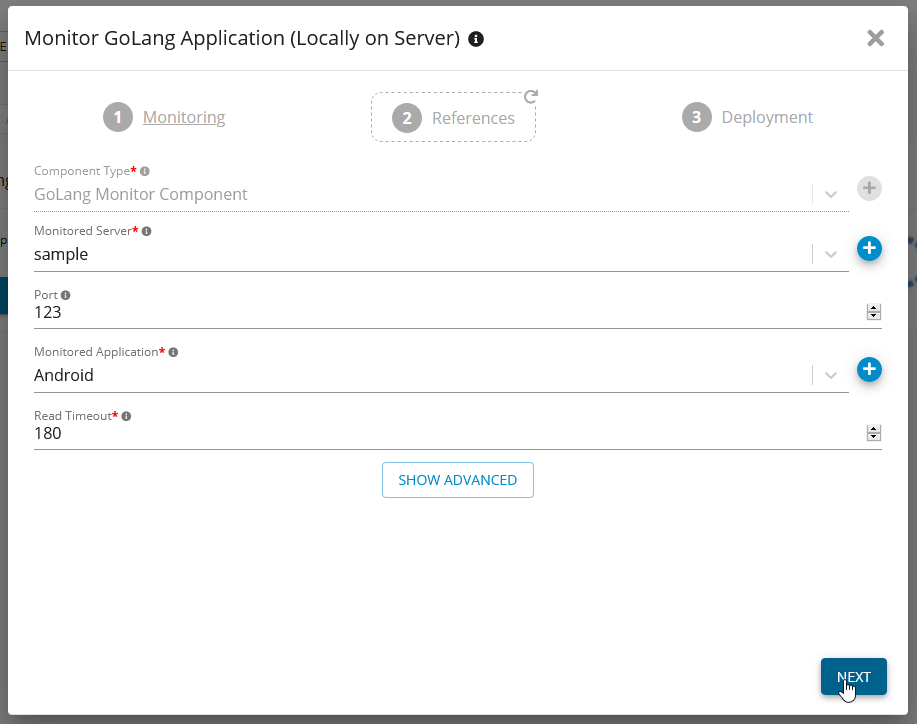
Enter ‘Monitored Server’, ‘Port’, ‘Monitored Application’ and ‘Read Timeout’
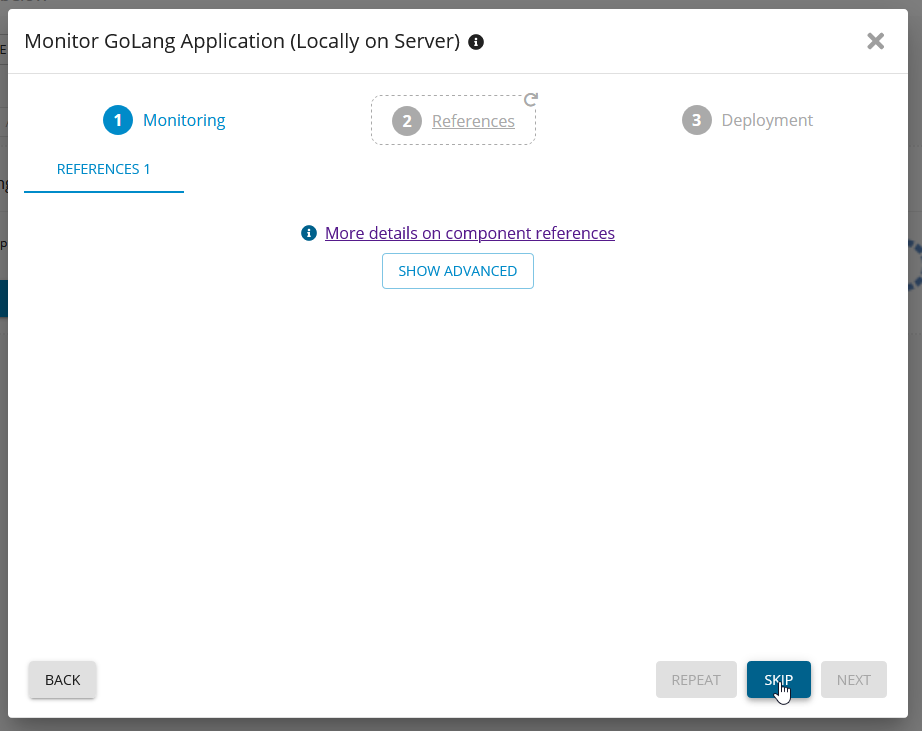
Unless you have special configuration, you can click 'skip'
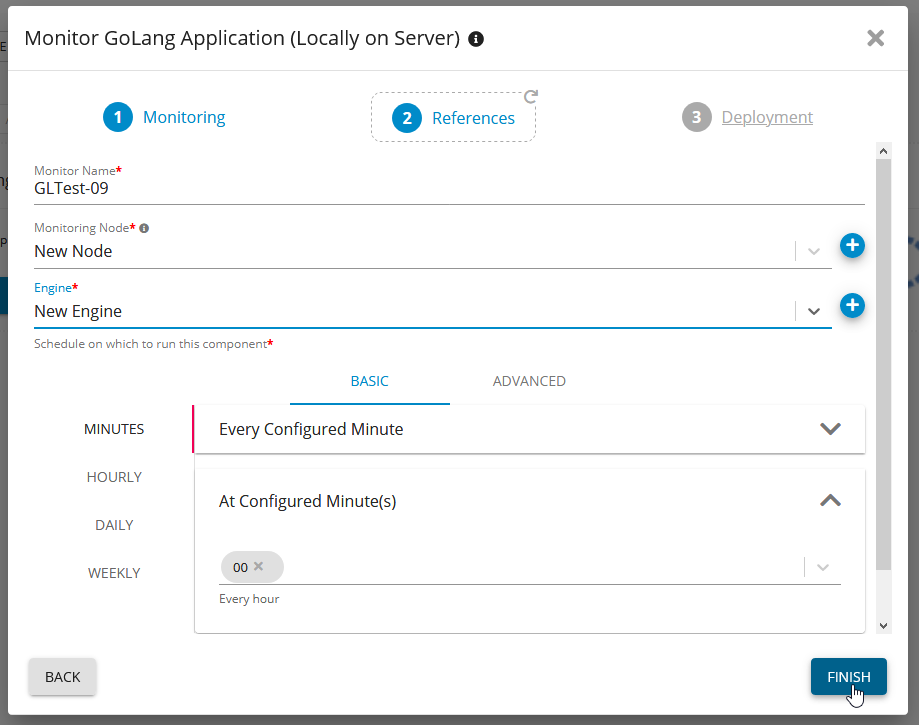
Choose a 'Monitor Name', ‘Monitoring Node’, ‘Engine’
Set a schedule to run the Monitor on
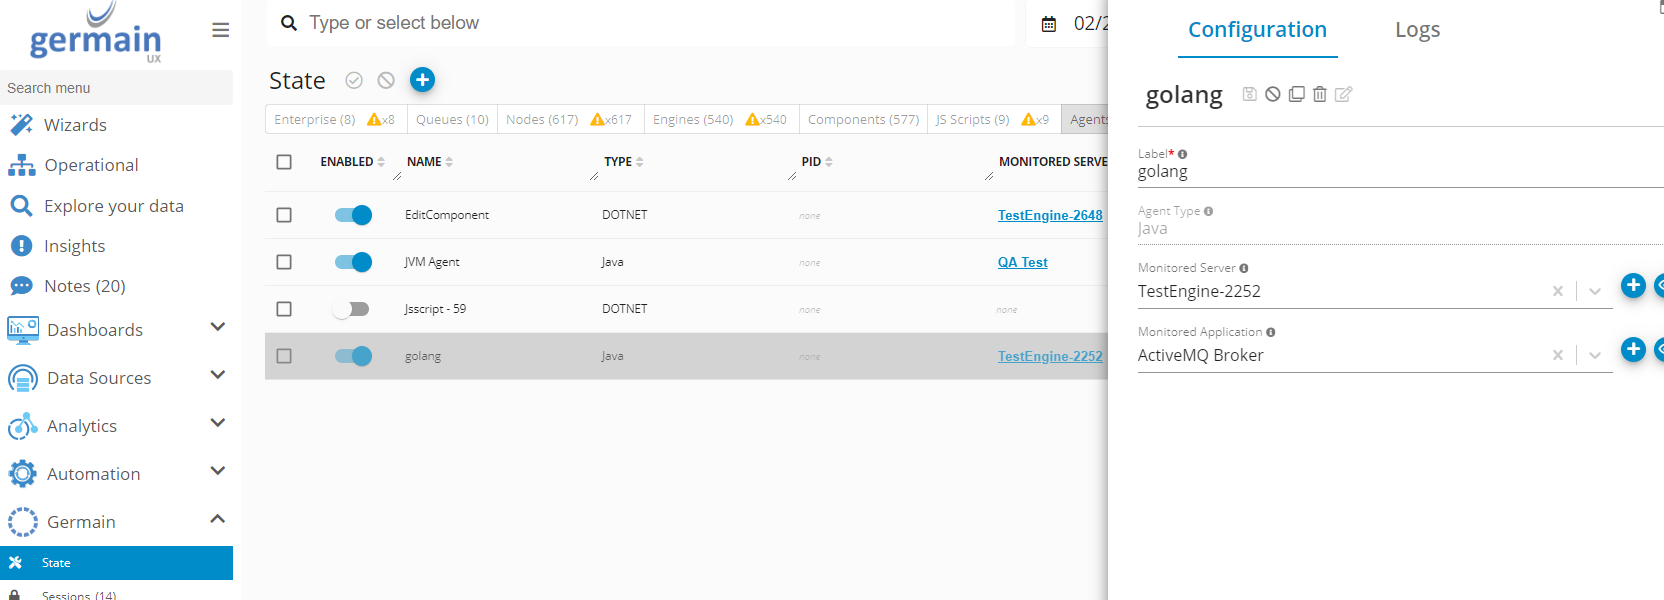
Check whether it is running on the State screen
Component: Code Profiler
Feature Availability: 8.6.0 or later