
MarkoJS Operational Experience Intelligence
📊 Monitor User Experience, Performance & Reliability with GermainUX
GermainUX provides real-time Digital Experience Monitoring, Observability, Analytics, and Automation for MarkoJS applications.
Understand how users experience your MarkoJS application, identify frontend friction and performance issues, diagnose their underlying causes, and prioritize the issues with the greatest user and business impact.
GermainUX provides visibility across:
User Experience → MarkoJS Components → JavaScript → Network / APIs → Backend Services → Infrastructure
GermainUX can help teams:
-
Understand actual user behavior
-
Replay user sessions
-
Identify user friction
-
Monitor page and application performance
-
Detect JavaScript and network errors
-
Analyze MarkoJS component performance
-
Diagnose slow JavaScript execution
-
Monitor critical user journeys proactively
-
Identify browser-specific issues
-
Correlate frontend issues with backend and infrastructure performance
-
Alert teams when critical conditions occur
-
Automate operational workflows
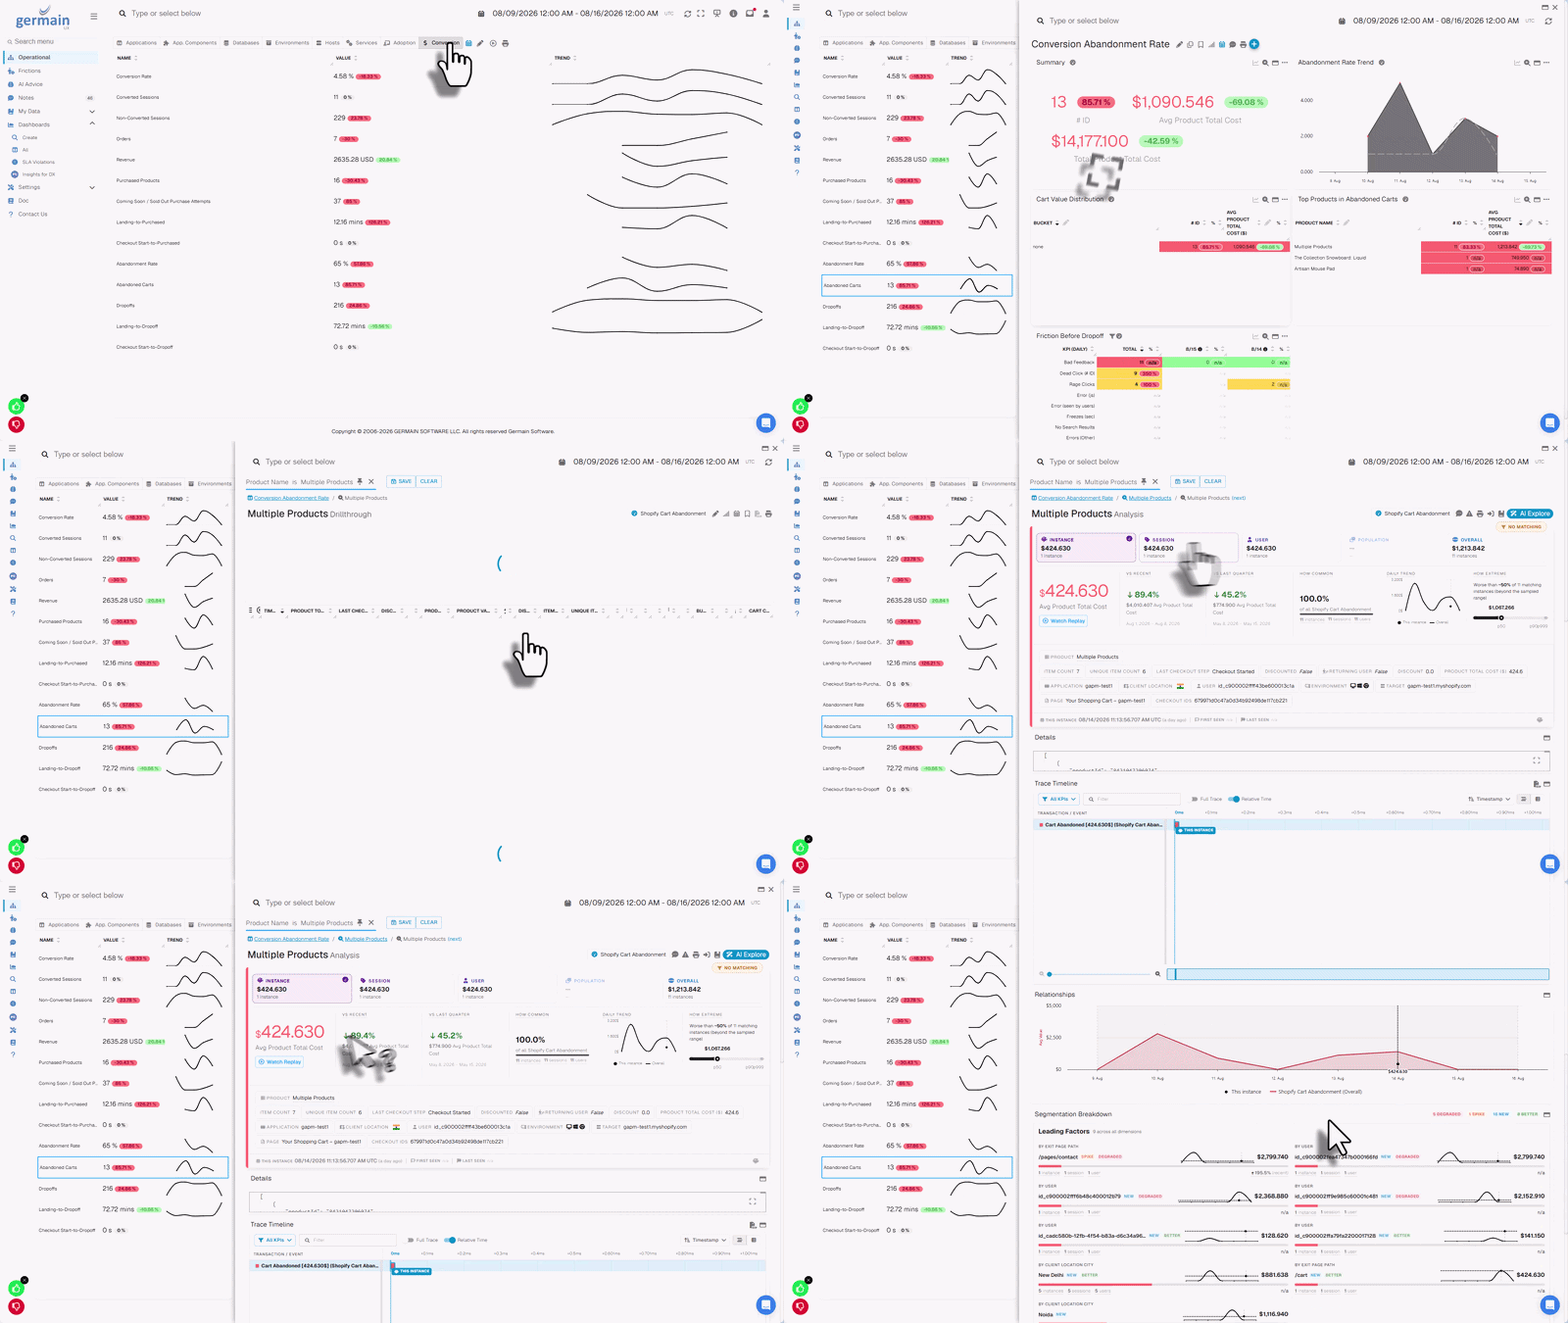
🎥 Real User Monitoring & Session Replay
GermainUX captures actual MarkoJS user sessions, providing detailed visibility into what users experienced.
Session Replay helps teams understand:
-
What users did
-
How they navigated through the application
-
Where they encountered friction
-
Which actions they performed
-
Which errors affected their experience
-
Where they hesitated or repeated actions
-
Which application workflows failed or performed poorly
Sessions and their associated behavioral and technical data are searchable, allowing teams to quickly find the users and moments relevant to a specific issue.
🤖 AI-Powered Session Analysis
GermainUX AI can analyze individual user sessions and automatically summarize what occurred, helping teams understand the user experience without watching the entire replay.
At scale, AI-generated insights and recommendations can be delivered through real-time dashboards and automated reports.
This helps teams identify recurring friction, errors, and performance issues across hundreds or thousands of sessions and prioritize the issues requiring attention.
🧩 MarkoJS Component Performance
Monitor the usage and performance of components within your MarkoJS application.
GermainUX can help identify components that are slow or inefficient and may be degrading the overall user experience.
Component-level analysis helps teams understand:
-
Which components are being used
-
Which components are slow
-
Where rendering time is being spent
-
Which components contribute to application performance issues
This provides developers with additional context for optimizing MarkoJS applications.
🚀 JavaScript Performance & Profiling
GermainUX can analyze JavaScript execution to identify frontend performance bottlenecks.
With the GermainUX JS Profiler, teams can investigate:
-
Slow JavaScript execution
-
Expensive functions
-
Long-running operations
-
Browser-side performance bottlenecks
-
Code contributing to poor responsiveness
This provides deeper diagnostics when standard Real User Monitoring identifies a frontend performance issue requiring code-level investigation.
❗ Error Monitoring
Detect errors affecting actual MarkoJS users in real time.
GermainUX can capture and analyze:
-
JavaScript errors
-
Console errors
-
Network errors
-
Failed requests
-
HTTP errors
Rather than treating every technical error equally, teams can analyze which errors affected actual users and application workflows.
Affected sessions can be reviewed using Session Replay to understand what happened before, during, and after an error.
🌐 Network & API Performance
Monitor network requests generated by the MarkoJS application to identify communication and backend performance issues.
GermainUX can provide visibility into:
-
Request and response times
-
HTTP status codes
-
Failed requests
-
API performance
-
Network latency
This helps teams determine whether poor application performance originates in the frontend, network, API, or supporting backend service.
📈 Application Performance
Monitor the real-world performance of MarkoJS applications using actual user activity.
GermainUX can track performance indicators such as:
-
Application availability
-
Page load time
-
Response time
-
Network performance
-
User transaction performance
Performance data can be correlated with user sessions, errors, components, and other monitored technologies to understand the actual user impact of performance degradation.
🌐 Cross-Browser Experience
Monitor MarkoJS application behavior across different browsers and browser versions.
This helps teams identify:
-
Browser-specific errors
-
Performance differences
-
Compatibility issues
-
User experiences that differ by browser
Teams can use this information to identify issues affecting specific user populations rather than relying only on laboratory testing.
🤖 Synthetic Monitoring
GermainUX RPA can proactively test critical MarkoJS application journeys without waiting for an actual user to encounter a problem.
For example:
Open Application → Login → Navigate → Execute Critical Transaction → Validate Result
Synthetic transactions can continuously validate:
-
Application availability
-
Login
-
Navigation
-
Critical workflows
-
Transaction performance
-
Expected application behavior
Alerts or automated actions can be triggered when a synthetic transaction fails or exceeds defined thresholds.
📃 Logging & Troubleshooting
GermainUX can monitor application and system logs to provide additional context when troubleshooting MarkoJS application issues.
Errors, warnings, and other relevant events can be analyzed alongside frontend monitoring data to help teams identify underlying causes more quickly.
🖥️ Infrastructure & Resource Monitoring
For MarkoJS applications supported by monitored servers or cloud infrastructure, GermainUX can also provide visibility into infrastructure resources such as:
-
CPU
-
Memory
-
Disk
-
Operating system
-
Containers
-
Supporting services
Combining application and infrastructure monitoring helps determine whether a user-facing performance issue originates in the browser, application, backend service, or underlying infrastructure.
🔍 Root Cause & User Impact Analysis
One of the key benefits of combining Real User Monitoring with application and infrastructure observability is the ability to connect user friction with its underlying technical cause.
For example:
Slow User Action → MarkoJS Component → JavaScript Execution
or:
Failed User Transaction → Network Request → API / Backend Error
or:
Application Slowdown → Backend Service → Infrastructure Resource Constraint
This helps teams answer both:
What did the user experience?
and:
Why did it happen?
📊 Real-Time Dashboards & Automated Reports
MarkoJS monitoring data can be analyzed through customizable real-time dashboards and automated reports.
Examples include:
-
User experience
-
Application performance
-
User friction
-
JavaScript errors
-
Network errors
-
Component performance
-
Browser performance
-
Critical user journeys
-
Application availability
-
Infrastructure performance
Dashboards and reports can combine MarkoJS telemetry with data from other technologies monitored by GermainUX to provide broader operational context.
🚨 Alerts & SLA Monitoring
Configure alerts and SLA thresholds for conditions such as:
-
Application unavailable
-
Critical user journey failure
-
New or critical JavaScript errors
-
Network/API failures
-
Performance degradation
-
Slow user transactions
-
Synthetic transaction failures
-
Backend or infrastructure issues affecting the application
Alert conditions, thresholds, time windows, recipients, and escalation logic are configurable.
⚙️ Automation
GermainUX can trigger automated actions when defined MarkoJS application conditions occur.
For example:
Detect → Analyze → Alert → Create Ticket → Trigger Action
Depending on the use case, automation can include:
-
Alerts and notifications
-
Ticket or incident creation
-
Script execution
-
HTTP execution
-
Program / RPA execution
-
Scheduled actions
-
Custom operational workflows
-
Remediation actions where appropriate
Automation can be triggered based on technical conditions, user impact, business impact, or combinations of monitored events.
🔗 End-to-End Observability
GermainUX can combine MarkoJS monitoring with telemetry from APIs, backend applications, databases, operating systems, containers, and infrastructure.
This provides broader visibility across:
User → Browser → MarkoJS → JavaScript → API / Service → Backend → Infrastructure
Teams can move from an affected user session to the technical components supporting that experience, helping accelerate root-cause analysis and prioritization.
🔧 Deployment
MarkoJS monitoring can be deployed using the GermainUX components appropriate for your monitoring requirements.
For most user-facing MarkoJS applications, GermainUX RUM JS provides the foundation for Real User Monitoring, Session Replay, browser errors, network requests, and user-experience analytics.
Additional capabilities can be enabled using:
-
JS Profiler for deeper JavaScript performance analysis
-
RPA Bot Recorder for synthetic monitoring
-
Engine for backend, infrastructure, analytics, and automation
-
RUM Ext where extended browser monitoring capabilities are required
See Deploy Monitoring for MarkoJS for deployment instructions.
ℹ️ Get More Information
GermainUX MarkoJS monitoring is highly configurable and can be tailored to your application's user journeys, frontend architecture, performance requirements, and supporting infrastructure.
The GermainUX team can help configure the appropriate monitoring scope, analytics, dashboards, reports, alerts, and automation for your environment.
Please contact us for any help.
Component: Engine, JS Profiler, RPA Bot Recorder, RUM JS, RUM Ext
Feature Availability: 2022.1 or later