
📃 JavaScript Console and Error Monitoring
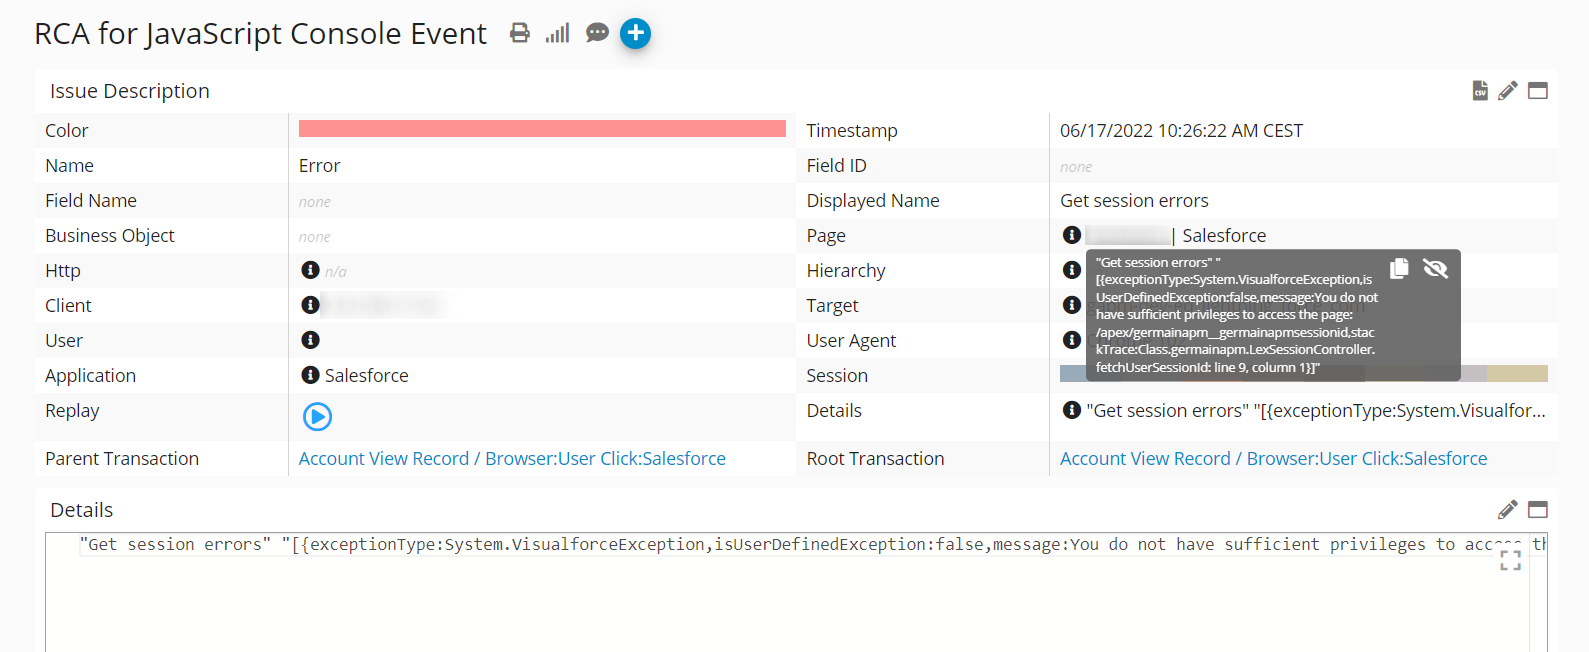
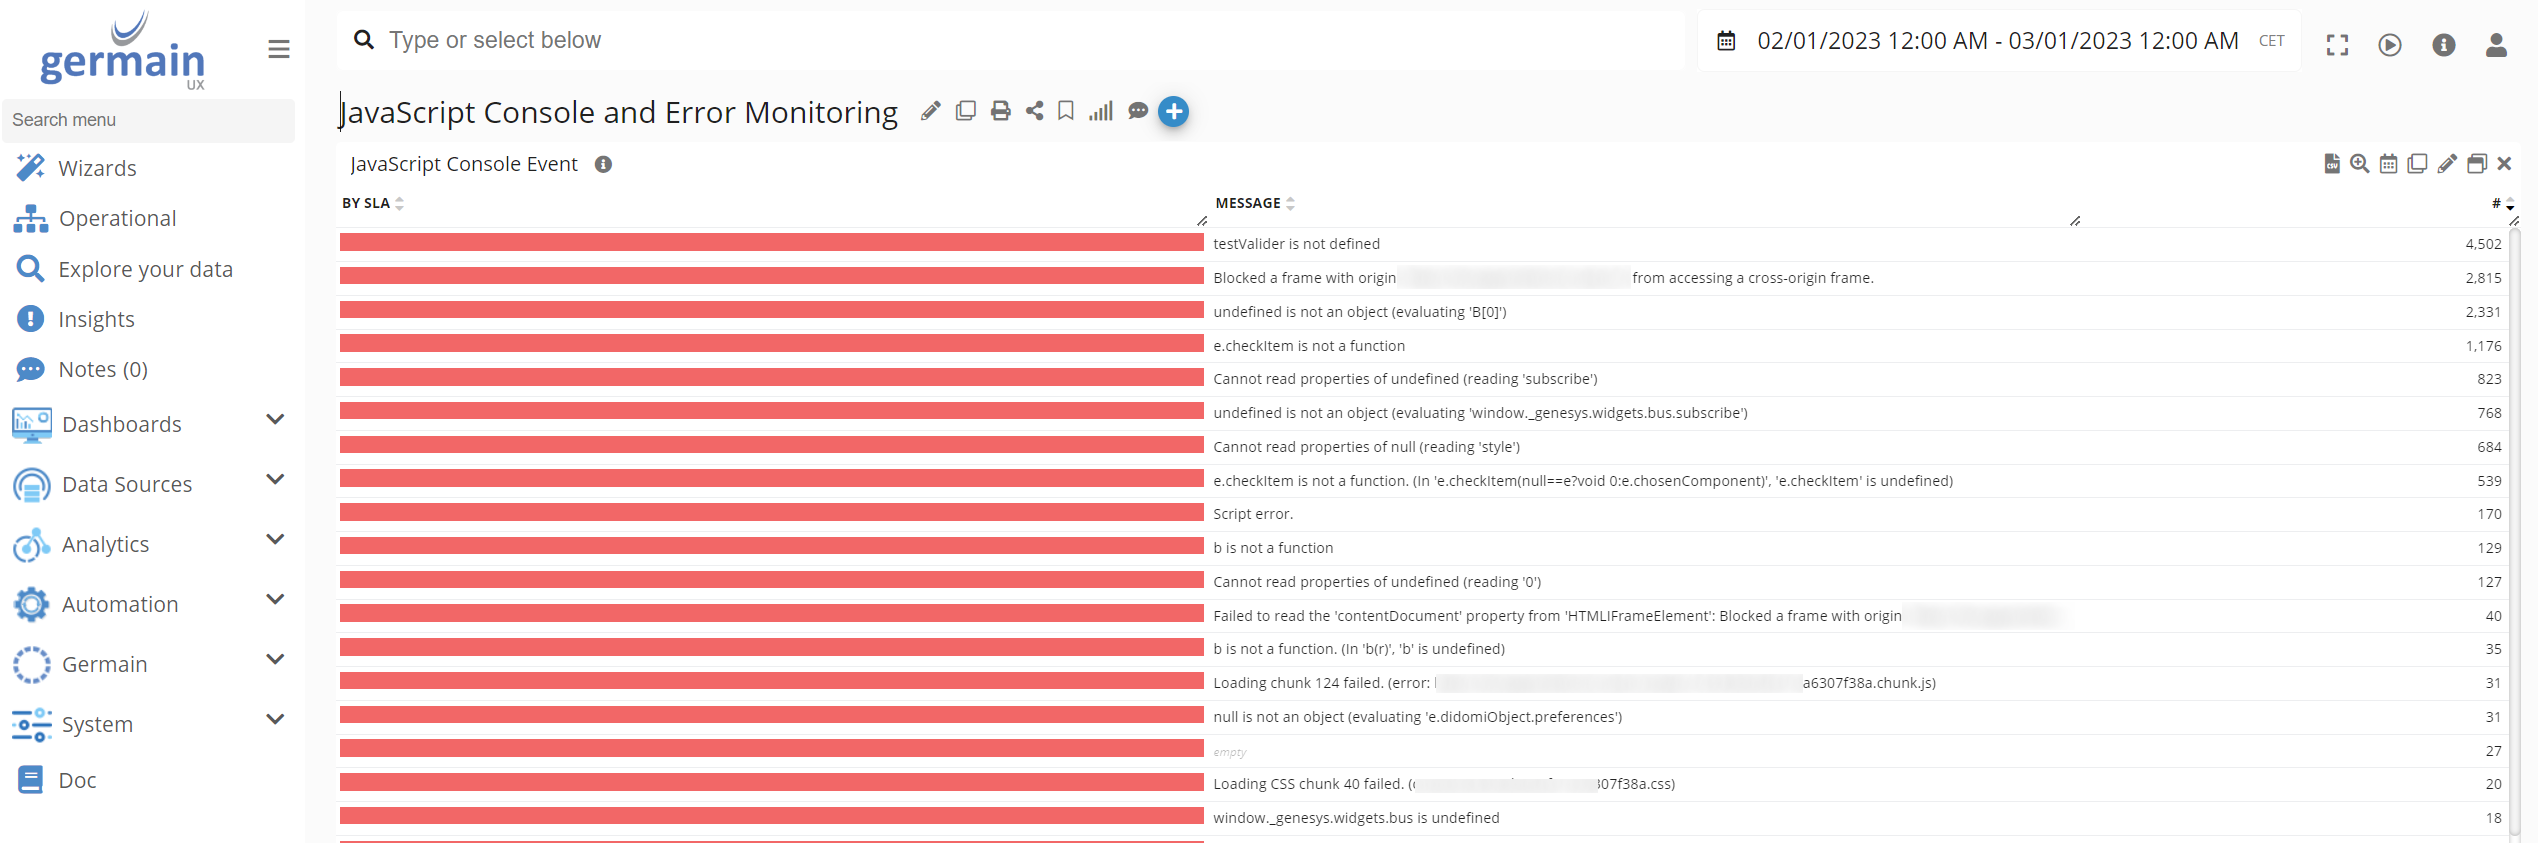
GermainUX automatically captures JavaScript errors and browser-console events generated while users interact with monitored web applications. Each event is associated with its application, page, browser, user, and session context, helping teams understand what failed, who was affected, and what the user experienced.
JavaScript Console and Error Monitoring is enabled by default for each User Monitoring Profile.
🔍 Monitoring components
|
Component |
Role |
|---|---|
|
Continuously captures JavaScript errors and selected console events when the monitoring script can be deployed in the application. |
|
|
Provides browser monitoring when RUM JS cannot be deployed directly or access to the complete browser-page context requires an extension. |
|
|
Captures deeper JavaScript execution, function timing, stack traces, browser activity, DOM activity, and network evidence for code-level investigation. |
✨ Capabilities
GermainUX can capture and analyze:
-
Uncaught JavaScript errors reported by the browser.
-
Console errors generated by the monitored application.
-
Error messages and available stack traces.
-
The application, page, browser, user, and session associated with each error.
-
Additional console methods when explicitly enabled.
-
User interactions and browser activity occurring around the error.
-
Error frequency, recurrence, trends, and affected-user counts.
-
Related network requests, long tasks, freezes, and other available technical evidence.
-
Detailed JavaScript execution information when the JS Profiler is enabled.
JavaScript errors handled internally by the application are available to GermainUX only when the application reports them through a monitored mechanism, such as the browser console.
Default monitoring
By default, GermainUX collects:
|
Event |
Default behavior |
|---|---|
|
Browser JavaScript errors |
Collected |
|
|
Collected |
|
Other console methods |
Not collected unless explicitly selected |
No configuration is required for the default behavior.
Continuous monitoring
GermainUX RUM JS or the GermainUX RUM Extension continuously captures JavaScript errors and configured console events during real user sessions.
Use:
-
RUM JS when the GermainUX monitoring script can be deployed directly in the application.
-
RUM Extension when direct script deployment is unavailable or the application’s security architecture prevents access to the required browser context.
The collected events are associated with the relevant user and session, enabling support and development teams to investigate the error in the context in which it occurred.
S
Code-level investigation with JS Profiler
When continuous monitoring identifies an error that requires deeper technical evidence, the GermainUX JS Profiler can help investigate:
-
JavaScript function execution.
-
Function duration.
-
Exclusive and cumulative execution time.
-
Long-running browser tasks.
-
JavaScript errors and stack traces.
-
Browser events and user interactions.
-
DOM and rendering activity.
-
Network requests and resource loading.
-
Application, page, and session context.
The JS Profiler complements RUM JS and the RUM Extension. Continuous monitoring can remain enabled across the user population, while deeper profiling should normally be limited to the applications, pages, users, sessions, or periods required for an investigation.
Business benefits
JavaScript Console and Error Monitoring helps organizations:
-
Detect front-end failures affecting real users.
-
Identify the users, sessions, pages, and workflows affected by each error.
-
Prioritize errors according to frequency and actual user or business impact.
-
Understand what users did before and after an error.
-
Reduce the time spent reproducing intermittent problems.
-
Distinguish isolated errors from widespread application failures.
-
Detect regressions introduced by new application releases.
-
Provide developers with actionable messages, stack traces, session evidence, and code-level diagnostics.
-
Validate that a correction eliminated or reduced the error.
Analytics
GermainUX can analyze JavaScript errors and console events through KPIs, measures, pivots, trends, drill-through views, and session context.
|
Analysis area |
Examples |
|---|---|
|
Error |
Message, error type, stack trace, or console method |
|
Impact |
Affected users, sessions, pages, and workflows |
|
Frequency |
Occurrence count, recurrence, concentration, and trend |
|
Environment |
Application, release, browser, operating system, and device |
|
User context |
Clicks, navigation, page activity, and Session Replay |
|
Technical context |
Network requests, long tasks, browser freezes, and related errors |
|
Code-level evidence |
JavaScript functions, execution time, DOM activity, and resources |
SGermainUX users can create watches to receive notifications when collected error insights meet conditions of interest.
Configuration
Configuration is required only when the default console-event collection needs to be customized.
Collect additional console methods
The following example collects informational messages, warnings, and errors:
const settings = germainApm.getDefaultSettings();

settings.plugins.console.methods = [
  "info",
  "warn",
  "error"
];

germainApm.start(settings);
Supported console methods include:
-
assert -
clear -
count -
countReset -
debug -
dir -
dirxml -
error -
group -
groupCollapsed -
groupEnd -
info -
log -
table -
time -
timeEnd -
timeLog -
timeStamp -
trace -
warn
Collect only the console methods required for the monitoring use case. Verbose methods such as log or debug can generate a substantial amount of data.
Disable console-event collection
To disable console-event collection, configure an empty methods array:
const settings = germainApm.getDefaultSettings();

settings.plugins.console.methods = [];

germainApm.start(settings);
This setting disables the configured console methods. Browser-error collection may be managed separately by the applicable monitoring profile.
Limit collected content
Console messages and stack traces can contain large amounts of text. Use maxLogStringLength to limit the amount of console content collected.
The following example collects informational messages, warnings, and errors while limiting each console value to 100 characters:
const settings = germainApm.getDefaultSettings();

settings.plugins.console = {
  methods: ["info", "warn", "error"],
  maxLogStringLength: 100
};

germainApm.start(settings);
The default maximum console-content length is 1,024 characters.
Select a limit that preserves useful diagnostic information while controlling data volume and reducing the risk of collecting unnecessary content.
Advanced filtering and processing
Use eventProcessor when application-specific logic is required to filter or modify a console event before GermainUX sends it.
eventProcessor?: (
  event: LogMonitoringEvent,
  fireEvent: (event: MonitoringEvent) => void,
  settings: MonitoringSettings
) => boolean;
The processor must return:
-
trueto send the processed event. -
falseto discard the event.
Use advanced processing to:
-
Exclude known non-actionable messages.
-
Remove or replace sensitive values.
-
Normalize dynamic error messages.
-
Categorize application-specific errors.
-
Reduce duplicate or excessively verbose events.
Privacy and data protection
Console messages, error text, stack traces, URLs, and related application context can contain sensitive information.
Before collecting additional console methods:
-
Review what the application writes to the browser console.
-
Avoid logging passwords, authentication tokens, payment data, personal information, or other secrets.
-
Limit console collection to the methods required.
-
Truncate unnecessarily long values.
-
Filter or sanitize sensitive content with
eventProcessor. -
Restrict access to detailed error and session information.
-
Apply the organization’s retention and compliance requirements.
Recommended investigation workflow
-
Use RUM JS or the RUM Extension to detect JavaScript errors affecting real users.
-
Determine the affected users, sessions, pages, browsers, and workflows.
-
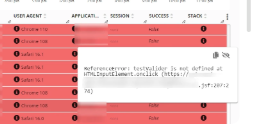
Review the error message, stack trace, and related session evidence.
-
Correlate the error with clicks, navigation, network requests, long tasks, freezes, and other available events.
-
Enable the JS Profiler for a controlled scope when deeper code-level evidence is required.
-
Identify the responsible function, script, resource, or dependency.
-
Implement the correction.
-
Validate the result using continuous error monitoring and, when necessary, another targeted profiling session.
Deployment and configuration
|
For your browser environment |
|---|
|
Review Browser Monitoring. |
|
Review the Browser Monitoring Deployment Overview. |
|
Deploy GermainUX RUM JS when the monitoring script can be added to the application. |
|
Deploy the GermainUX RUM Extension when direct script deployment is unavailable or access to the complete browser-page context requires an extension. |
|
Deploy the GermainUX JS Profiler for deeper JavaScript execution and code-level diagnostics. |
|
Review the available Browser Monitoring configuration. |
|
Review the KPIs for User Monitoring and Replay. |
|
Review the available Browser Monitoring KPIs. |
ℹ️ Get Help
The Germain Team can help you set this up. Contact GermainUX Support.
Component: JS Profiler, RUM JS, RUM Extension
Feature Availability: 2022.1 or later
Browser Support: only latest Chrome, Edge and Opera