
📊 Conversion Insights
GermainUX helps organizations increase digital conversion by identifying where customers abandon, what friction affects their journeys, how much business is impacted, and which improvements should be prioritized.
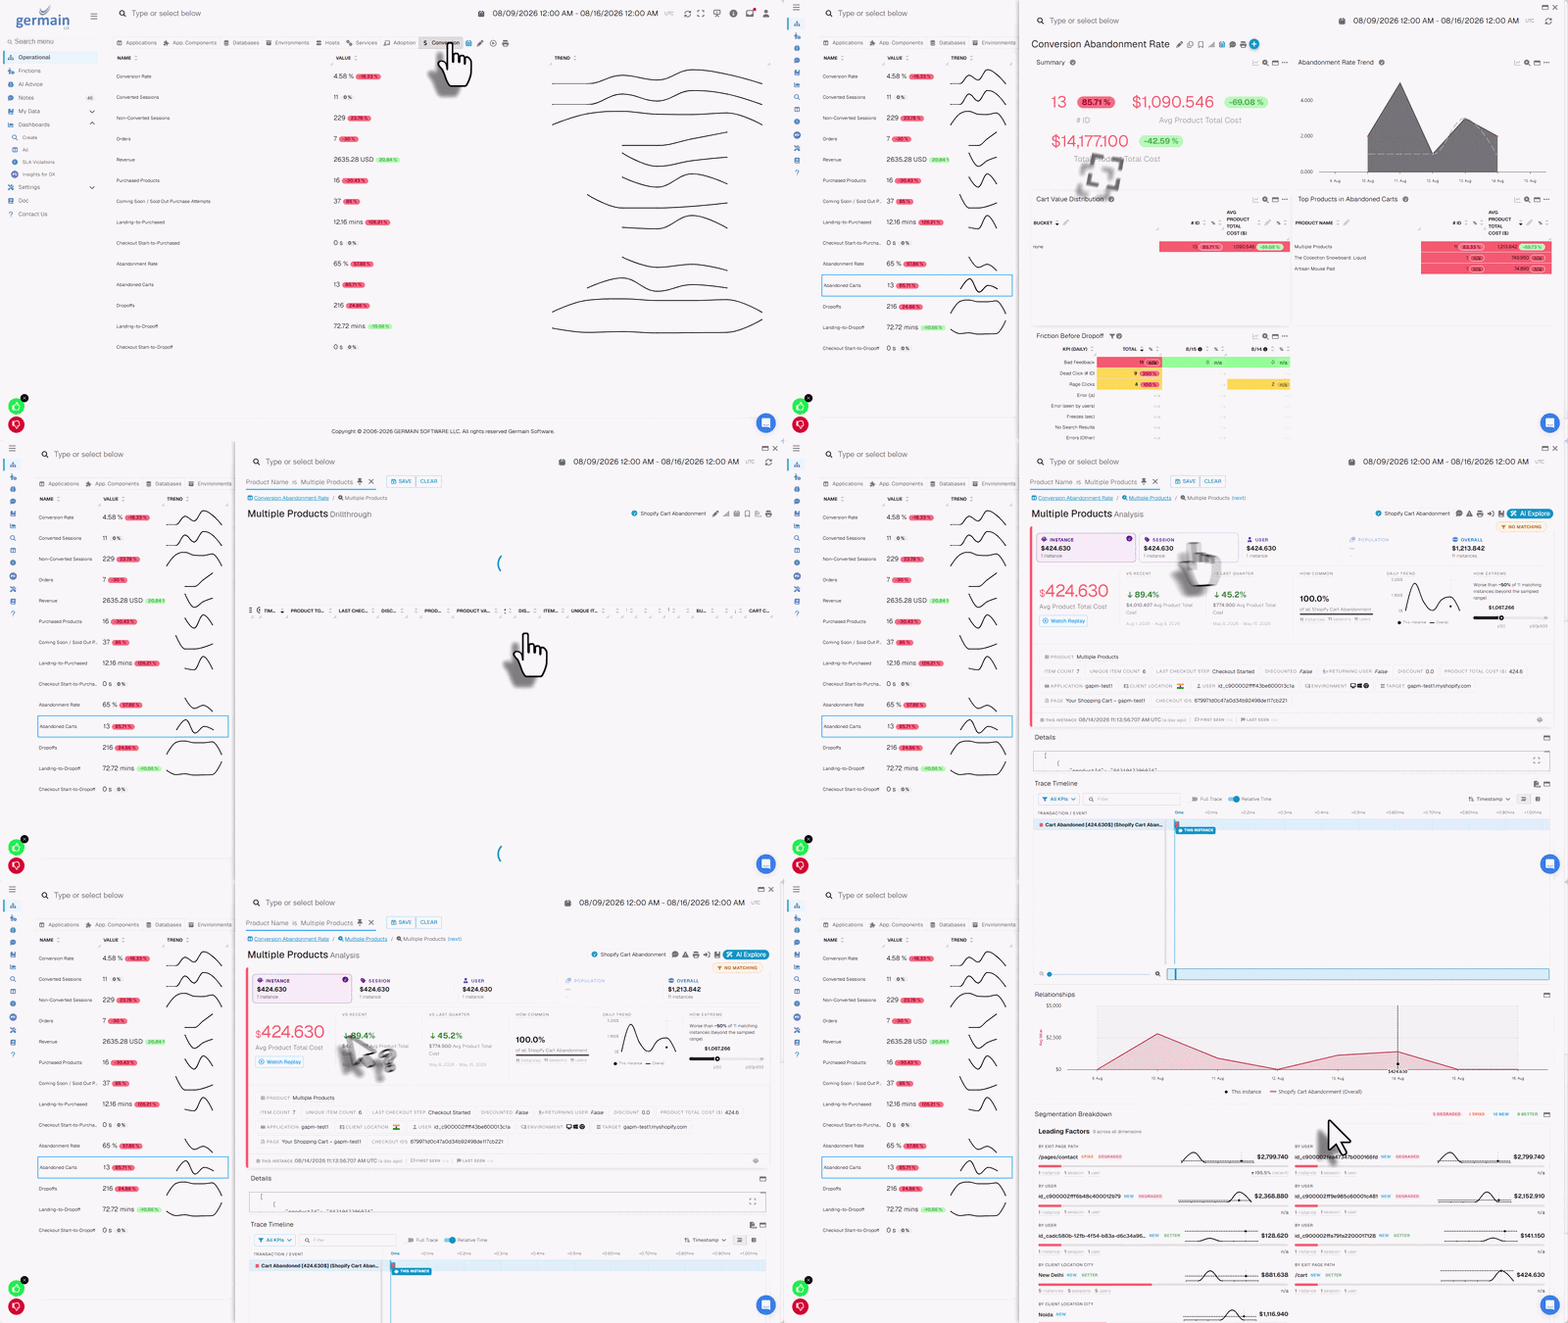
❓ Key Connections
It connects conversion outcomes, customer behavior, business journeys, application performance, errors, feedback, Session Replay, and AI to answer questions such as:
|
Question |
|---|
|
What is our current conversion rate? |
|
Where are customers abandoning? |
|
Which products, journeys, pages, devices, regions, or customer segments are most affected? |
|
What friction occurs before customers fail to convert? |
|
Which factors have the greatest effect on conversion? |
|
How many customers and transactions are affected? |
|
How much revenue or business opportunity is potentially being lost? |
|
What should we improve first? |
This allows conversion, eCommerce, marketing, product, UX, operations, and engineering teams to work from the same evidence.
⏱️ Real-Time Conversion Monitoring
GermainUX continuously monitors conversion and the customer journeys that lead to successful or unsuccessful outcomes.
Depending on your business and configuration, this can include:
|
Metric |
|---|
|
Conversion rate |
|
Completed and abandoned journeys |
|
Cart abandonment |
|
Checkout abandonment |
|
Revenue |
|
Potential revenue loss |
|
Average order value |
|
Product performance |
|
Journey-step completion |
|
Conversion time |
|
Errors and failed transactions |
|
Searches with no results |
|
Repeated actions and rage clicks |
|
Application and page performance |
|
Customer feedback |
Conversion can be analyzed across any collected business or technical dimension, including product, customer segment, journey step, page, campaign, traffic source, geography, device, browser, or application version.
📊 Check the Conversion Tab for Real-Time Insights
For an immediate view of conversion performance, open the Conversion tab in the GermainUX Operational Dashboard.
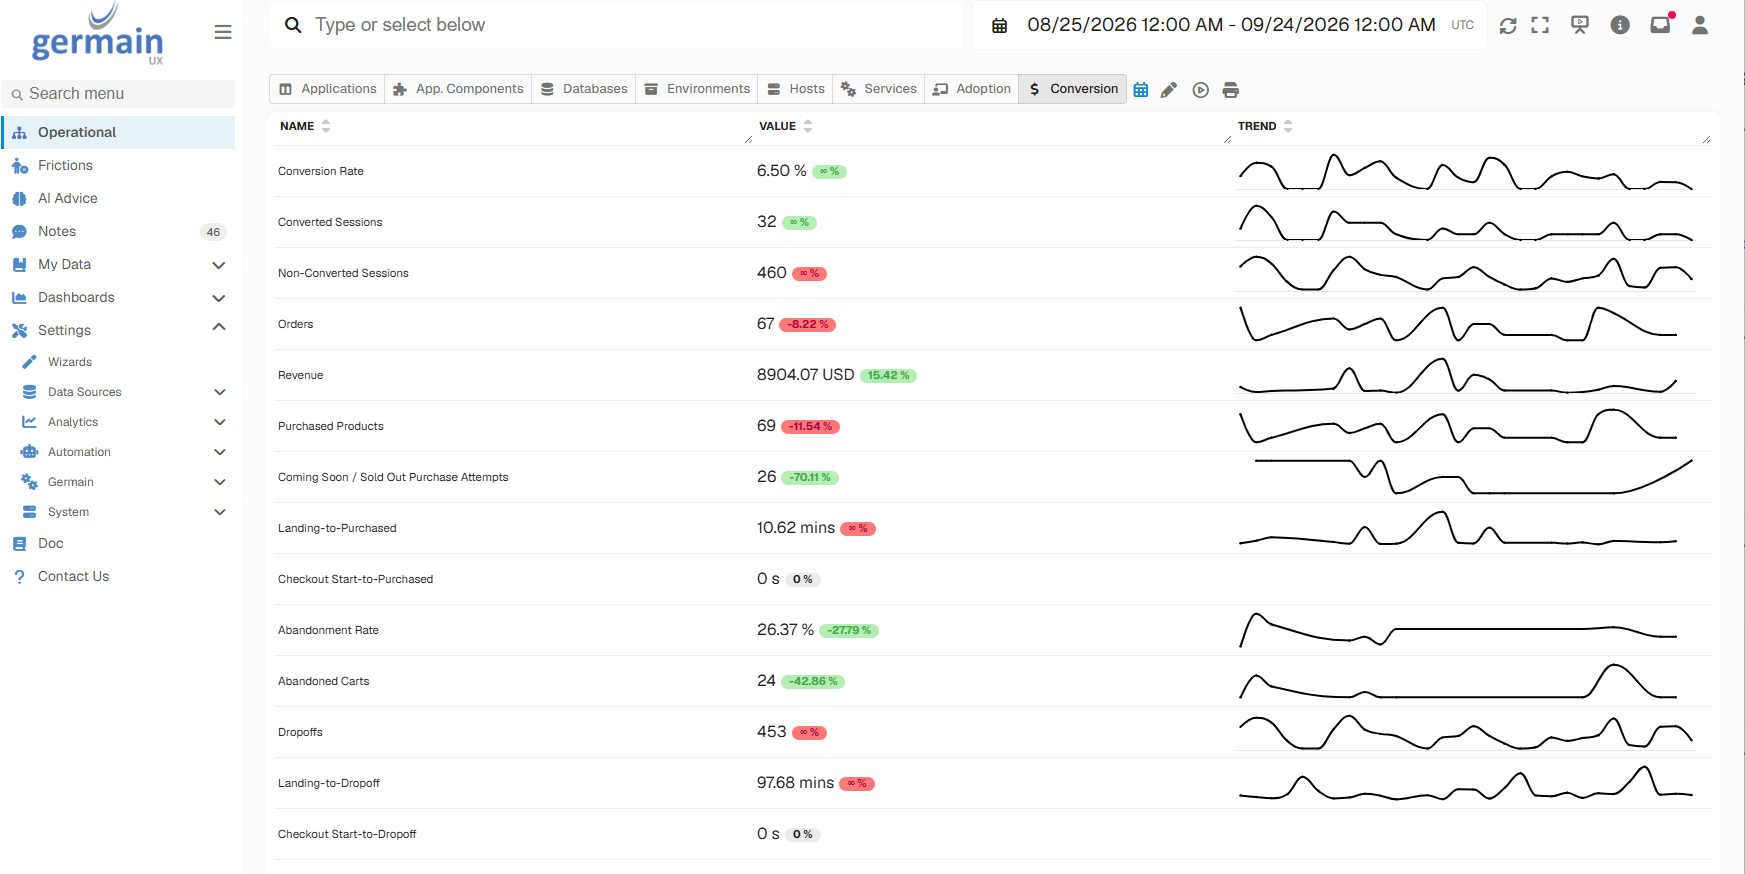
The Conversion tab continuously brings together the most important conversion signals so you can quickly see:
-
Conversion rate and successful conversions
-
Where visitors abandon their journey
-
Which conversion frictions are affecting visitors
-
Which journey or funnel steps are losing visitors
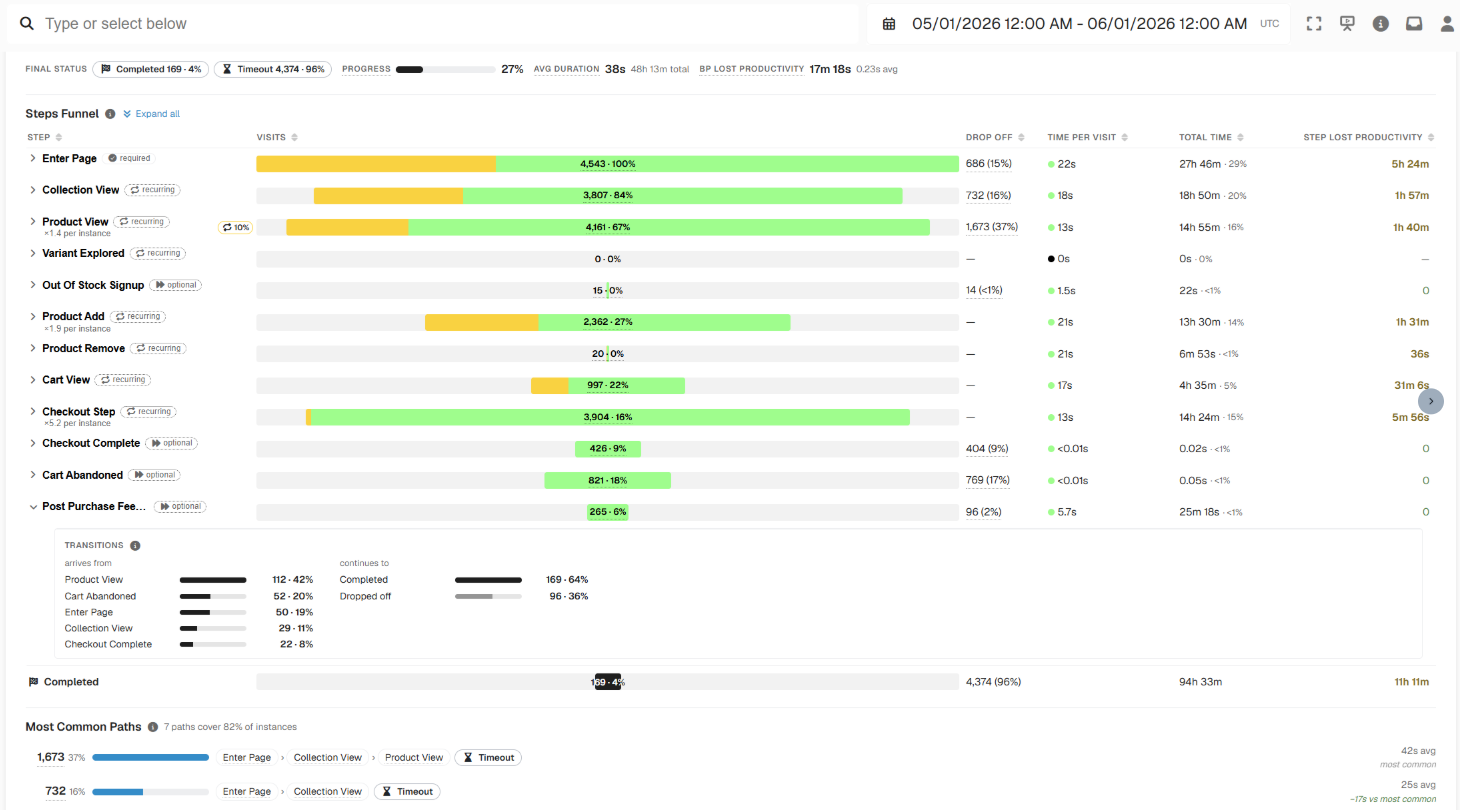
-
Which errors or performance issues may be affecting conversion
-
Which visitors, products, pages, devices, or other populations are most affected
-
The potential business impact of detected issues
-
Whether conversion is improving or declining over time
When something requires further investigation, drill into the underlying KPI to identify the affected population and understand why:
Conversion → Friction → Affected Population → Analysis → Session Replay → Likely Contributing Factors
Use the Conversion tab for real-time operational insights, then drill into GermainUX Analytics when you need to understand the underlying cause.
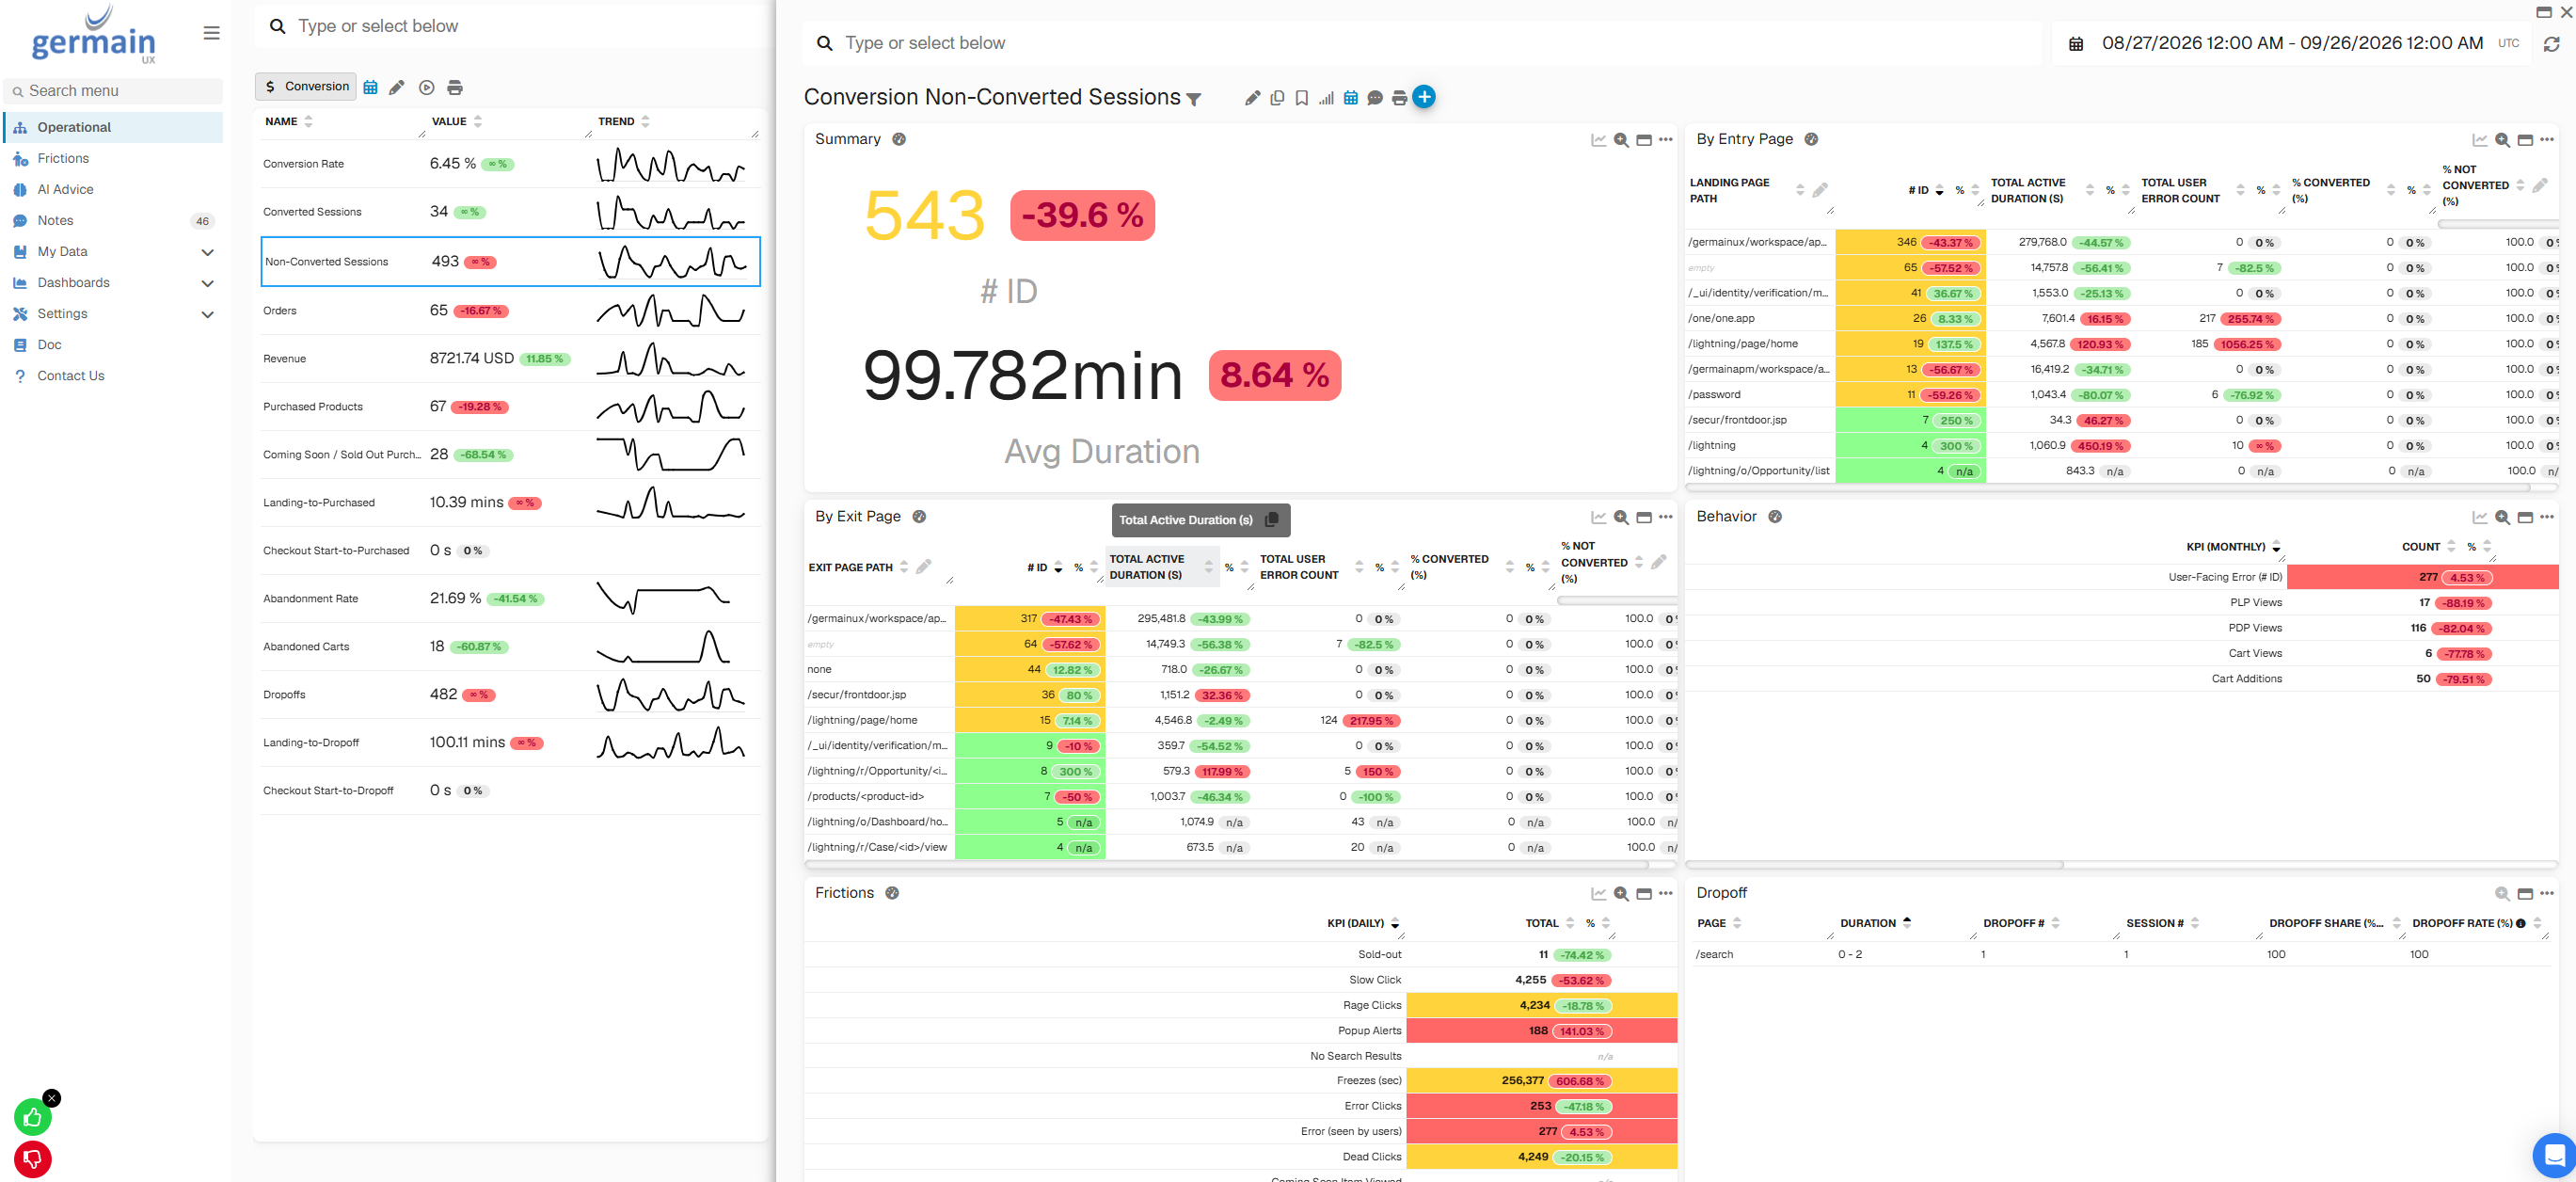
📊 Conversion Analysis
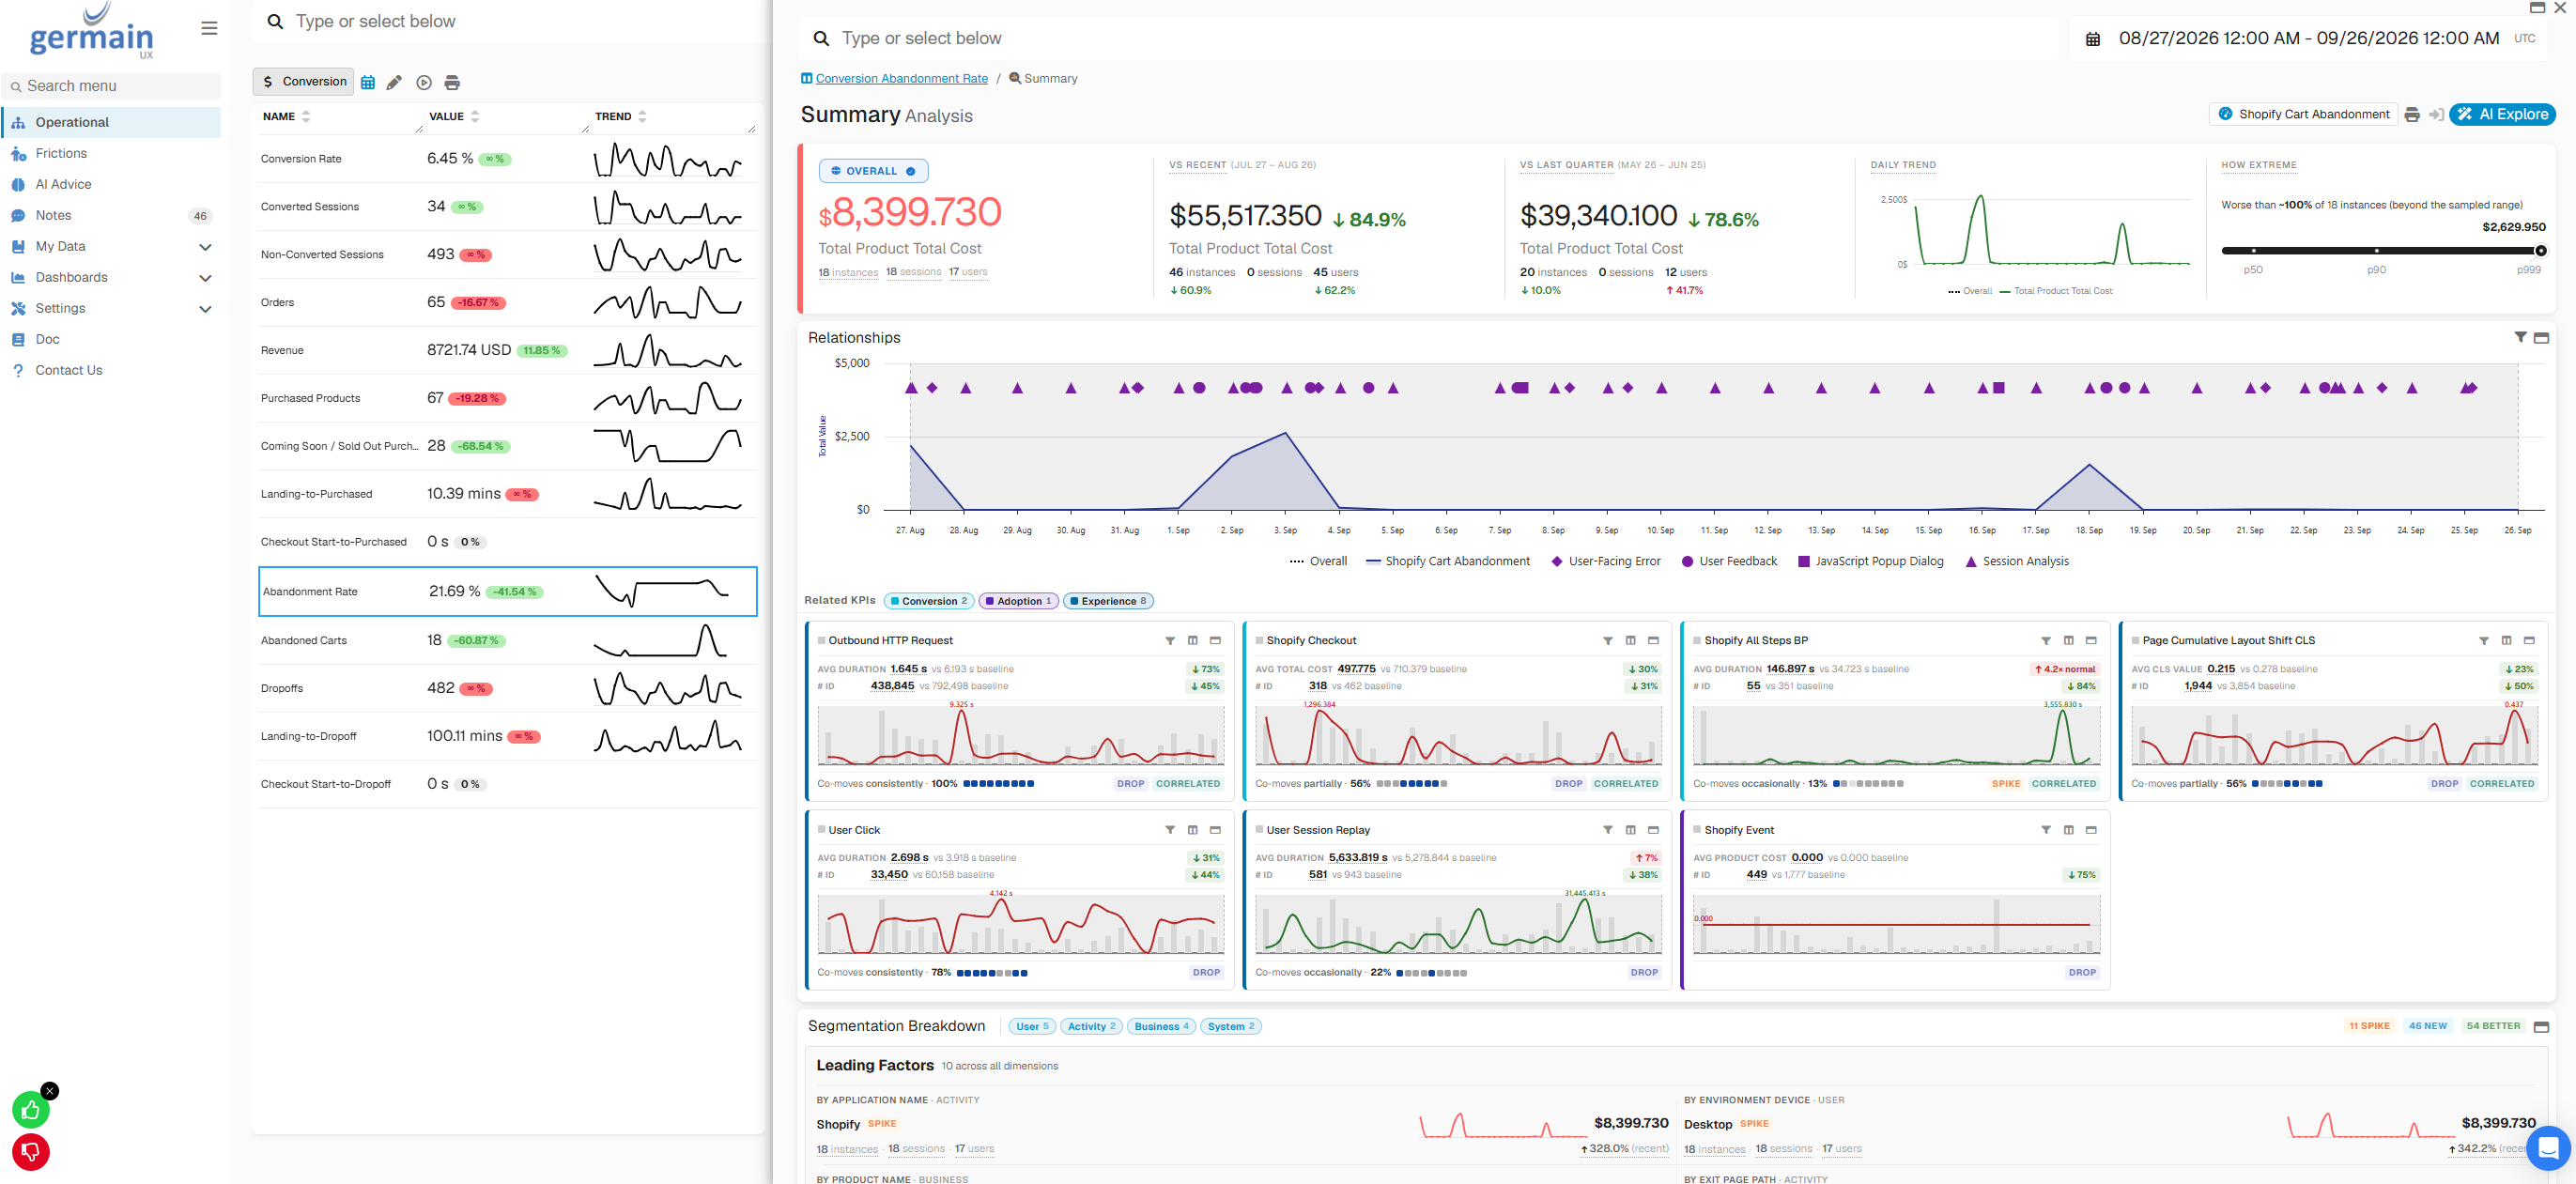
The GermainUX Analysis Dashboard helps teams move from a change in conversion to the factors most likely to explain it.
Abandonned Cart Analysis:
Purchase workflow analysis:
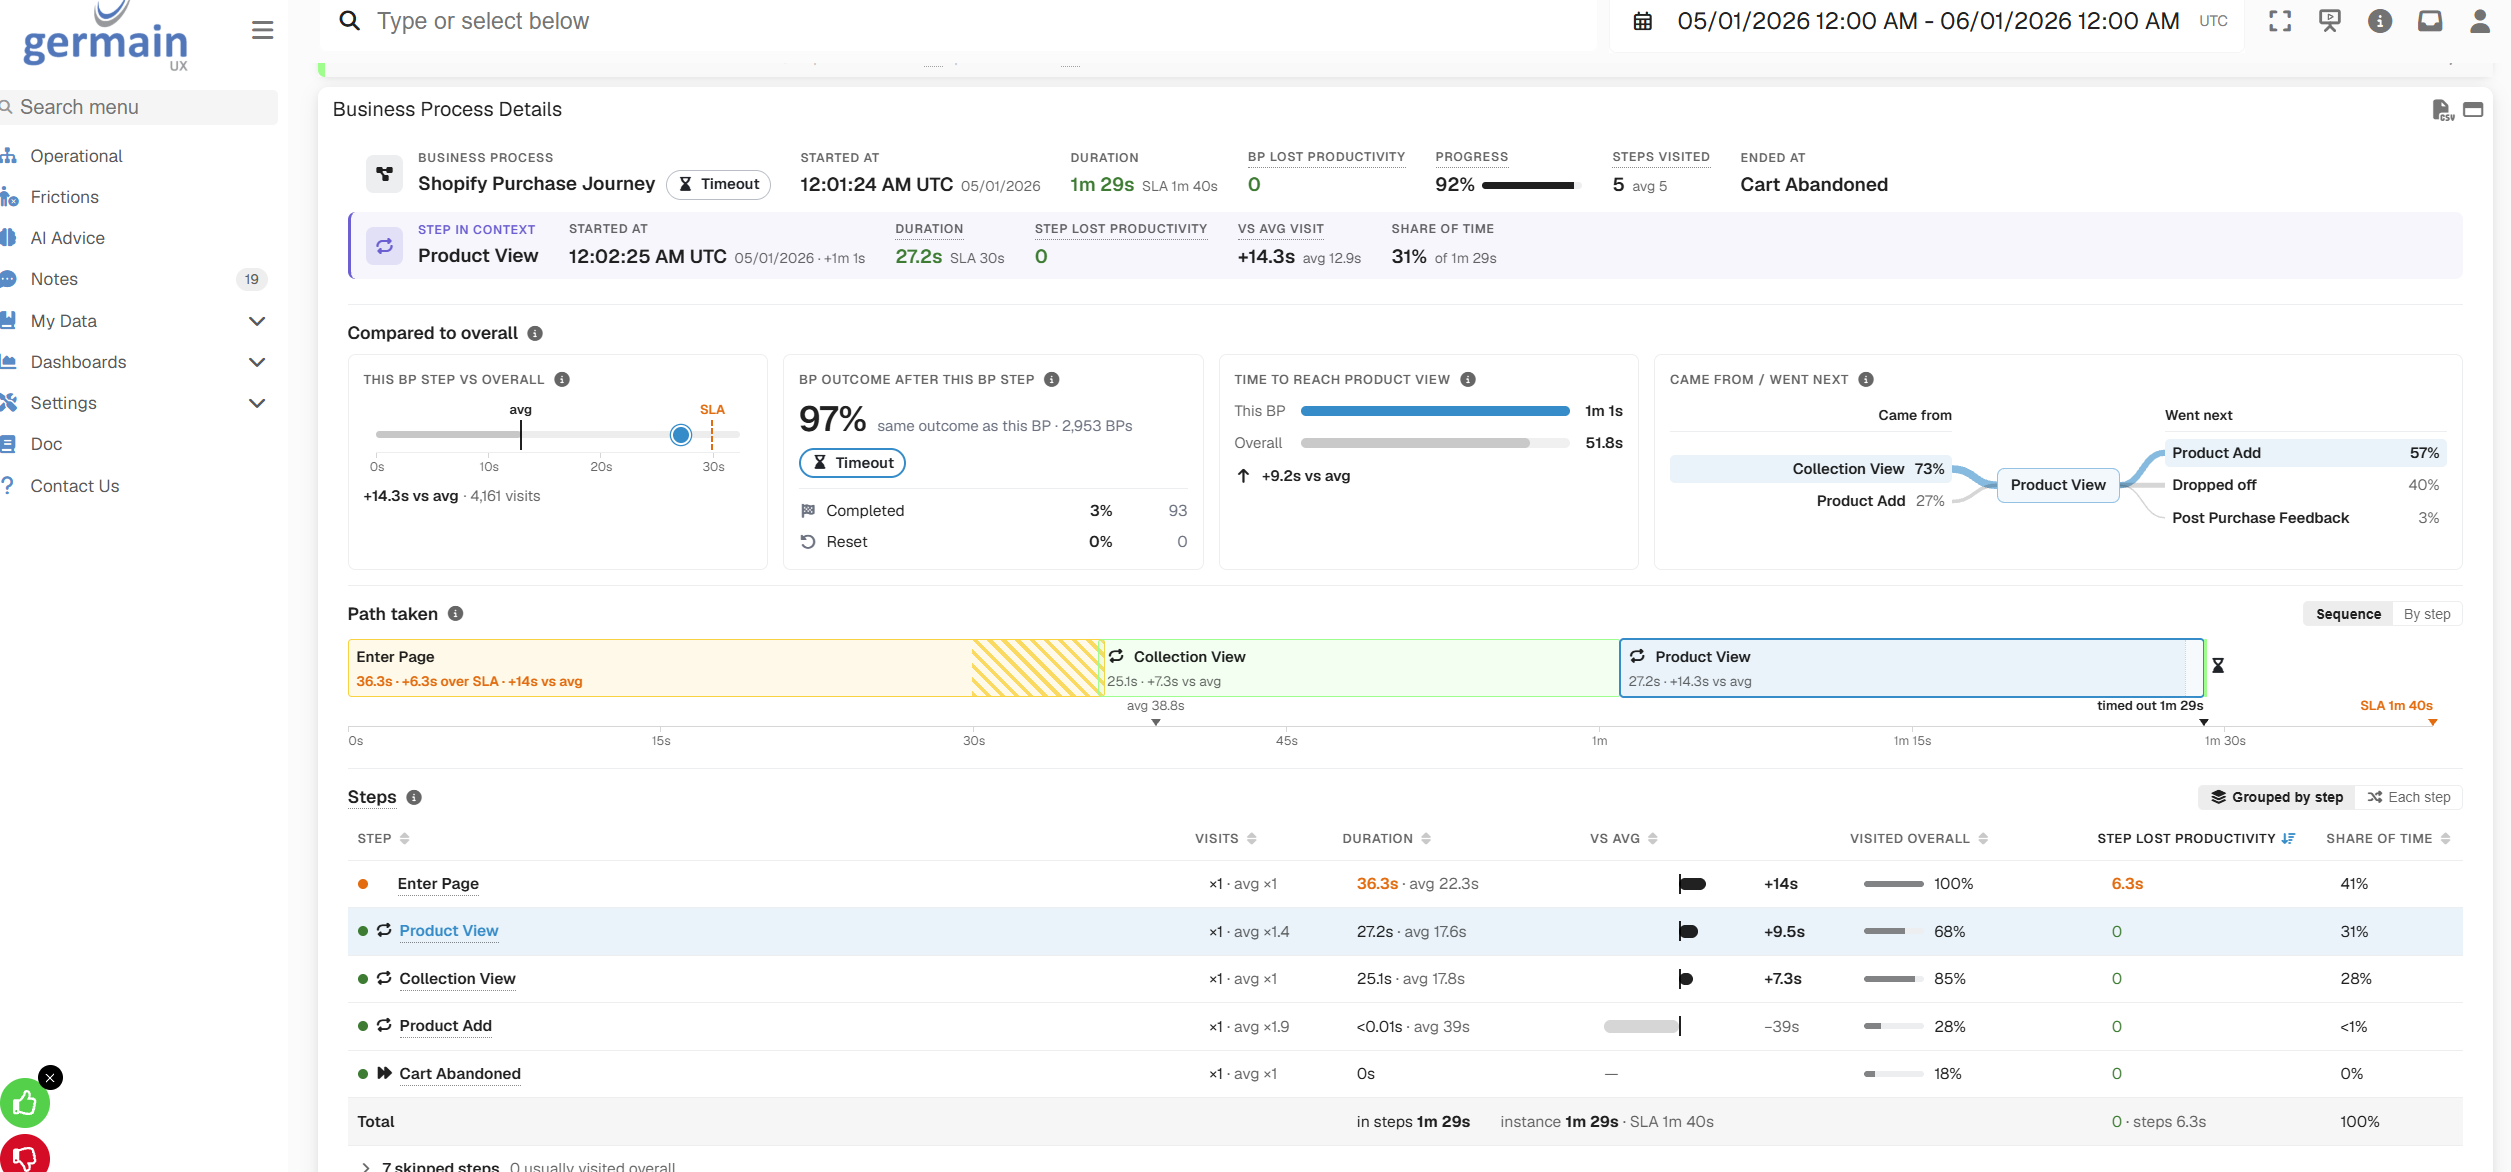
For a selected conversion KPI, Analysis can help determine:
|
Analysis Question |
|---|
|
Whether the change is abnormal |
|
When the change started |
|
Which populations are most affected |
|
Which journey steps are affected |
|
Which related KPIs changed |
|
Which frictions are associated with the conversion outcome |
|
Which errors or performance issues are related |
|
Which customer sessions provide supporting evidence |
|
What business impact is associated with the issue |
✨ Leading Factors
Leading Factors identify the dimensions, behaviors, frictions, errors, or other monitored conditions most strongly associated with a conversion outcome.
With the ability to group Leading Factors by:
|
Group |
Definition |
|---|---|
|
User |
Identifies who the user is and the device/environment they are using. |
|
Activity |
Identifies what the user is doing and where they are doing it within the application. |
|
Traffic Source |
Identifies where the user or session originated from, including campaigns and referrals. |
|
Business |
Identifies the business context associated with the activity, such as products, entities, or business objects. |
|
Outcome |
Identifies the result of the activity, such as success, conversion, abandonment, error, or severity. |
|
System |
Identifies the technical systems, components, and infrastructure involved in the activity. |
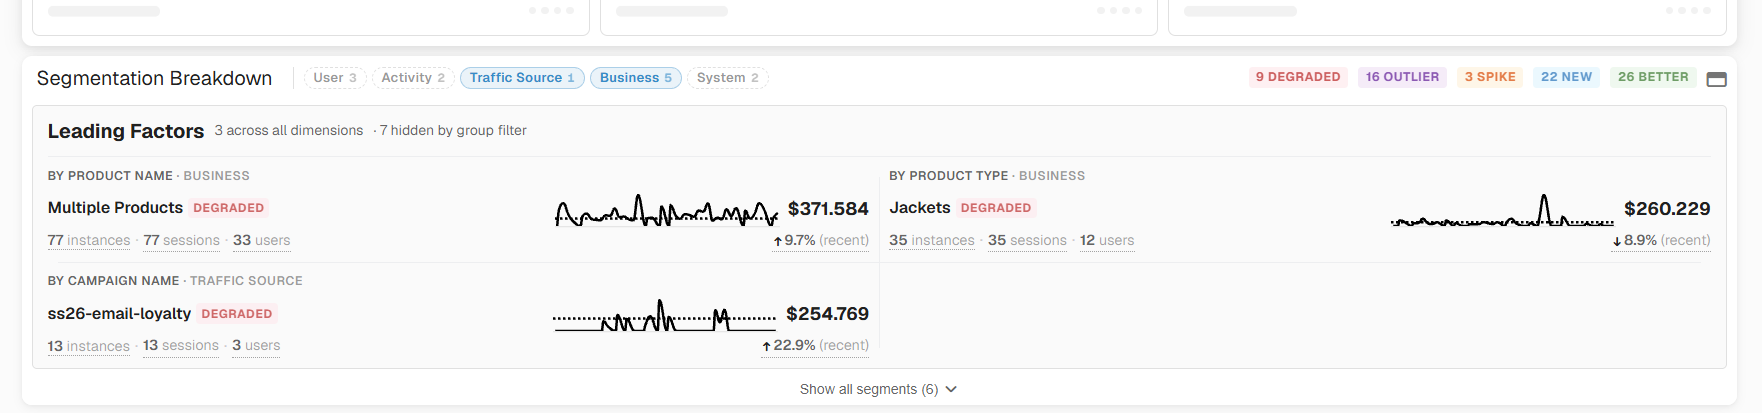
For example, GermainUX may identify that customers experiencing:
|
Condition |
|---|
|
A payment error |
|
Slow checkout performance |
|
A search with no results |
|
Repeated clicks |
|
A particular journey path |
|
A specific product or device combination |
convert at a significantly different rate from the overall population.
Leading Factors help answer:
What is most likely contributing to the conversion outcome, and where should we investigate first?
Factors can then be evaluated using:
|
Evaluation |
|---|
|
Conversion effect |
|
Number of affected customers or sessions |
|
Frequency of the friction |
|
Lost conversions |
|
Potential revenue impact |
|
Supporting sessions and technical evidence |
This helps prevent teams from prioritizing an issue simply because it occurs frequently. A lower-volume friction with a strong negative conversion effect may have greater business impact than a high-volume friction with little effect on conversion.
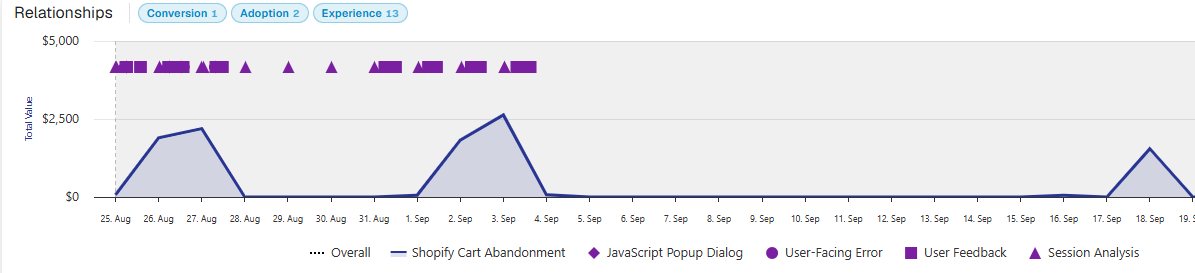
🔍 Understand Why Customers Do Not Convert
Once an important factor is identified, GermainUX provides multiple ways to investigate it.
👣 Behavior and Journeys
Analyze the paths customers take before converting or abandoning.
Identify:
|
Investigation |
|---|
|
Successful versus unsuccessful journeys |
|
Repeated or unnecessary steps |
|
Unexpected navigation |
|
Customer hesitation |
|
Journey drop-offs |
|
Behavioral differences between converting and non-converting customers |
Buyer Flow Analyzer and Friction Impact
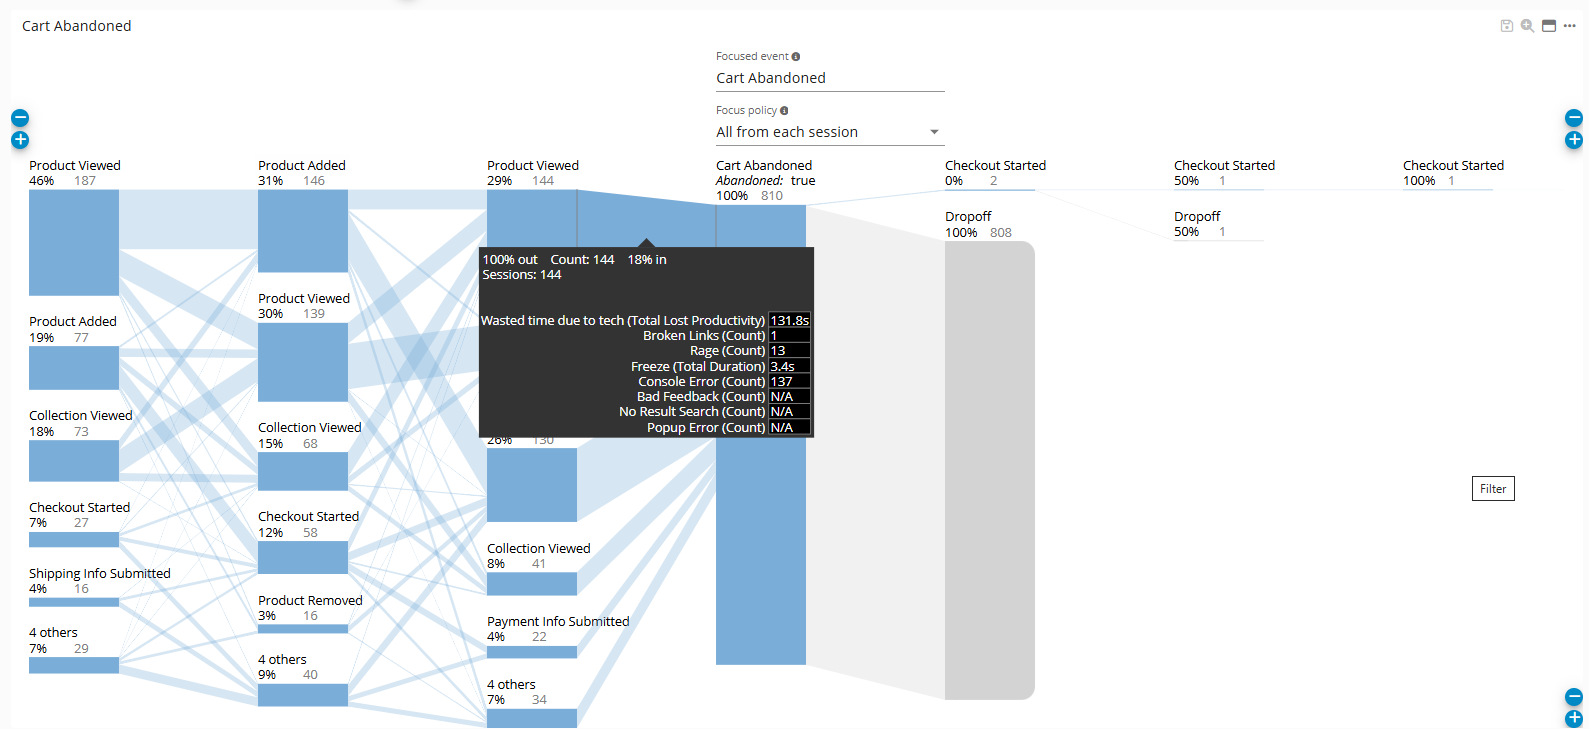
Most common paths to conversion or drop-off:

See Behavior Analysis, Journey Analysis, and Drop-Off Analysis.
🔧 Errors and Performance
Determine whether application errors, failed transactions, integrations, or performance issues contribute to unsuccessful journeys.
GermainUX can connect conversion outcomes with the underlying technical evidence required to investigate the cause.
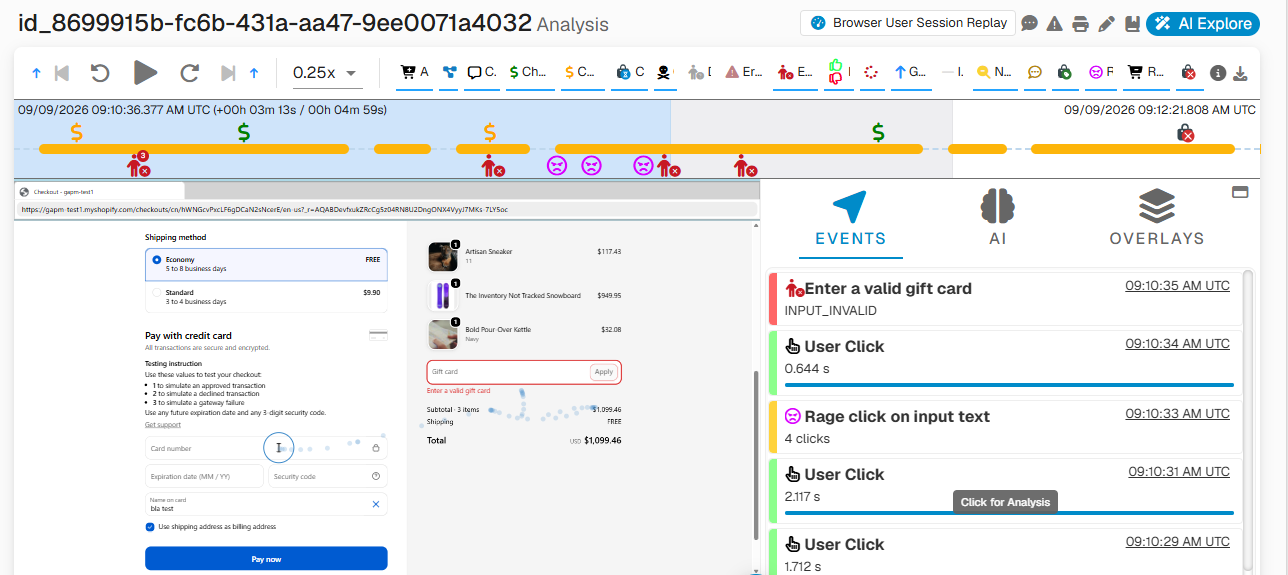
🎥 Session Replay and Heatmaps
Use Session Replay to see what individual customers experienced before converting or abandoning.
Heatmaps provide an aggregated view of customer behavior to determine whether the same friction occurs across a larger population.
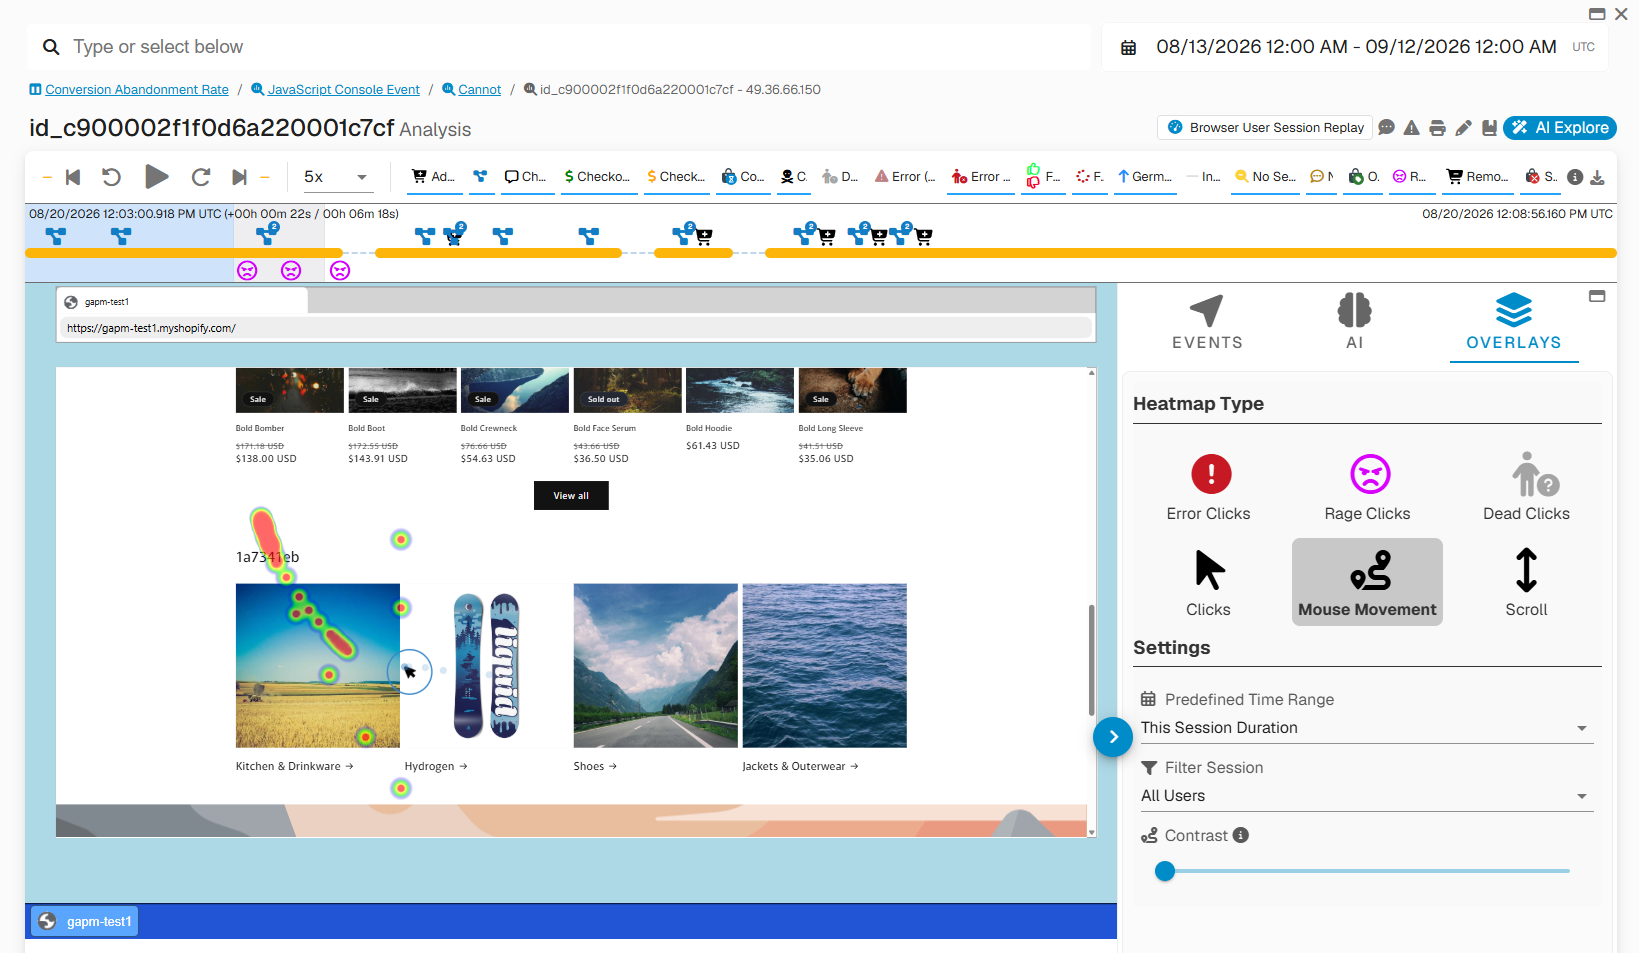
See User Session Monitoring, Replay & Heatmaps.
⏳ Conversion Time
GermainUX can measure how long customers take to complete a conversion journey.
For example:
Landing → Product View → Add to Cart → Checkout → Payment → Confirmation
Analysis can identify:
|
Timing Metric |
|---|
|
Total conversion time |
|
Time spent at each stage |
|
Delays between stages |
|
Repeated actions |
|
Idle time |
|
Differences between converting and abandoning customers |
|
Journey stages creating the greatest delay |
Long or inconsistent conversion times can reveal excessive effort, confusing workflows, or technology performance issues affecting conversion.

🧠 AI-Driven Conversion Insights
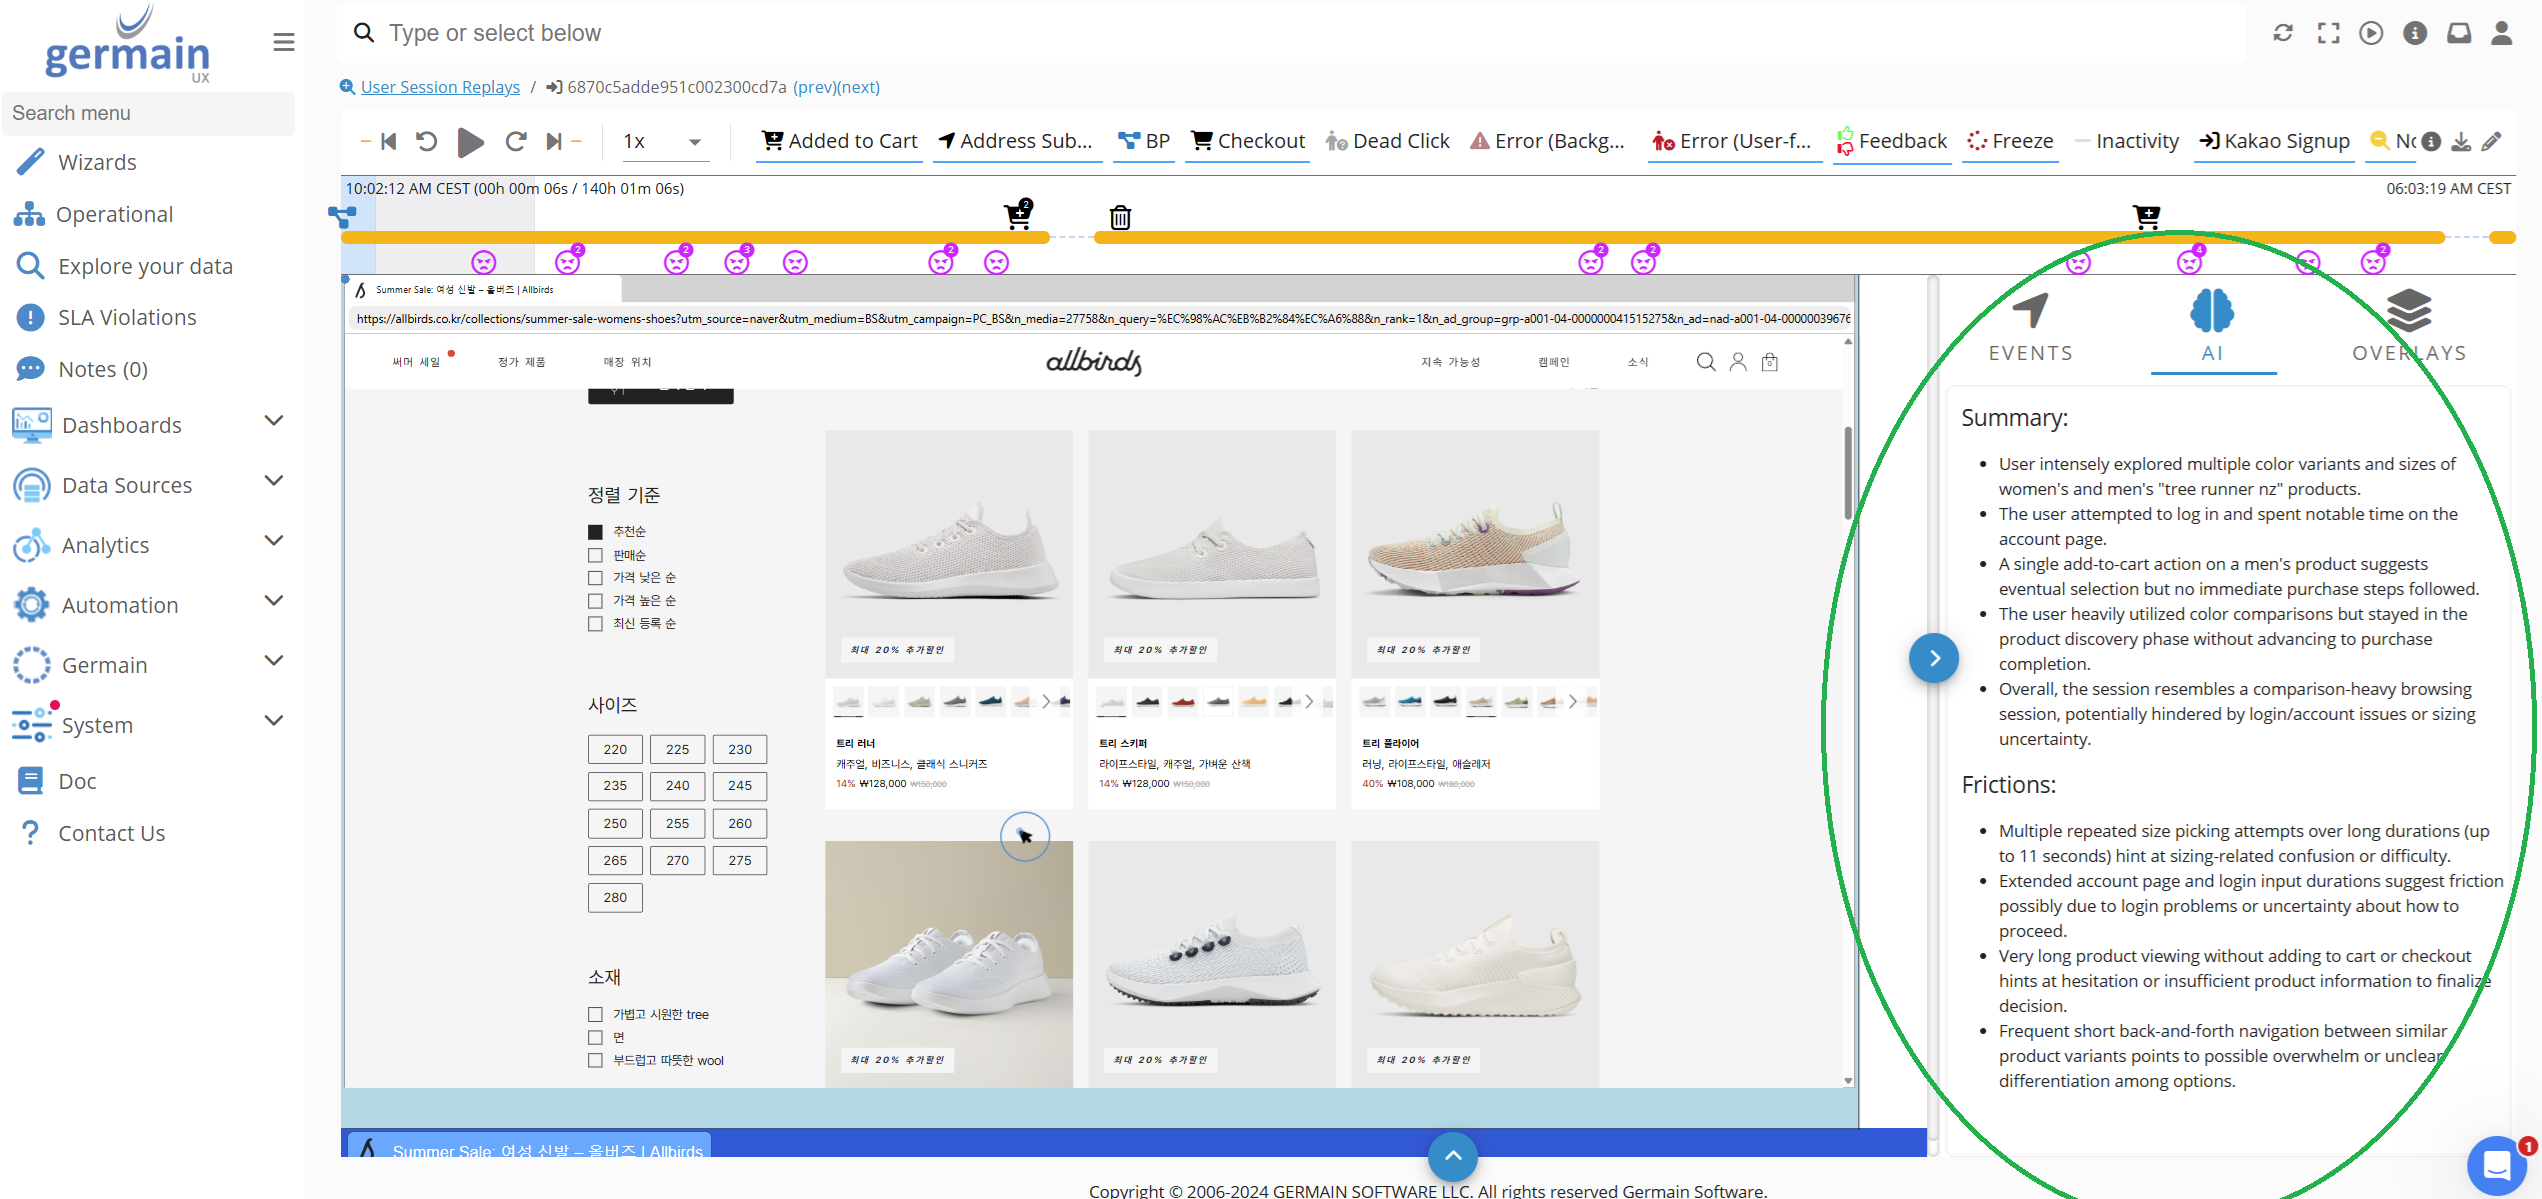
GermainUX AI can analyze conversion data, journeys, errors, feedback, and customer sessions to help explain why customers convert or abandon.
AI can help:
|
AI Capability |
|---|
|
Summarize conversion issues |
|
Identify recurring abandonment patterns |
|
Analyze friction across many sessions |
|
Explain differences between successful and unsuccessful journeys |
|
Identify affected products or customer segments |
|
Surface likely contributing factors |
|
Recommend potential improvements |
|
Prioritize recommendations according to business impact |
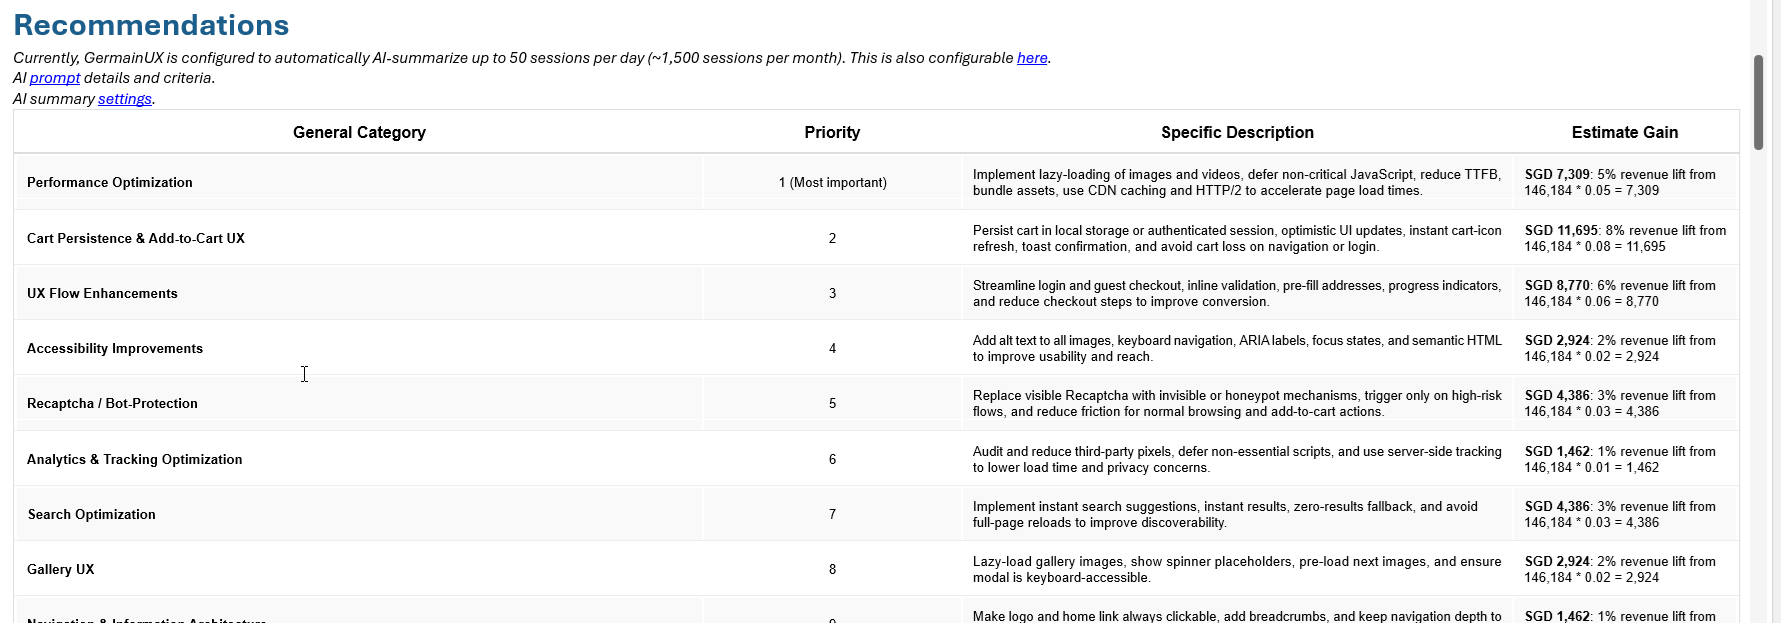
AI-generated findings remain connected to the underlying GermainUX evidence so teams can investigate and validate them.
AI summary of a Visitor Session:
💸 Quantify Business Impact
GermainUX connects conversion friction with measurable business impact.
Depending on the available data, impact can include:
|
Impact Metric |
|---|
|
Affected customers |
|
Affected sessions |
|
Lost conversions |
|
Abandoned carts |
|
Lost or at-risk revenue |
|
Average order value |
|
Product value |
|
Percentage of the population affected |
|
Conversion effect |
This helps teams prioritize improvements based on business impact rather than friction volume alone.
For example, an issue affecting thousands of sessions but having almost no effect on conversion may be less important than a checkout failure affecting fewer customers but causing a significant reduction in completed purchases.
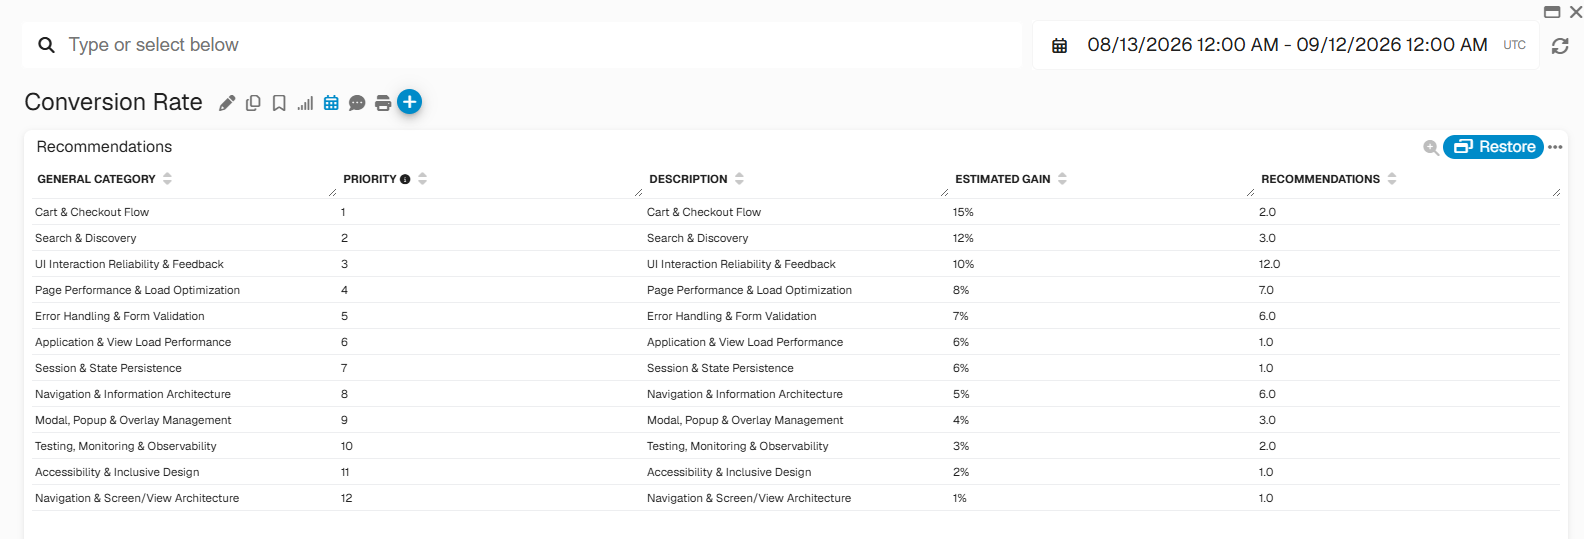
AI Ranking & Estimated Gain Across All Visitors:
📄 Automated Conversion Reports
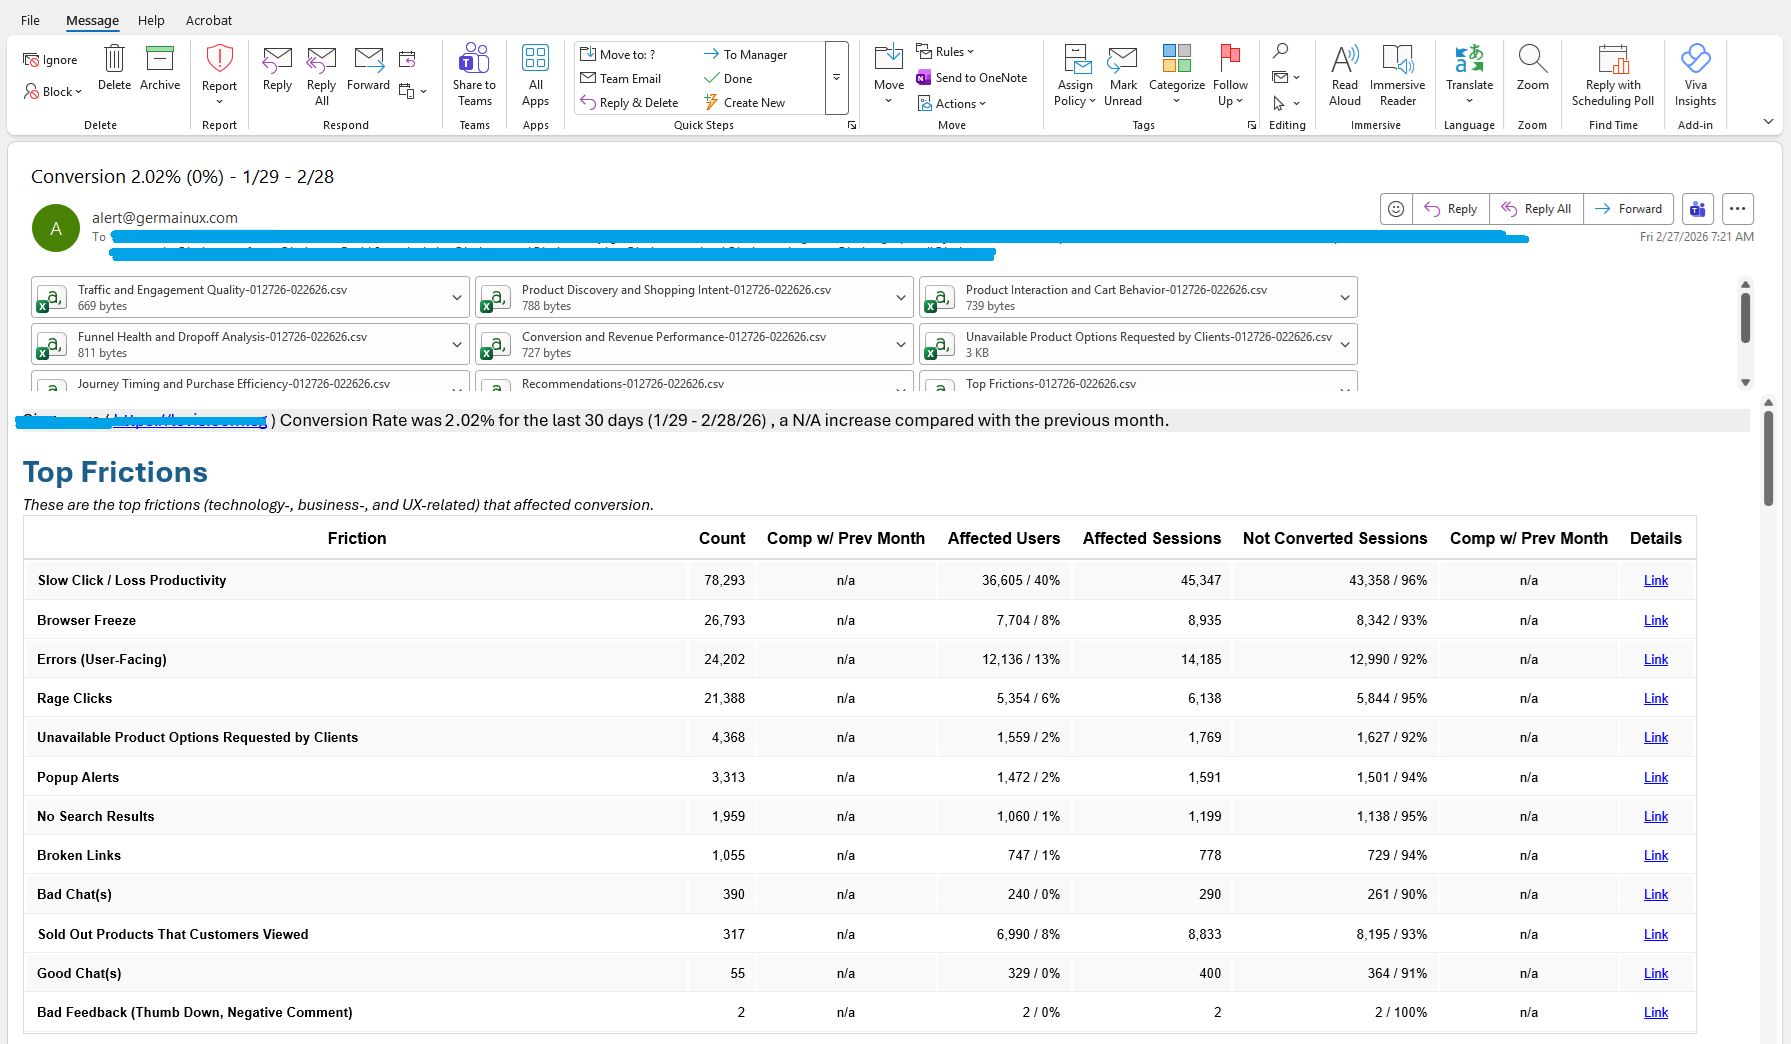
Conversion insights can be automatically delivered to the appropriate teams through configurable reports.
Reports can include:
|
Report Item |
|---|
|
Conversion trends |
|
Revenue and potential revenue loss |
|
Journey completion and abandonment |
|
Conversion time |
|
Leading Factors |
|
Top conversion frictions |
|
Affected customers and sessions |
|
Supporting evidence |
|
AI-generated findings |
|
Prioritized recommendations |
|
Quantified business impact |
Reports can be configured for conversion, eCommerce, marketing, product, UX, operations, engineering, or executive audiences.
🔁 From Conversion Issue to Improvement
GermainUX provides a continuous approach to improving conversion:
|
Step |
Description |
|---|---|
|
Observe |
Monitor conversion and customer journeys in real time. |
|
Analyze |
Identify Leading Factors, affected populations, friction, and likely causes. |
|
Prioritize |
Determine which improvements have the greatest potential business impact. |
|
Act |
Improve the UX, workflow, content, marketing, or underlying technology. |
|
Validate |
Measure whether conversion improves after the change. |
Observe → Analyze → Prioritize → Act → Validate
📚 Related Documentation
-
Behavior Analysis
-
Business Process and Workflow Mining
-
Drop-Off Analysis
-
JourneyAnalysis
-
User Session Monitoring, Replay & Heatmaps
-
AI-Driven Insights & Recommendations
ℹ️ Get Help
The Germain Team can help you set this up. Contact GermainUX Support.
Service: Analytics
Feature Availability: 2026.2 or later