
⚙️ Configure Apex Code Monitoring for Salesforce
GermainUX monitors Salesforce Apex classes, triggers, source code, and test-coverage statistics.
🤝 This helps development and operations teams:
-
Maintain an inventory of Apex classes and triggers
-
Review Apex source code from GermainUX
-
Track test coverage
-
Identify untested or insufficiently tested code
-
Detect code and coverage changes over time
-
Correlate Apex code information with related Salesforce issues
-
Review supporting evidence during root-cause analysis
Apex Code Monitoring is performed by the GermainUX Engine and is enabled automatically when Salesforce monitoring is deployed through the Salesforce Application wizard.
This feature collects Apex code metadata and test-coverage information on a schedule. For runtime exceptions, debug logs, or transaction-level performance, also configure the corresponding Salesforce monitoring features.
📋 Prerequisites
Before configuring Apex Code Monitoring, confirm that:
-
A GermainUX Engine is deployed and running.
-
Salesforce monitoring has been deployed through the GermainUX Salesforce Application wizard.
-
The Salesforce OAuth connection is active.
-
The integration user can access the required Apex metadata and test-coverage information.
-
The selected GermainUX Engine can reach the Salesforce APIs.
-
The Salesforce organization has sufficient API capacity for the configured collection frequency.
For the initial integration, see Deploy GermainUX for Salesforce.
🚀 Enable Apex Code Monitoring
Apex Code Monitoring is enabled automatically during the initial Salesforce Application wizard deployment.
To deploy it:
-
Open GermainUX Workspace.
-
Open the left navigation menu.
-
Select Wizards.
-
Select Salesforce Application.
-
Choose the GermainUX Engine that will monitor Salesforce.
-
Enter the Salesforce connection and authentication settings.
-
Expand Show Advanced if you need to customize the collection interval.
-
Set Code Monitoring Interval.
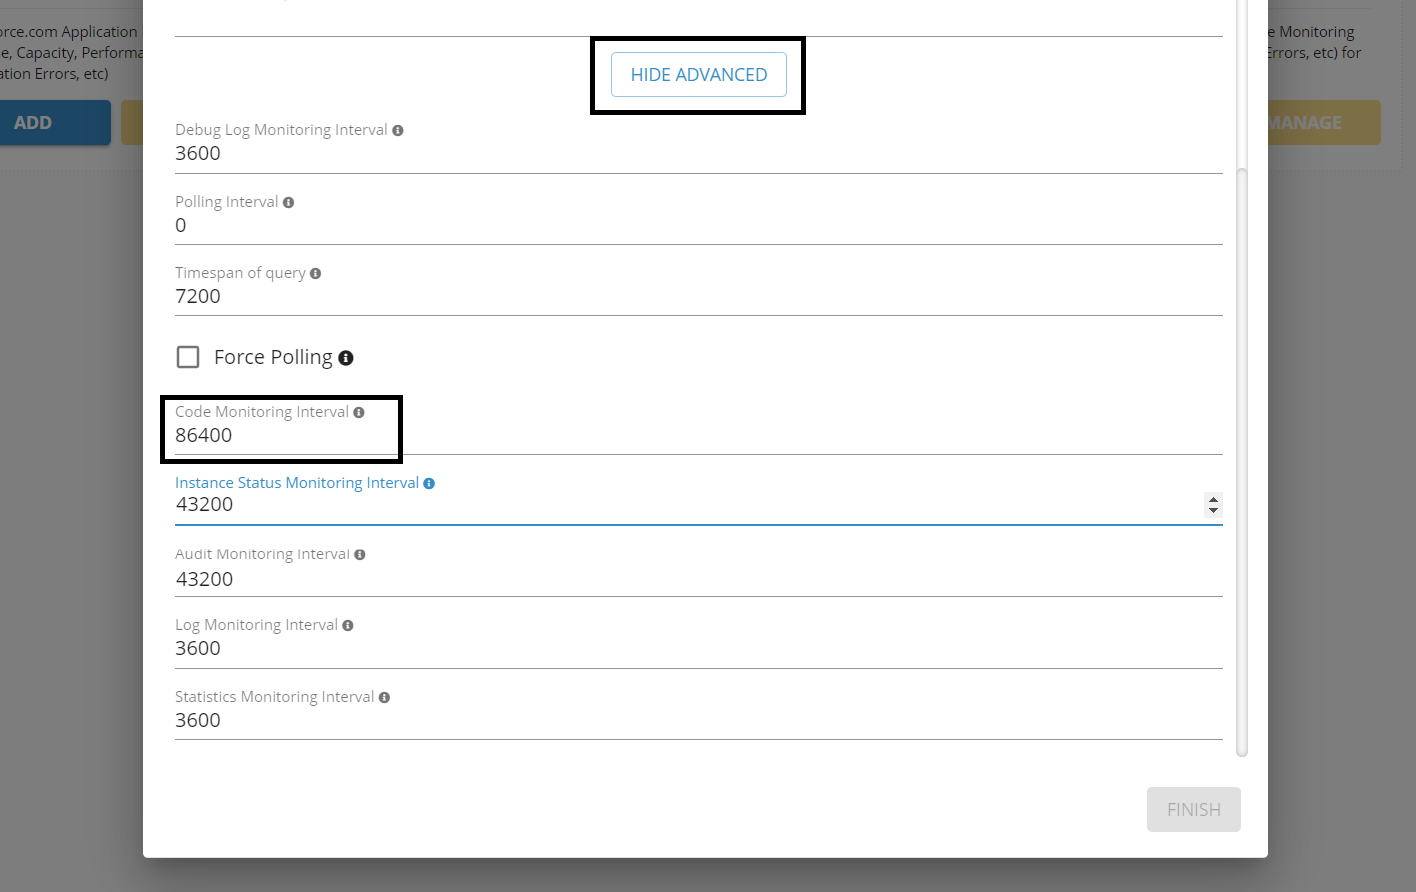
Code Monitoring Interval settings- Germain UX -
Complete the wizard.
The wizard creates a component with this type:
Salesforce Code Monitor
📅 Default Collection Frequency
By default, Apex Code Monitoring runs once per day.
Daily collection is appropriate for most environments because Apex source and test-coverage information usually changes only when code is deployed or tests run.
Use a more frequent schedule only when the additional freshness justifies the increased Salesforce API usage and GermainUX processing.
🔧 Configure the Frequency During Initial Deployment
When running the Salesforce Application wizard:
-
Select Show Advanced.
-
Locate Code Monitoring Interval.
-
Enter the required execution frequency.
-
Complete the wizard.
The configured interval determines how often GermainUX refreshes Apex class, trigger, and test-coverage information.
🔁 Change the Frequency After Deployment
To modify the schedule of an existing monitor:
-
Open GermainUX Workspace.
-
Open the left navigation menu.
-
Select Germain.
-
Open the State tab.
-
Search for:
Type Name = Salesforce Code Monitor -
Select the applicable monitor.
-
Update Execution Schedule.
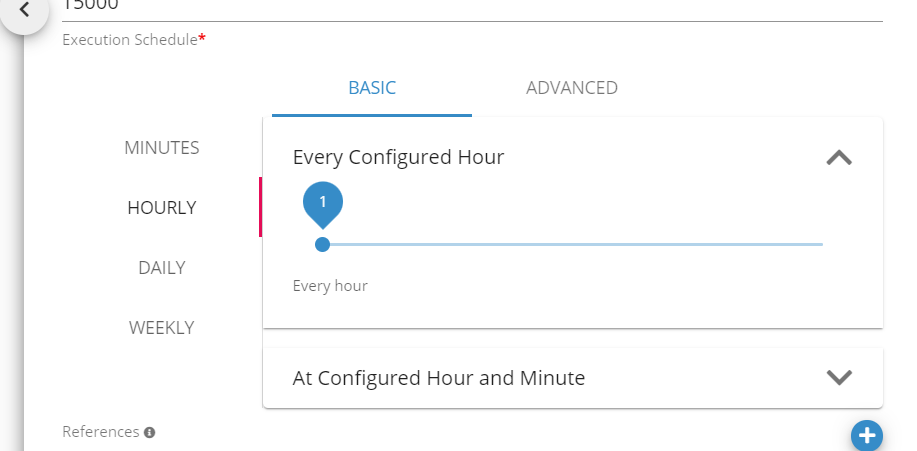
-
Save the change.
Confirm that the schedule is appropriate for the Salesforce organization’s deployment cadence and API limits.
⛔ Disable Apex Code Monitoring
To stop ongoing Apex code collection without removing the entire Salesforce integration:
-
Open GermainUX Workspace.
-
Open the left navigation menu.
-
Select Germain.
-
Open the State tab.
-
Search for:
Type Name = Salesforce Code Monitor
Salesforce Code Monitor - Germain UX -
Locate the monitor associated with the intended Salesforce organization.
-
Turn off the toggle in the Enabled column.
-
Save the change if prompted.
Disabling the monitor stops future collection. Previously collected Apex information remains available according to the configured GermainUX retention policy.
✅ Re-enable Monitoring
To resume collection:
-
Return to Germain → State.
-
Search for
Salesforce Code Monitor. -
Turn on the Enabled toggle.
-
Confirm the execution schedule.
-
Save the configuration.
-
Allow the next scheduled execution to run.
📁 Information Collected
Depending on Salesforce permissions and available APIs, Apex Code Monitoring can collect information about:
-
Apex class names
-
Apex trigger names
-
Source content
-
Code size and related metadata
-
Test-coverage statistics
-
Covered and uncovered code
-
Changes detected during subsequent collections
-
Organization and environment context
This information can be segmented and analyzed by available dimensions such as:
-
Salesforce organization
-
Class
-
Trigger
-
Namespace
-
Collection time
-
Coverage level
-
Code version or deployment period
📊 Apex Code KPIs
The resulting KPIs help analyze Apex code inventory and test coverage.
See Apex Code KPIs for Salesforce.
Use these KPIs to identify:
-
Apex classes with low test coverage
-
Triggers with insufficient coverage
-
Coverage regressions
-
Newly introduced or modified code
-
Code that requires additional review or testing
-
Differences between Salesforce environments
🖥️ View the Salesforce Code Dashboard
Open:
Dashboards → IT → Application → Salesforce → Salesforce Code
The dashboard can provide:
-
Apex class and trigger inventory
-
Test-coverage measures
-
Trends over time
-
Breakdown by class or trigger
-
Access to individual records
-
Drill-through to supporting Apex details
Select any relevant metric or record to open its detailed analysis.
🔎 Analyze Apex Source During Root-Cause Analysis
Apex class content collected by the monitor can be made available during analysis.
This helps teams:
-
Detect an affected Salesforce KPI or issue.
-
Identify the related Apex class or trigger.
-
Open the corresponding instance or analysis view.
-
Review available code and coverage information.
-
Correlate it with exceptions, debug logs, user interactions, SOQL activity, or integration delays.
-
Determine whether additional testing, code changes, or deployment validation is required.
Apex Code Monitoring provides code inventory and coverage context. Runtime execution evidence requires the applicable exception, debug-log, or transaction-monitoring configuration.
✅ Validate Apex Code Monitoring
After the first scheduled execution, verify that:
-
The
Salesforce Code Monitorcomponent is enabled. -
Its most recent execution completed successfully.
-
The next execution time matches the configured schedule.
-
Apex classes appear in the Salesforce Code dashboard.
-
Apex triggers appear.
-
Test-coverage statistics are populated.
-
The expected Salesforce organization is identified.
-
The integration user can access all intended Apex metadata.
-
No authentication, authorization, API-limit, or network errors appear in the Engine logs.
 No Apex Data Appears
If the monitor runs but no Apex information is available:
-
Confirm that the correct Salesforce organization is configured.
-
Verify the OAuth connection.
-
Confirm that the integration user can access Apex metadata and test-coverage data.
-
Check that
Salesforce Code Monitoris enabled. -
Review its execution schedule and last-run status.
-
Confirm that the selected GermainUX Engine is running.
-
Check connectivity from the Engine to Salesforce.
-
Review Engine logs for Salesforce API errors.
-
Check the Salesforce organization’s API usage and limits.
-
Confirm that Apex classes, triggers, and coverage records exist in the organization.
⏳ Data Is Out of Date
If Apex information is present but not current:
-
Check the monitor’s last successful execution.
-
Confirm the configured Execution Schedule.
-
Verify that recent executions did not fail.
-
Review OAuth-token and Salesforce API errors.
-
Confirm that Salesforce test coverage was recalculated after the latest code or test changes.
-
Increase the monitoring frequency only if required and operationally acceptable.
📚 Related Documentation
-
Other Analytics Features
-
Other Automation Features
ℹ️ Get Help
The Germain Team can help you set this up. Contact GermainUX Support.
Component: Engine
Feature Availability: 2017.1 or later