Reports can be executed as an action (for example, triggered by an SLA breach), or can be setup to run on a schedule. To setup a report, we first create a report, then add queries and finally, setup a template.
Creating a Report
-
In the side menu navigate to Automation > Report.
-
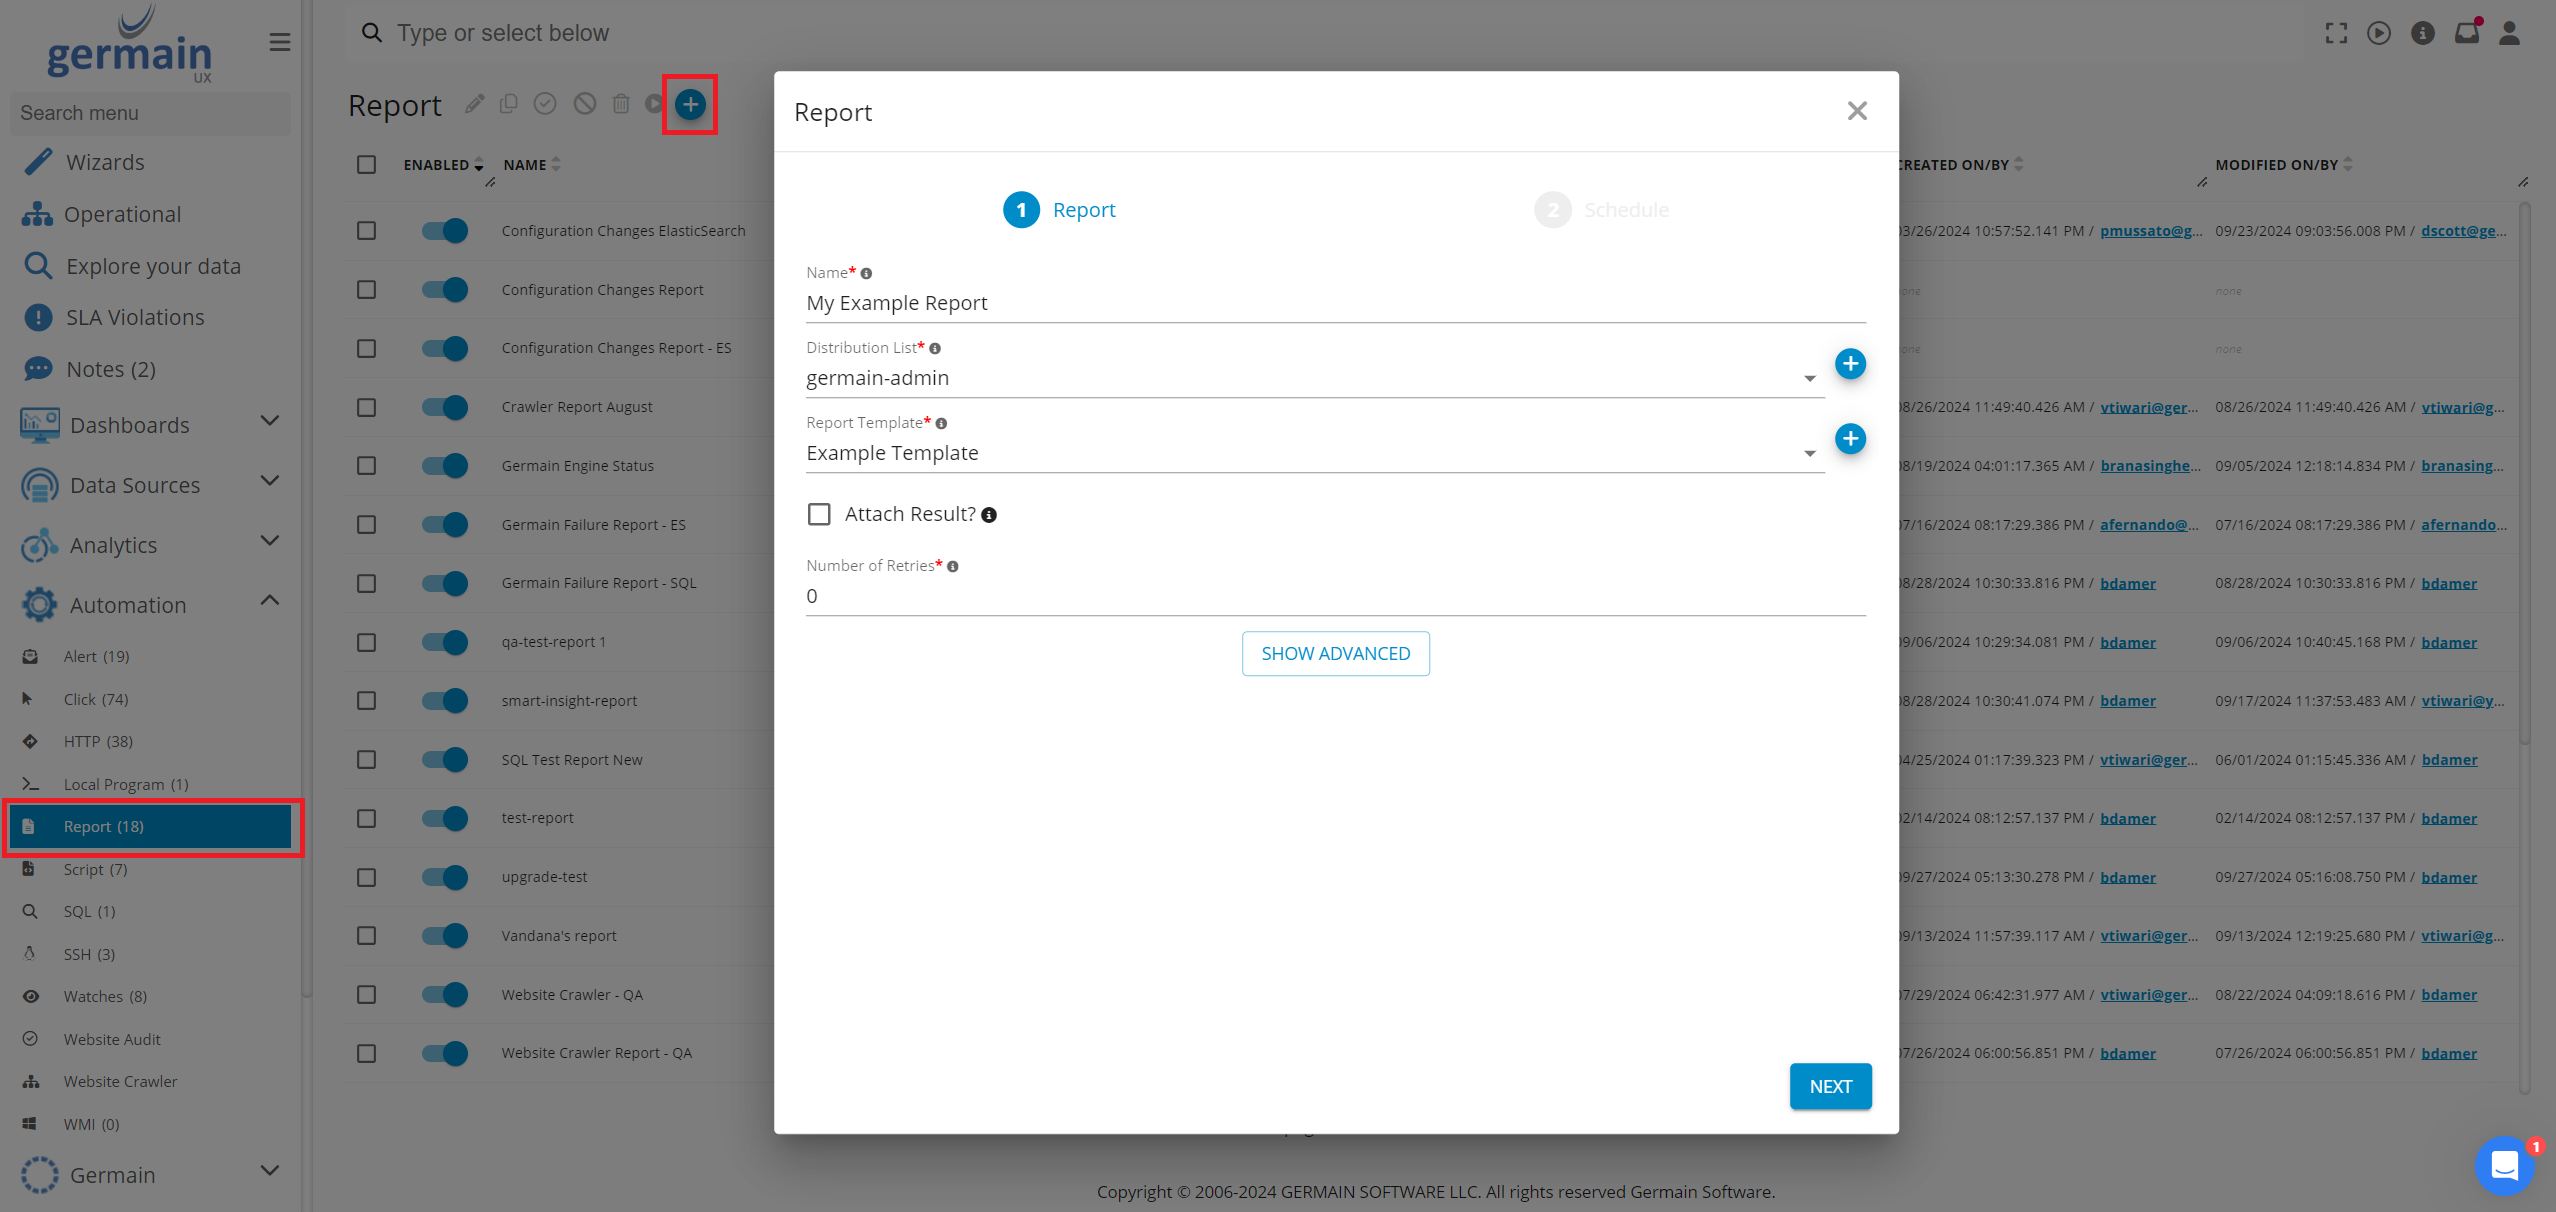
Click the plus icon to create a new report. You should see a wizard as below:
-
Complete the first page of the wizard and click Next:
-
Name: The name of this report
-
Distribution List: who this report will be sent to
-
Report Template: The template to be used to generate the report content (you can create a new empty template or use an existing one)
-
Attach result: If selected, the raw results will be attached to the report
-
-
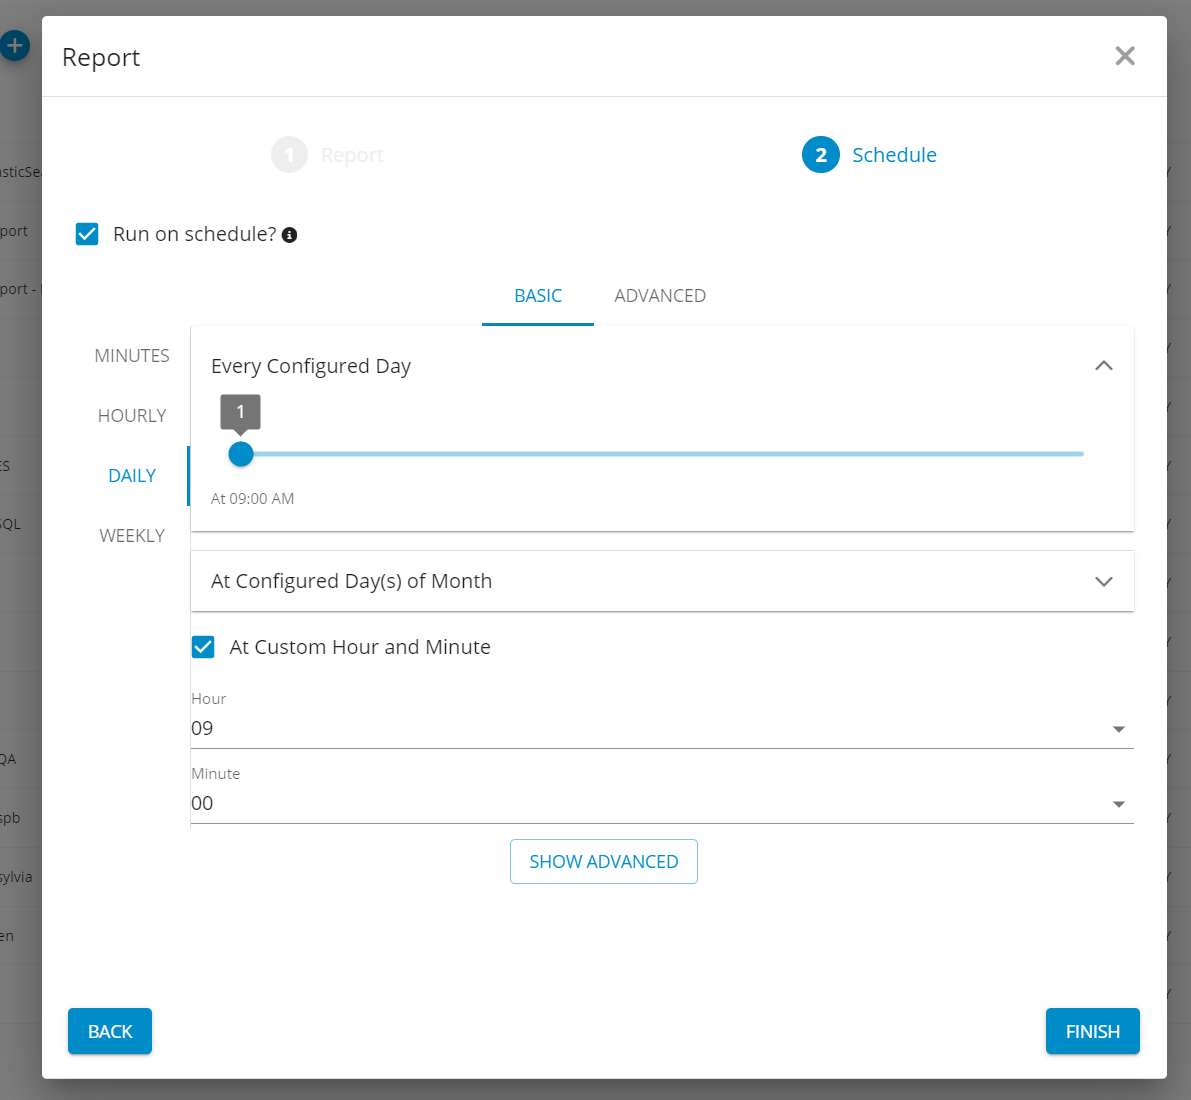
Now we need to configure when the report will run. We can either run on a fixed schedule, or we can setup the report to run as an action (for example, when an SLA is breached).
-
Here is an example of how to configure a report to run daily at 9:00am:
-
If you want to run the report as an action, deselect the ‘Run on Schedule’ checkbox and add the report as an action to any configuration that allows running actions (e.g. SLA).
-
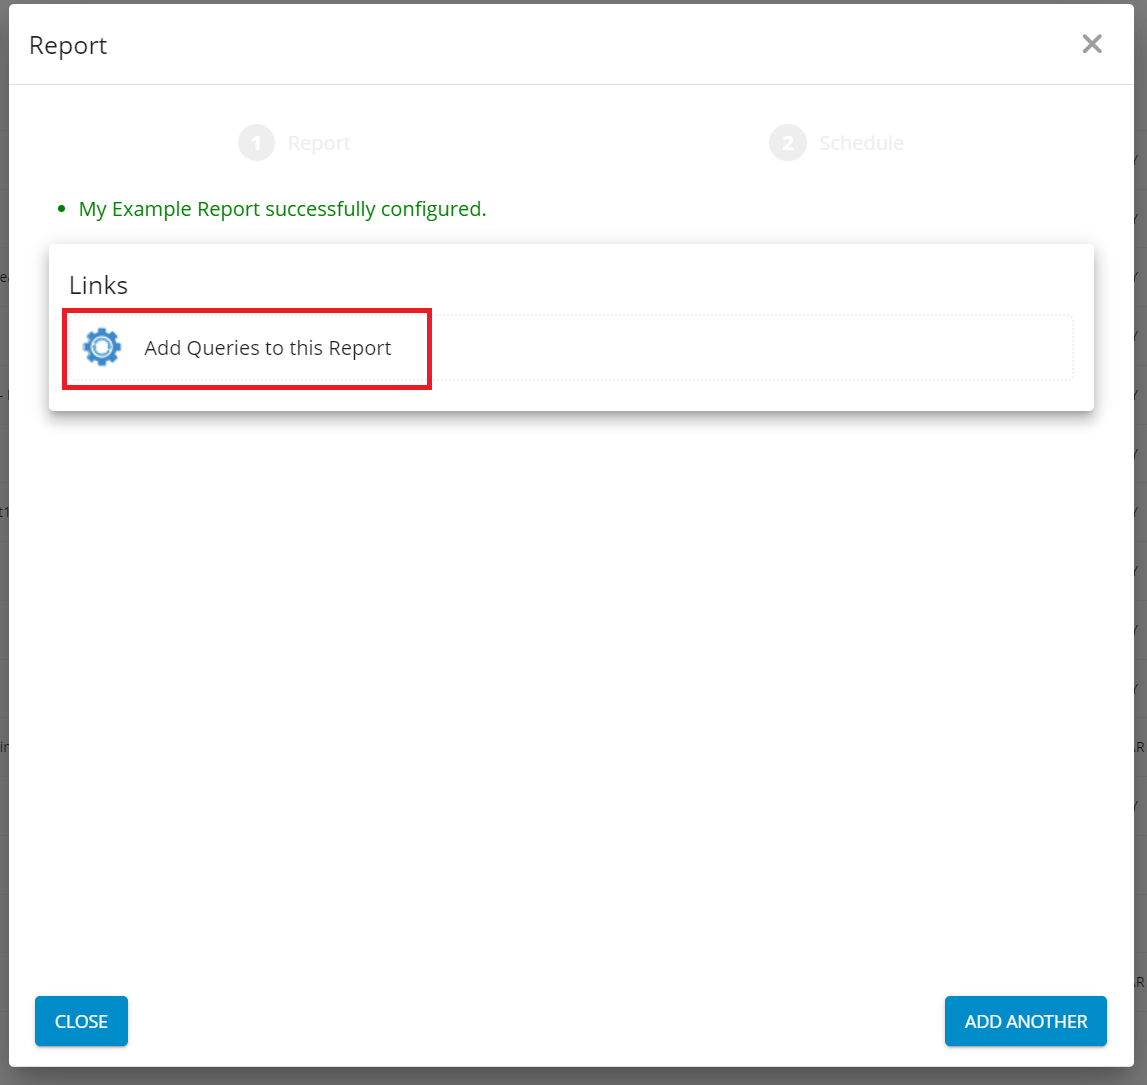
Complete the wizard by clicking Finish.
-
When the wizard completes, you will get a link to add queries to your report, click the link
Adding Queries to a Report
Once you click the link, you will be taken to a new view that allows to add/edit/preview queries.
A report can have one or many queries to query data that can then be visualized in a report by configuring a Template. To add/edit/remove queries for a report you can either:
-
Create a new Report and follow the link at the end of the wizard.
-
Find an existing Report by going to Automation > Report, select a Report and click on any of the queries.
Choose a Query
-
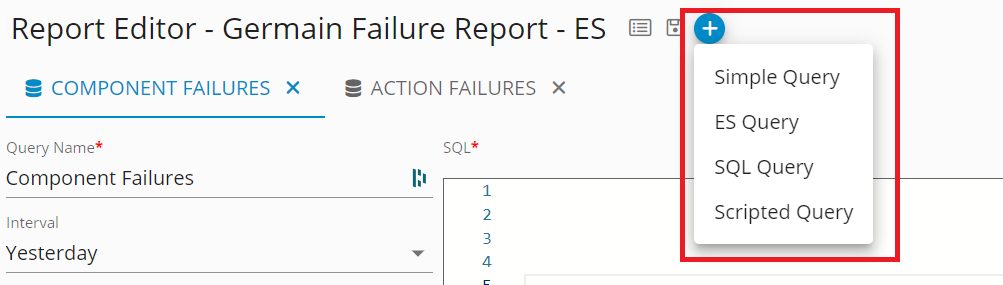
Click the blue plus button at the top of the page, next to the template name
-
You will be offered 3 choices for queries:
-
Scripted Query: For complex use cases, write JavaScript that leverages GermainUX's Java services and data model classes to generate an automated report (Germain Datamart only, relational DB, or Elastic).
-
Simple Query: The easiest way to create an automated report—no SQL knowledge required (Germain datastore only, relational DB, or Elastic).
-
SQL Query: Write a SQL query to generate an automated report (against any datastore).
-
-
Select an option
Scripted Query
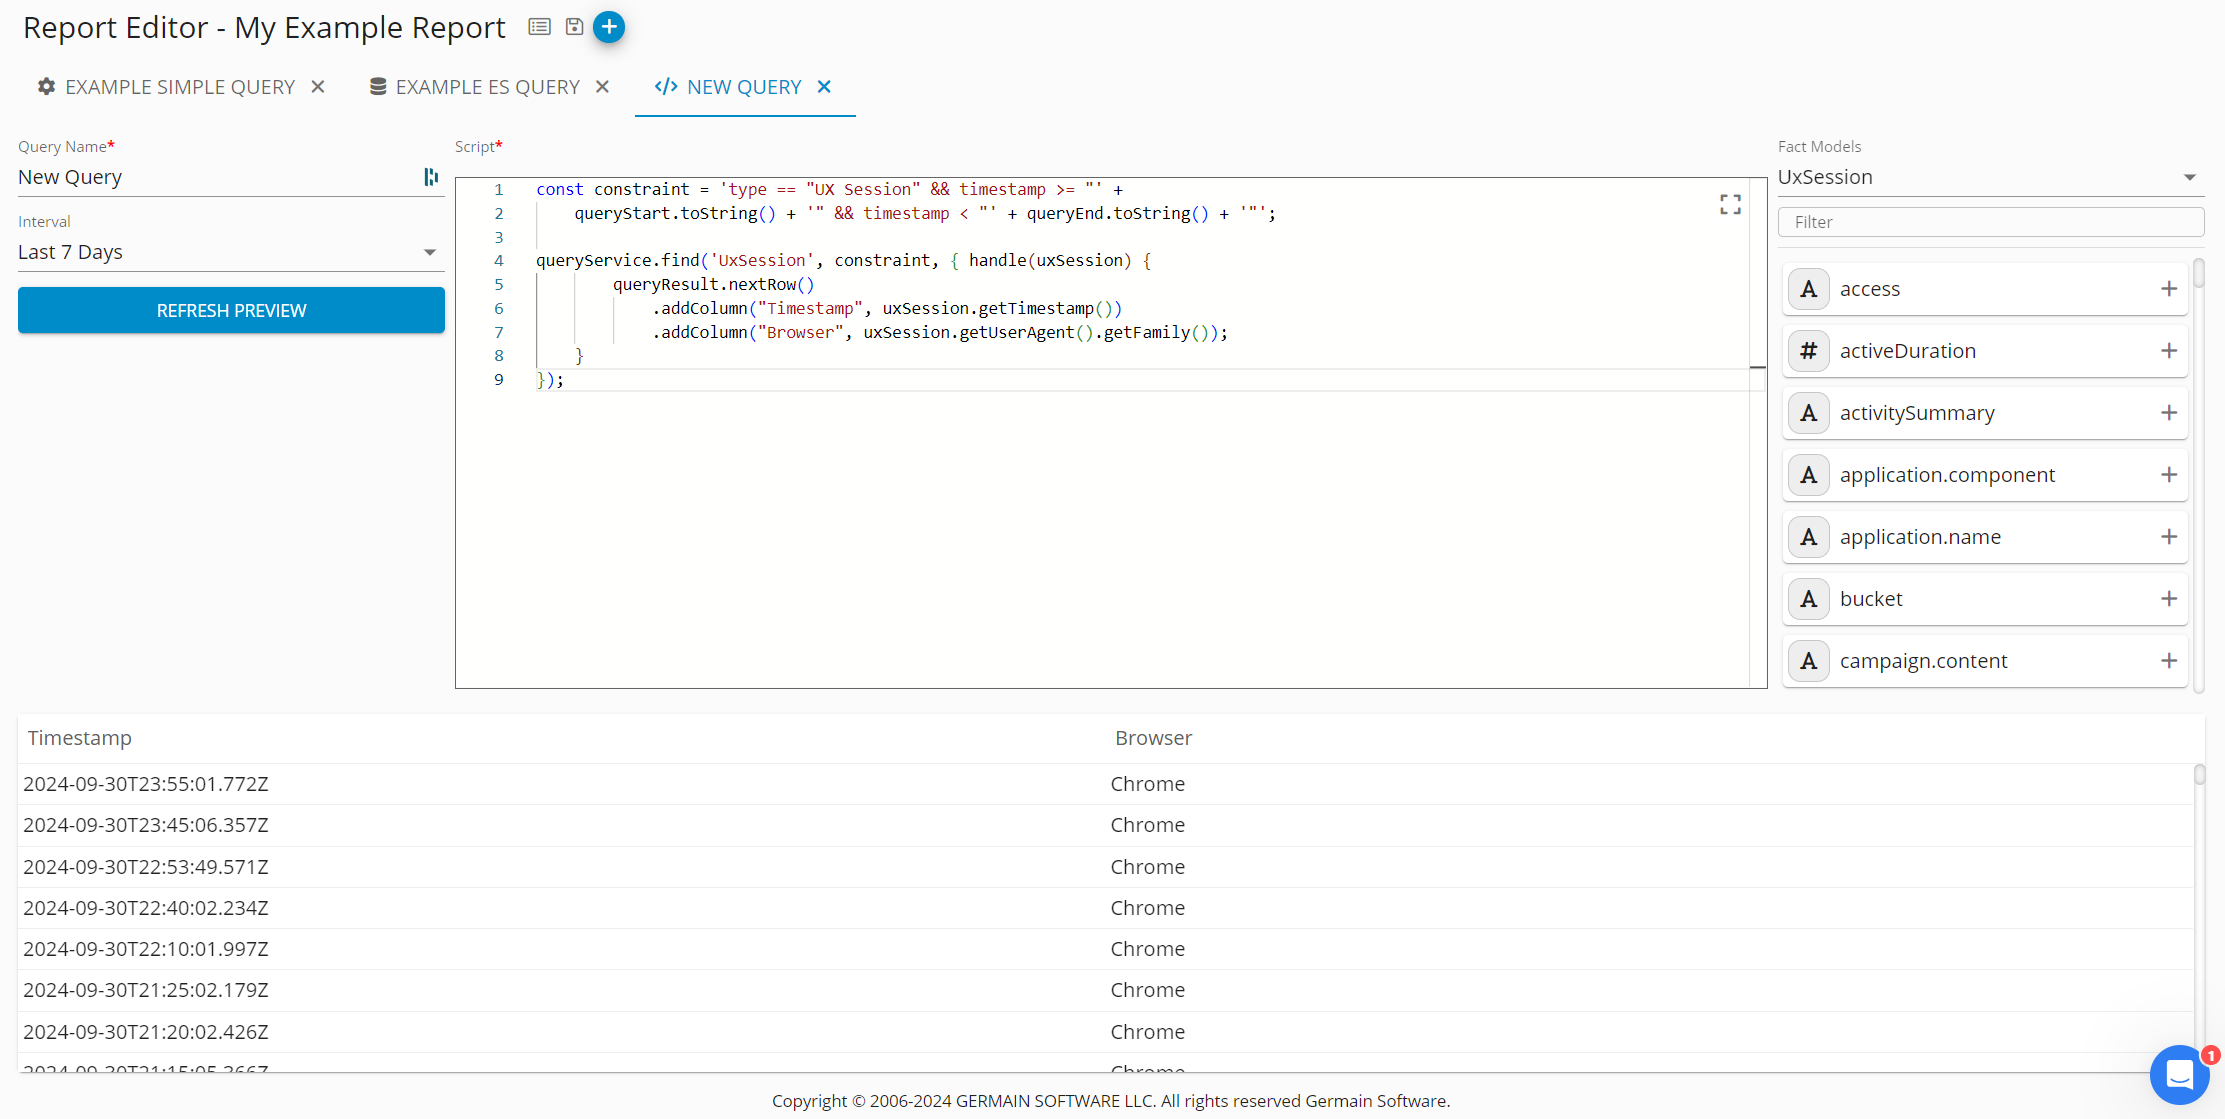
To add a Scripted Query:
-
Select the time interval to run the query on, or leave empty if you want to create this programmatically.
-
Write the script to query the Germain UX Datamart - you will be provided with autocomplete options the available functions and variables.
-
You can use the Fact Model glossary on the right side to investigate what fields are available in a particular fact model:
-
Once you have written your script, you can click the Refresh Preview to preview the results and check that they meet your requirements. The example above selects the timestamp and browser of each user session in the last 7 days. We can configure the script to perform multiple queries or any other logic written in JavaScript
-
When happy with the changes, click the save button in the actions panel.
Simple Query
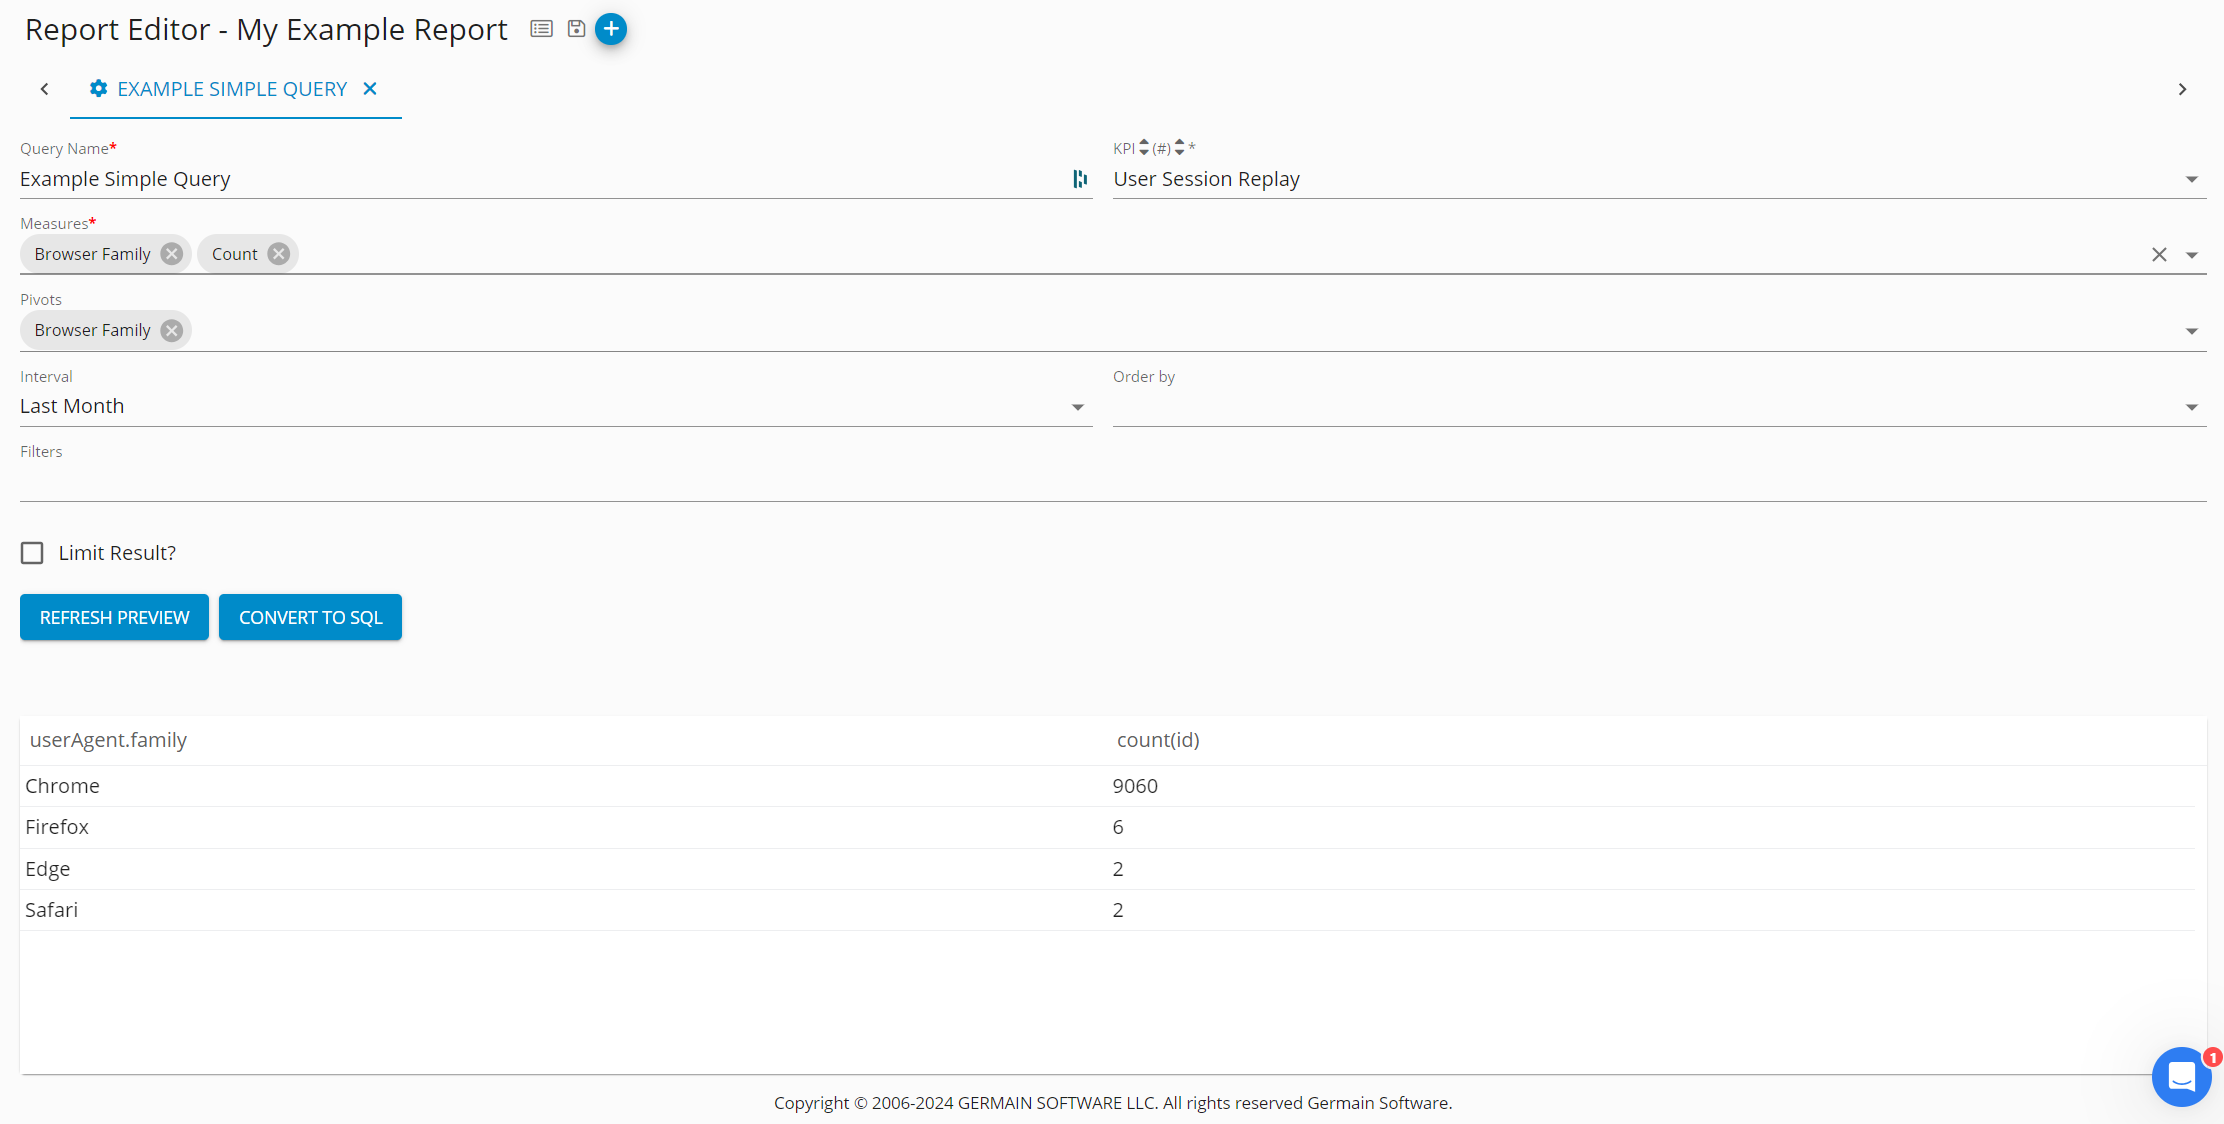
To add a Simple Query:
-
Complete the required fields and add any additional constraints that you would like.
-
Once completed, click the Refresh Preview button to display the result of your query as a table below.
-
When happy with the changes, click the save button in the actions panel.
The following example shows how to configure a report that will show a count of user sessions grouped by the browser type (e.g. Chrome, Firefox, Edge, etc):
SQL Query
This is very similar to the ES Query case. The only difference is that instead of querying an Elasticsearch index, the query will run against a Relational Database table.
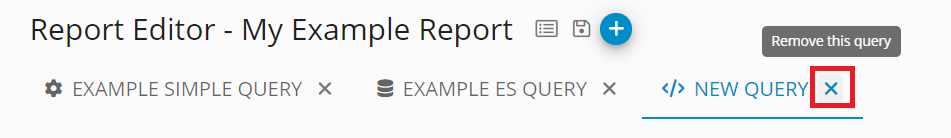
Remove a Query
To remove a query, click the close icon on the query tab and confirm the dialog:
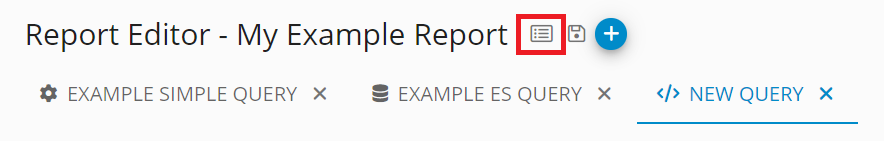
Editing the Template
When you have configured your queries and saved the changes, you can configure the report template by clicking the button in the actions panel. For more information about editing the Template, see our documentation here.
Feature Availability: 2024.2 or later