Feature
Germain UX analyzes application code performance in real-time, providing insights into code behavior, performance, and potential issues as it runs. This analysis includes execution time, memory usage, CPU utilization, network requests, database queries, and other key metrics.
Transaction Time Breakdown
Transaction response time is analyzed and broken down by layers, with customization options available.
-
Default Time Layers: Browser | Network | Web Server | Application Server | Integration(s) | Database
-
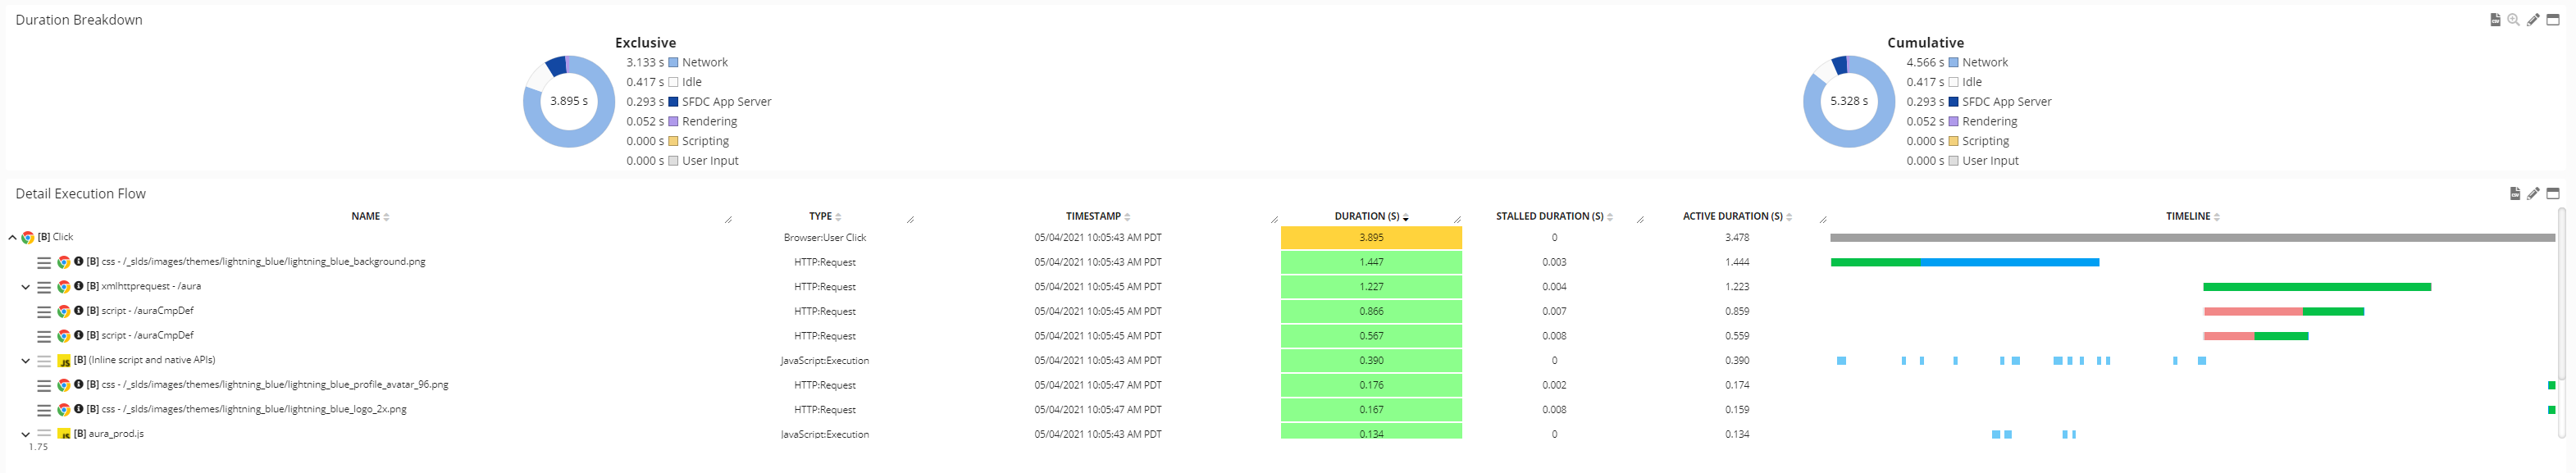
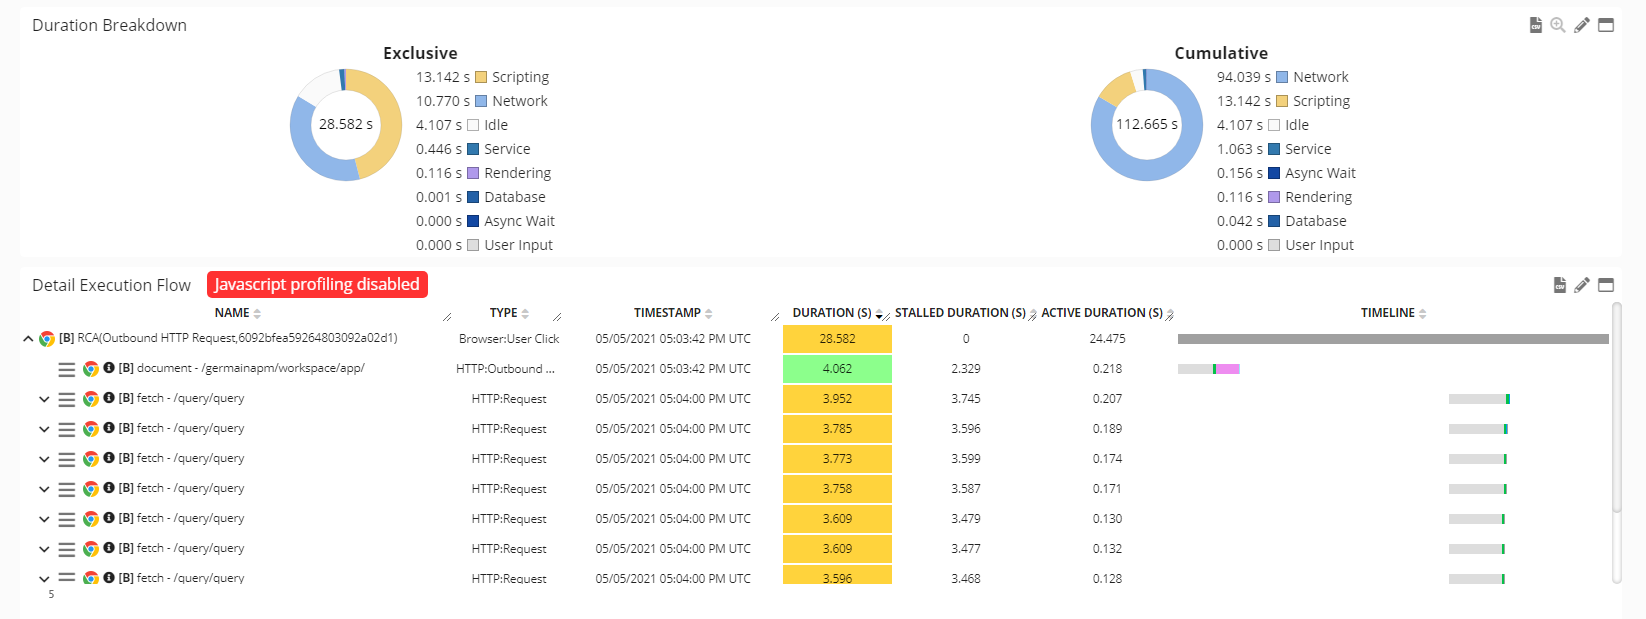
Exclusive Time: Measures the critical path-related time required for a transaction to complete.
-
Cumulative Time: Sums asynchronous transaction time to help understand the total processing effort, regardless of when a transaction completes its critical function.
Video overview: https://youtu.be/ebJMKVQDHOU
Supported Transaction Analyses
-
Salesforce.com Transaction Analysis
-
Oracle Siebel CRM Transaction Analysis
-
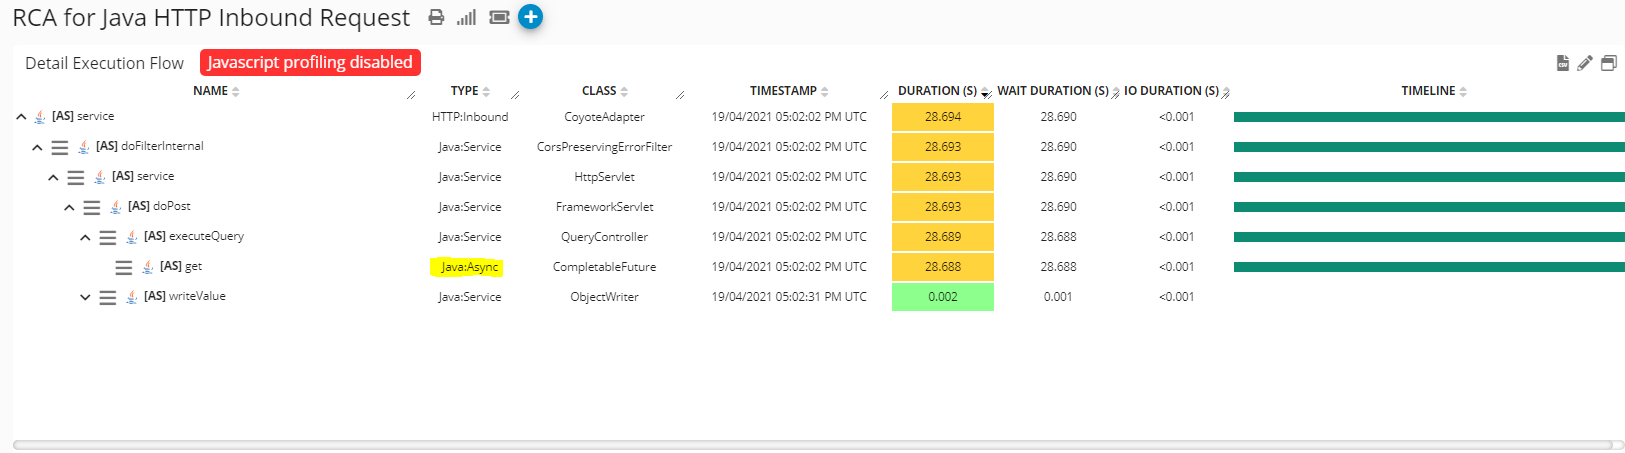
React/Java App Transaction Analysis
SalesForce.com Transaction analysis

Oracle Siebel CRM Transaction Analysis

React/Java app Transaction Analysis
Supported Code Profiling
C# Profiling
GoLang Profiling
Java Profiling
Javascript Profiling
Node.Js Profiling
By analyzing code execution in real-time, Germain UX helps identify bottlenecks, inefficiencies, and errors while highlighting areas for optimization. This empowers developers to make informed decisions, ultimately improving code performance and reliability.
Service: Analytics
Feature Availability: 2016.2 or later