Feature
Here are details on how to configure Germain UX to monitor Salesforce Logs and automate insights, including the following events and metrics:
-
Apex callouts, executions, SOAP calls, triggers, and exceptions
-
API, bulk, metadata, and REST API calls
-
Lightning errors, interactions, page views, and their performance
-
Login, login as, and logout
-
Aura and Visualforce requests
-
Wave changes, interactions, and their performance
-
Search
-
Report exports
Configure
Enable
This monitoring is enabled when you deploy Salesforce monitoring using the Salesforce Application wizard.
Disable
Follow these steps to disable ongoing Salesforce Instance Status monitoring:
-
Go to Germain Workspace.
-
Access the Left Menu.
-
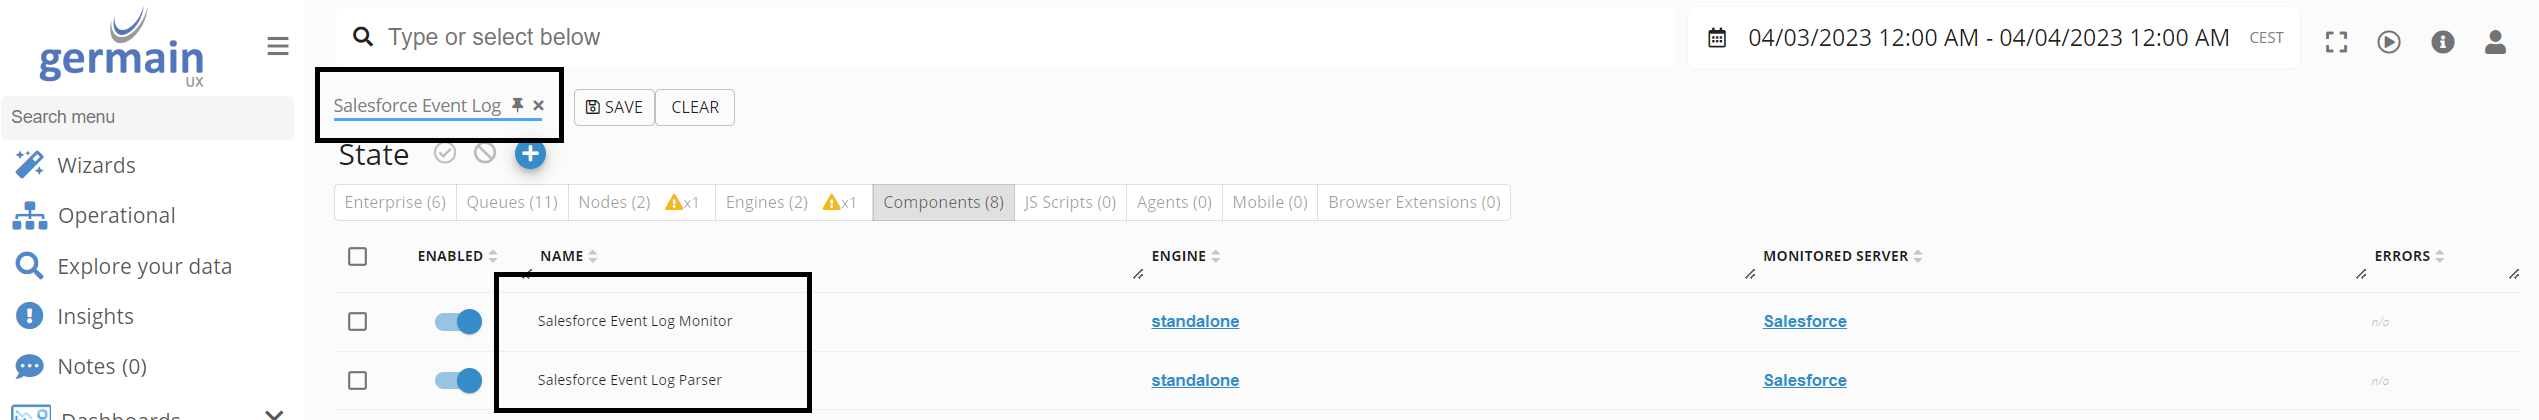
Choose "Germain" and then switch to the "State" tab.
-
Search for "Salesforce Event Log.
-
Disable all two components by switching the toggle in the "ENABLED" column to :disabled: (disabled state).
Frequency
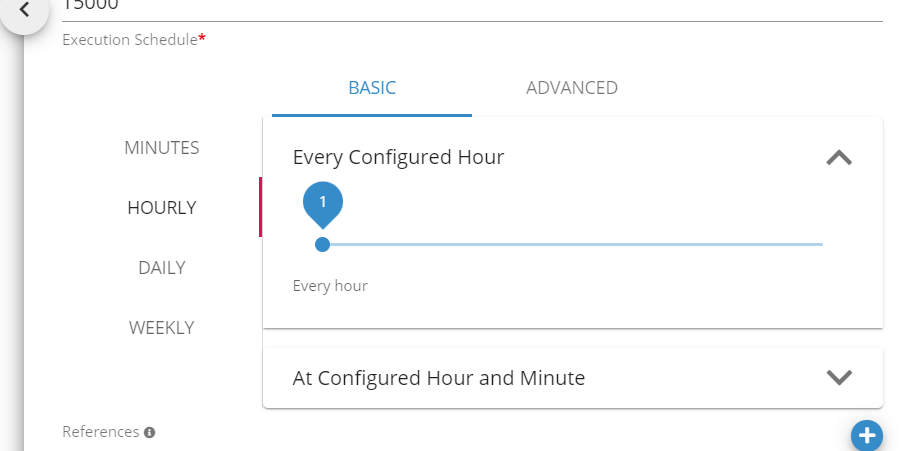
By default, this monitoring is configured to run once per hour. You have two options to update this component's execution frequency for pulling in SFDC Debug logs:
First Deployment
-
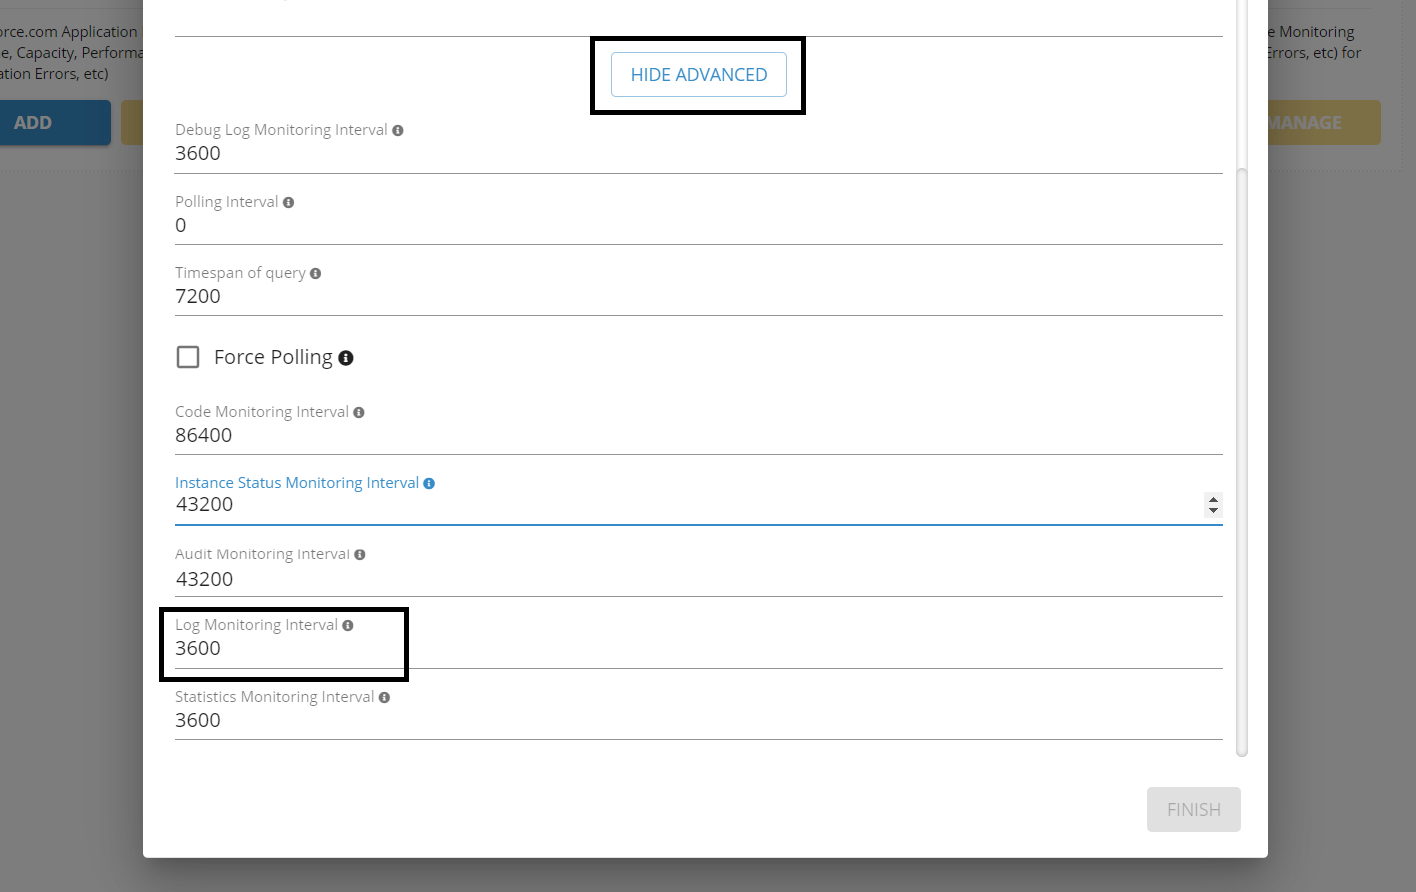
You can set the execution frequency value during the initial Salesforce Application monitoring deployment in the Salesforce Application wizard.
-
Click "SHOW ADVANCED" and set the "Debug Log Monitoring Interval" value.
Runtime
-
Go to Germain Workspace.
-
Access the Left Menu.
-
Choose "Germain" and then switch to the "State" tab.
-
Search for Type Name = Salesforce Event Log Monitor.
-
Select a component.
-
Update the "Execution Schedule" value and click to save your change.
KPIs
Dashboard
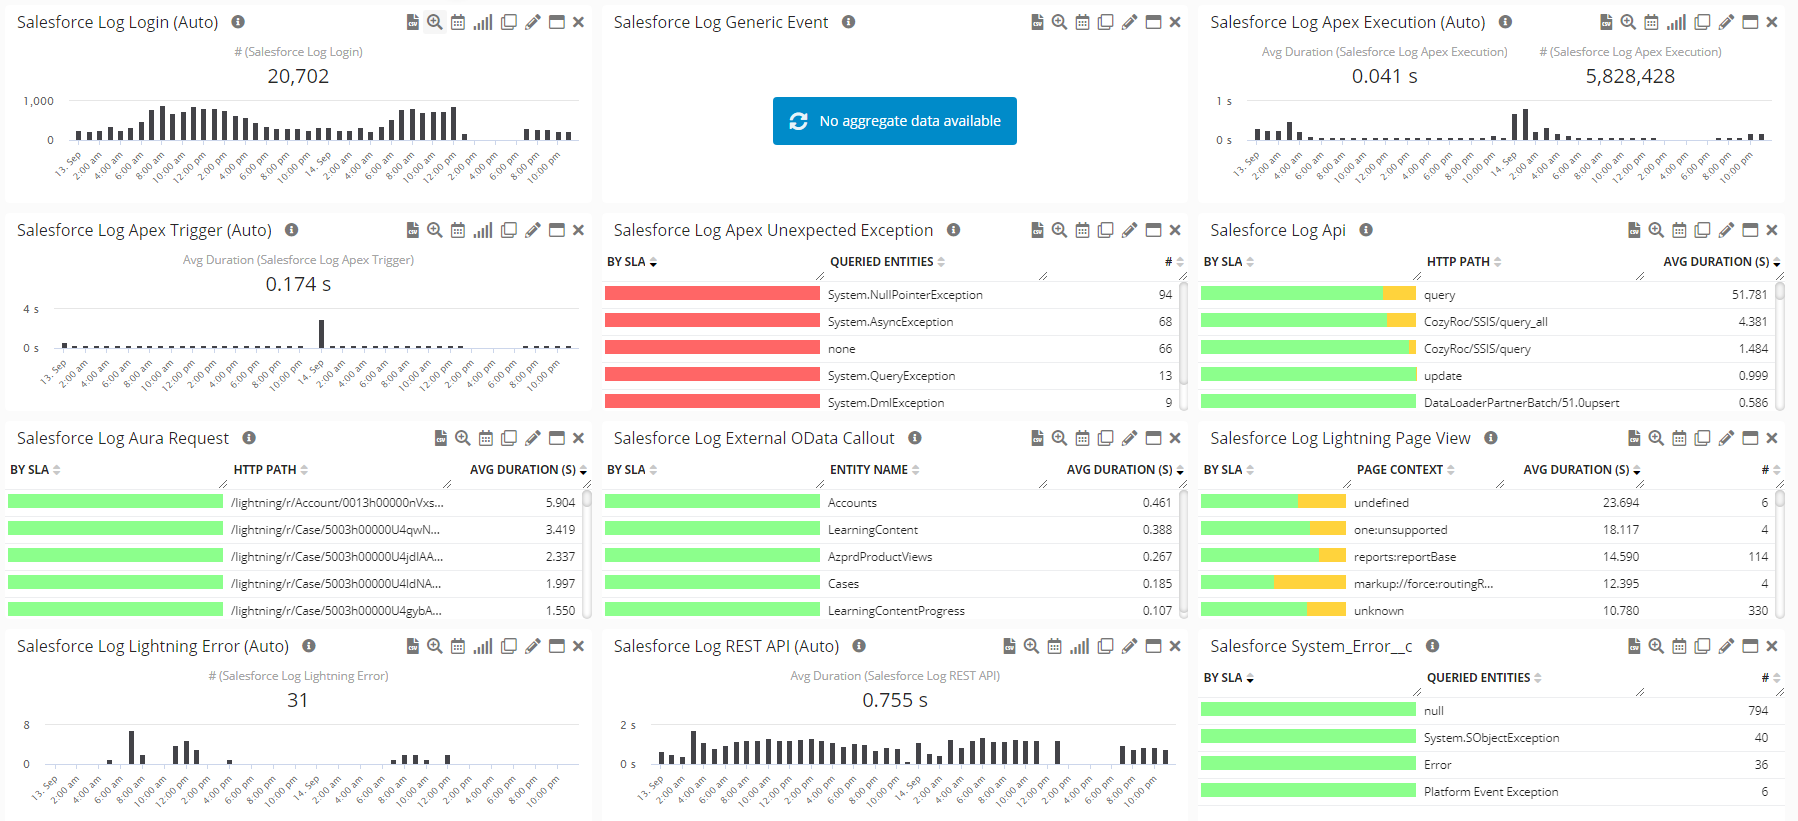
Dashboards > IT > Application > Salesforce > Salesforce Logs
Example
-
Salesforce Logs Monitoring Overview
-
Salesforce Apex Unexpected Exception by type
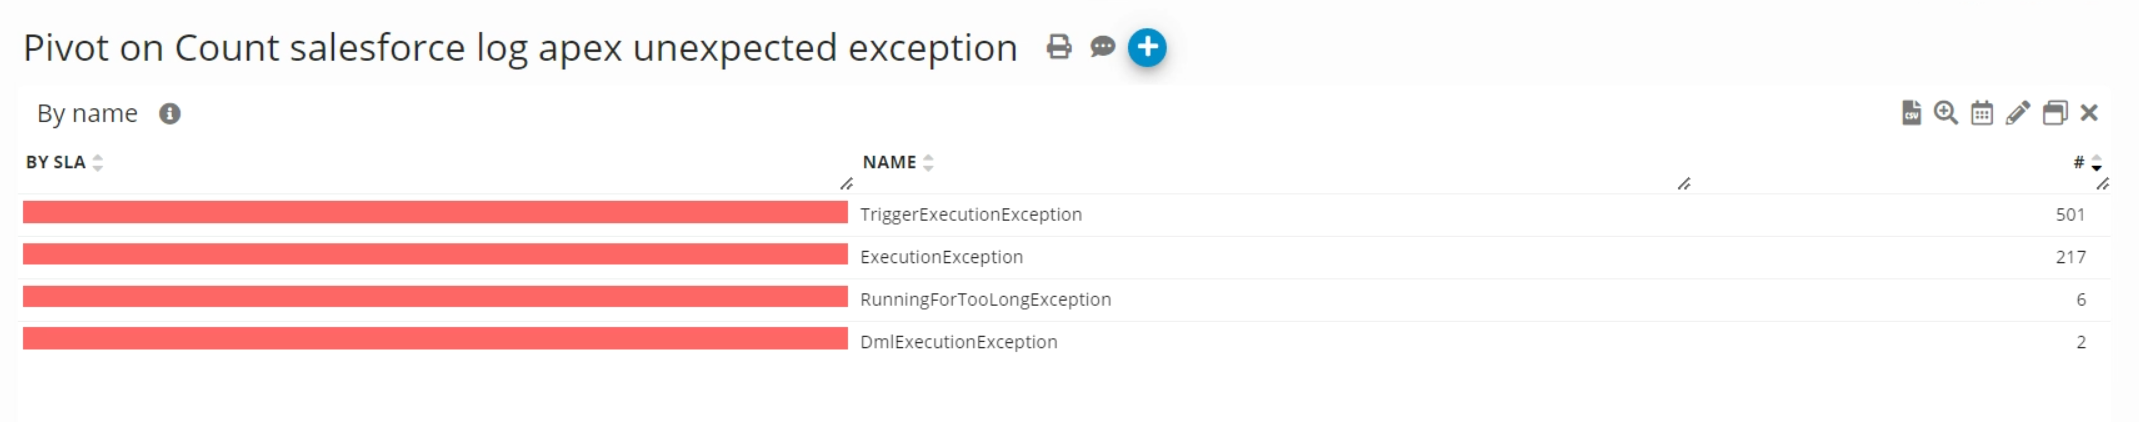
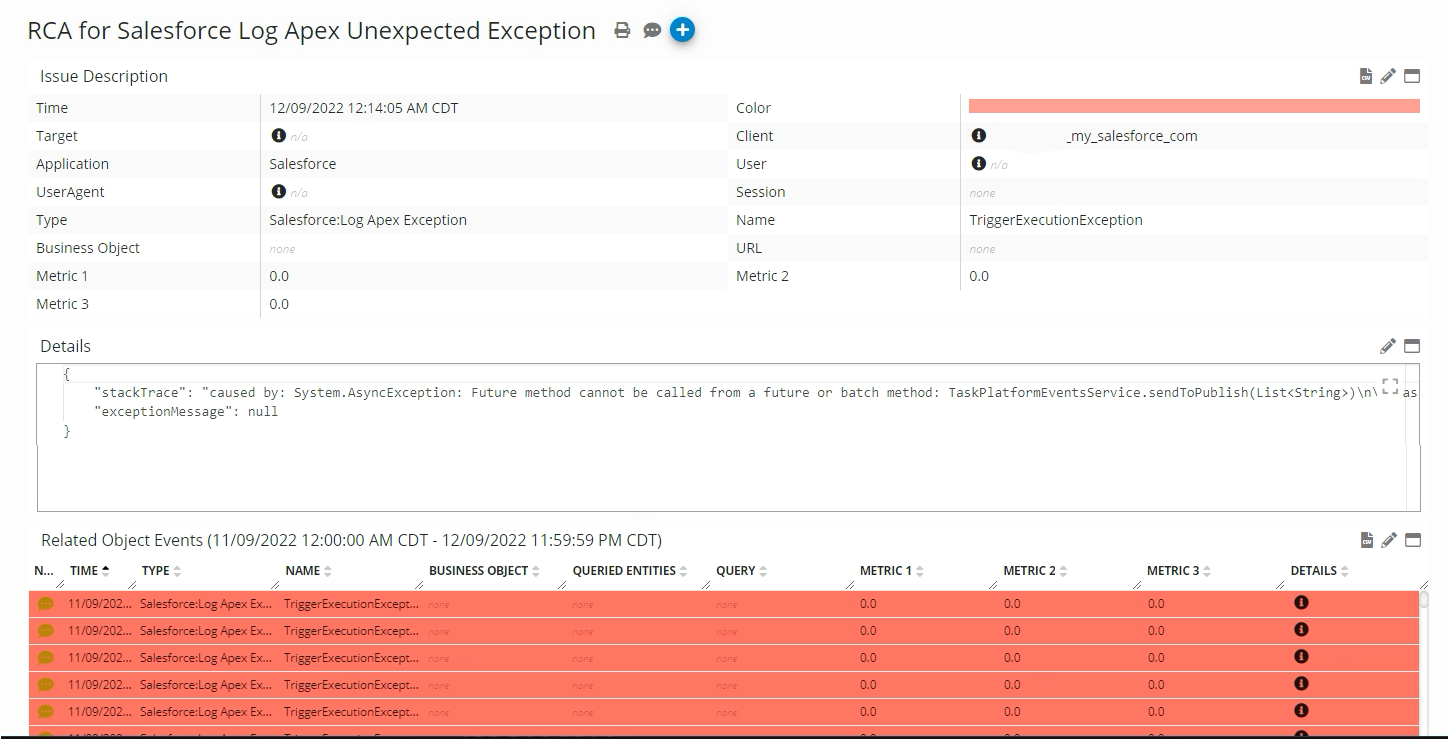
-
Salesforce Apex Unexpected Exception RCA
Component: Engine
Feature Availability: 2022.1 or later