Java Monitoring
Features for Java
Germain is designed to monitor the uptime, performance, and usage of Java applications. With Germain, you can gain valuable insights into the availability, responsiveness, and overall performance of your Java applications. Additionally, Germain offers a variety of automation features, enabling you to proactively detect and automatically resolve issues.
Real-time Monitoring and Insights for Java
Key monitoring capabilities and automated insights in Germain UX for Java applications, including:
CPU and Memory Usage Monitoring
Track the utilization of CPU and memory resources by the Java application to identify potential performance bottlenecks and resource constraints.
HTTP Requests Monitoring
Monitor inbound and outbound HTTP requests made by the Java application. Track response times, status codes, and payload sizes to ensure proper functioning and performance of web interactions.
JMS Messages Monitoring
Monitor inbound and outbound JMS (Java Message Service) messages exchanged by the Java application. Track message rates, processing times, and potential errors to ensure reliable and efficient message communication.
SQL Transactions Monitoring
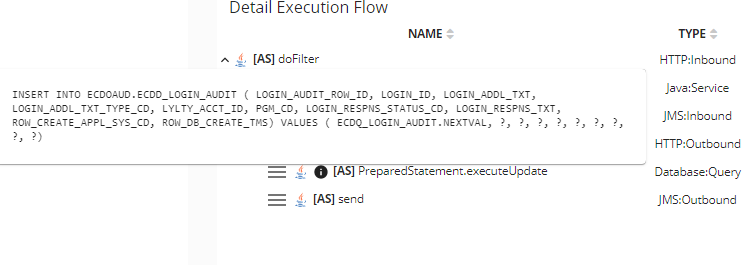
Monitor SQL transactions executed by the Java application, including query execution times, transaction rates, and potential errors. This helps identify performance issues or inefficiencies related to database interactions.
Class Method
Germain allows you to define a custom list of class methods to monitor at the application startup. This enables you to track specific method invocations and their execution times for performance analysis or troubleshooting purposes.
Sampler for CPU profiling
Germain provides a CPU profiling sampler to collect detailed information about CPU usage and performance hotspots in the Java application. This helps identify CPU-intensive code sections and optimize application performance.
JMX Access
Germain supports JMX (Java Management Extensions) access, allowing you to remotely inspect agent statistics or configure the monitoring setup. This feature provides additional flexibility and control over the monitoring process.
Inspecting the agent via JMX
The Germain Java agent registers multiple MBeans via JMX to expose additional statistics at run-time. Any JMX client, such as VisualVM with the MBeans plugin, can be used to connect to the Java process and browse the exported objects.
KPIs
List of preconfigured KPIs for Java.
Custom Real-time Insights for Java.
Here is a list of real-time analytics features in Germain UX that can be customized to gain more insights from your Java application.
Examples of Insights for Java

Java Code Analysis on RCA Dashboard - Germain UX

Java Code Analysis on WaterFall Portlet on RCA Dashboard - Germain UX

SQL call on by a Java Method Analyzed on RCA Dashboard - Germain UX
Real-time Automation for Java
Germain provides key real-time automation features for Java application, that can be customized to proactively detect or resolve issues that affect a Java application.
For more detailed information, please reach out to us. We will provide you with further guidance and assistance tailored to your needs.
Component: Code Profiler, Engine, RPA Bot Recorder, RUM JS, RUM Ext
Feature Availability: 8.6.0 or later
