
📡 Network Request Monitoring
GermainUX monitors the availability and performance of HTTP requests executed by a monitored web application. Each request is associated with the available application, page, browser, user, and session context, helping teams understand how front-end requests affect the user experience.
Network Request Monitoring is enabled by default for each User Monitoring Profile.
⚙️ Monitoring components
|
Component |
Role |
|---|---|
|
Continuously monitors browser HTTP requests when the GermainUX monitoring script can be deployed in the application. |
|
|
Provides network-request monitoring when RUM JS cannot be deployed directly or access to the complete browser-page context requires an extension. |
|
|
Captures deeper network, resource-loading, JavaScript, browser, and code-level evidence for targeted investigation. |
📋 Capabilities
GermainUX can monitor:
-
Requests executed through
XMLHttpRequest. -
Requests executed through the Fetch API.
-
Requests sent through the Beacon API when enabled.
-
Request URL and HTTP method.
-
Request duration and outcome.
-
Available HTTP status and error information.
-
Request and response details when collection is enabled.
-
Duplicate requests.
-
Cached-request classification based on a configurable timing heuristic.
-
Server Timing information returned by monitored services.
-
Front-end-to-back-end correlation when GermainUX request tracking is enabled.
-
Related user interactions, errors, pages, sessions, and business workflows.
WebSocket activity is controlled through the network settings but is covered separately under WebSocket Monitoring.
Default monitoring
|
Capability |
Default |
|---|---|
|
Network Request Monitoring |
Enabled |
|
Fetch requests |
Collected |
|
|
Collected |
|
Beacon requests |
Not collected |
|
WebSocket monitoring |
Enabled |
|
Request details |
Collected |
|
Response details |
Collected |
|
Duplicate-request detection |
Enabled |
|
Server Timing collection |
Enabled |
|
Front-end-to-back-end tracking header |
Disabled |
Most customers do not need to change these settings unless they want to reduce collected data, exclude background traffic, protect sensitive content, enable Beacon collection, or configure end-to-end correlation.
Business benefits
Network Request Monitoring helps organizations:
-
Detect slow or failed requests affecting real users.
-
Identify the users, pages, sessions, and workflows affected by a service problem.
-
Distinguish browser, network, API, and back-end performance issues.
-
Find intermittent failures that are difficult to reproduce.
-
Detect excessive or duplicate requests that waste browser and server resources.
-
Prioritize problems according to frequency and actual user or business impact.
-
Correlate a slow browser interaction with the corresponding back-end transaction.
-
Validate whether an application, API, or infrastructure correction resolved the issue.
Continuous monitoring
GermainUX RUM JS or the GermainUX RUM Extension continuously monitors requests made during real user sessions.
Use:
-
RUM JS when the GermainUX monitoring script can be deployed directly in the application.
-
RUM Extension when direct script deployment is unavailable or the application’s security model prevents access to the required browser context.
The collected request information is associated with other available user and technical evidence, such as clicks, page activity, JavaScript errors, long tasks, and Session Replay.
Deeper investigation with JS Profiler
When continuous monitoring identifies a slow, failed, or unexpected request, the GermainUX JS Profiler can provide deeper evidence, including:
-
Network requests and resource loading.
-
Request timing within browser activity.
-
JavaScript functions associated with the request.
-
Long-running browser tasks.
-
JavaScript errors and stack traces.
-
User interactions and DOM activity.
-
Application, page, workflow, and session context.
The JS Profiler complements continuous network monitoring. RUM JS or the RUM Extension can remain enabled across the user population, while deeper profiling should normally be limited to the applications, pages, users, or investigation periods that require it.
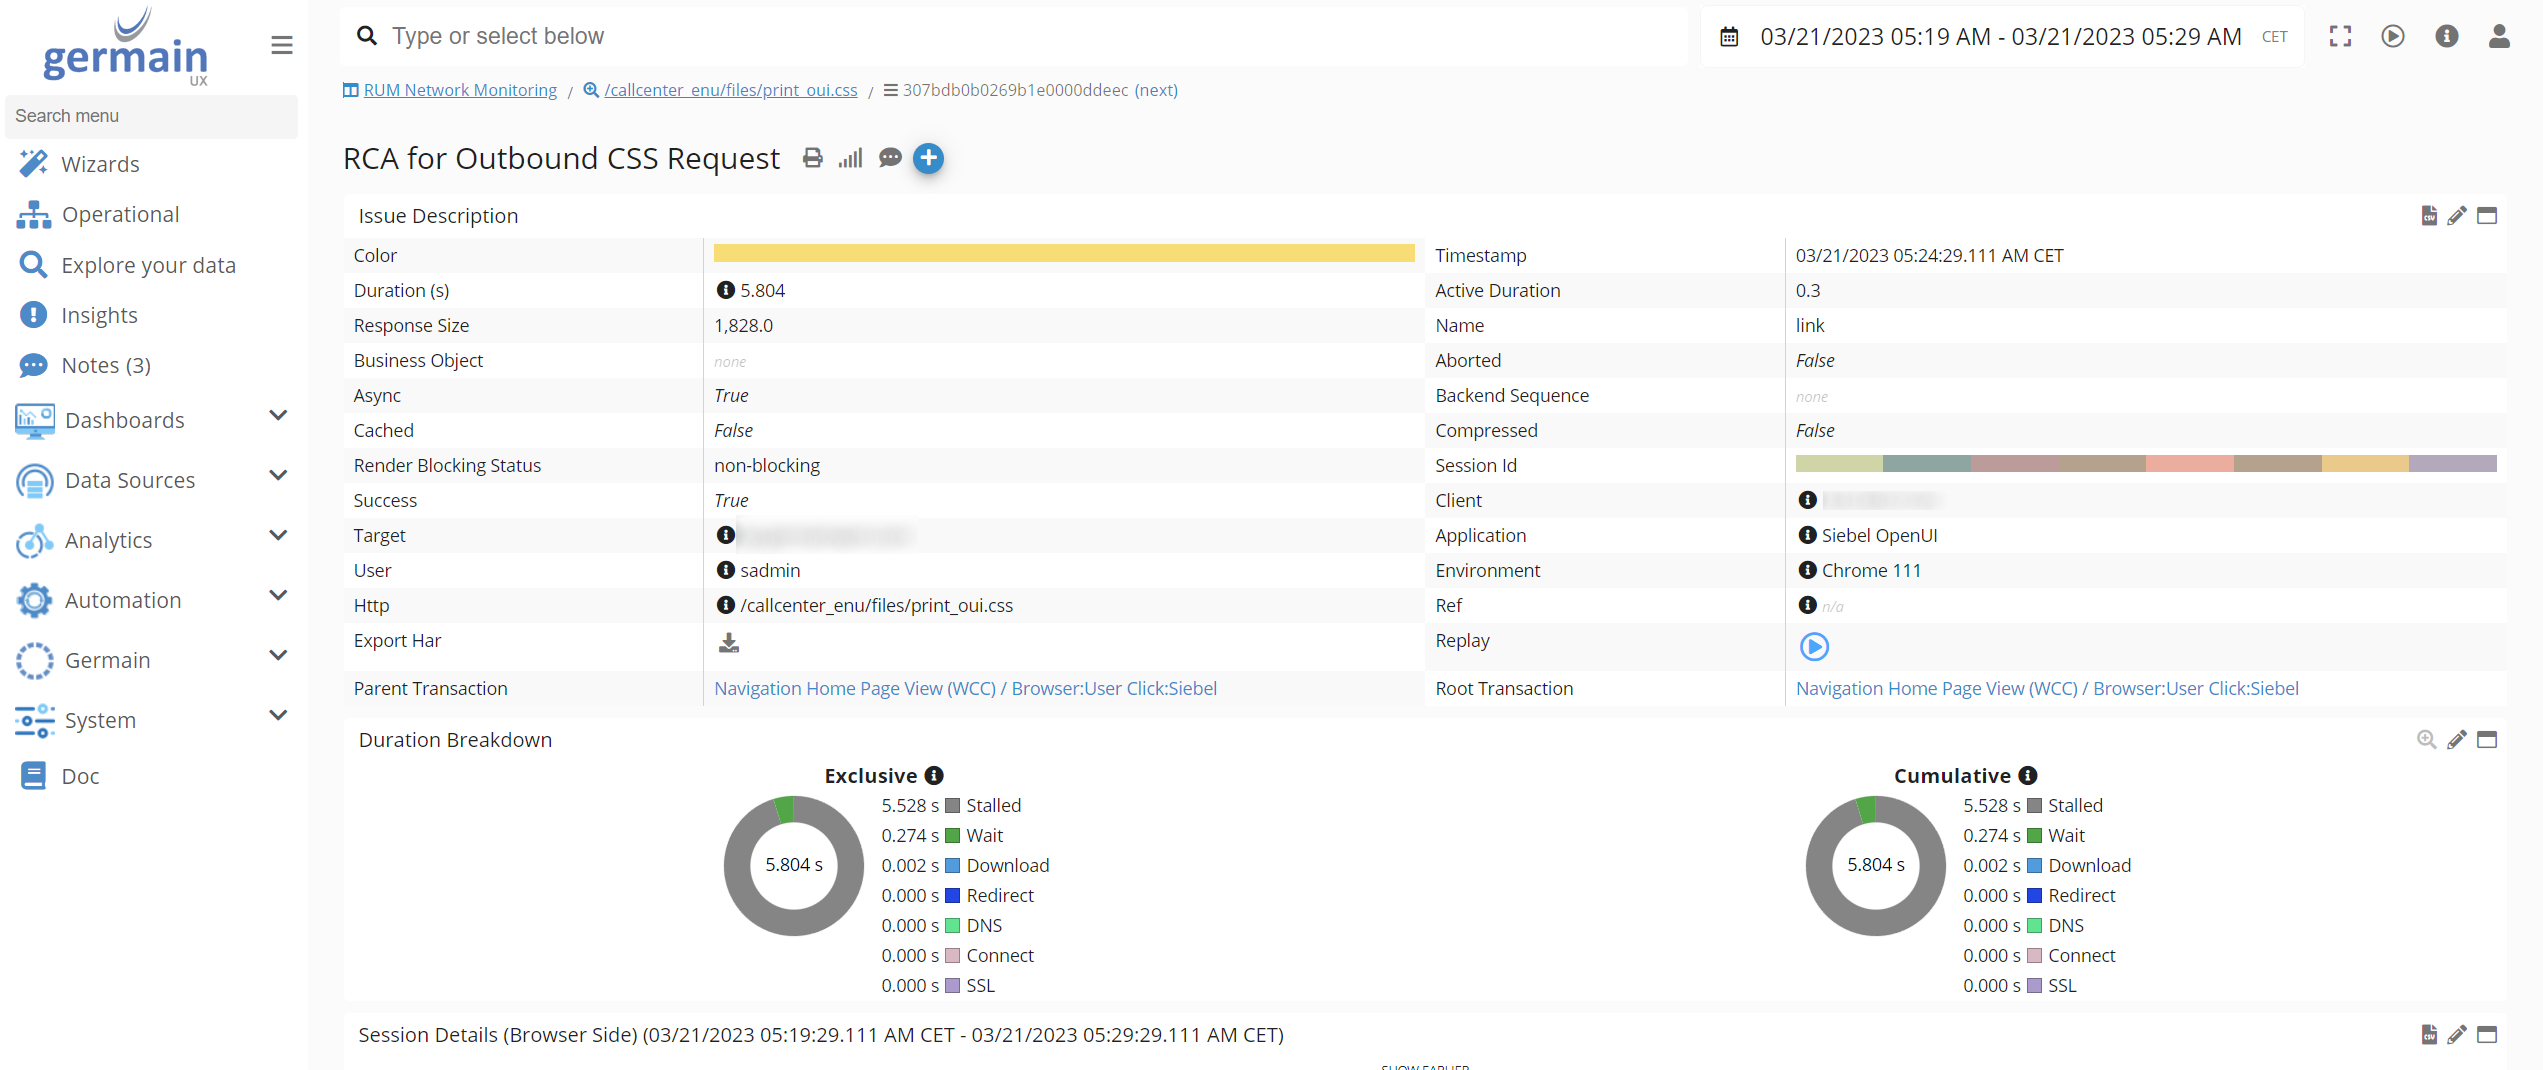
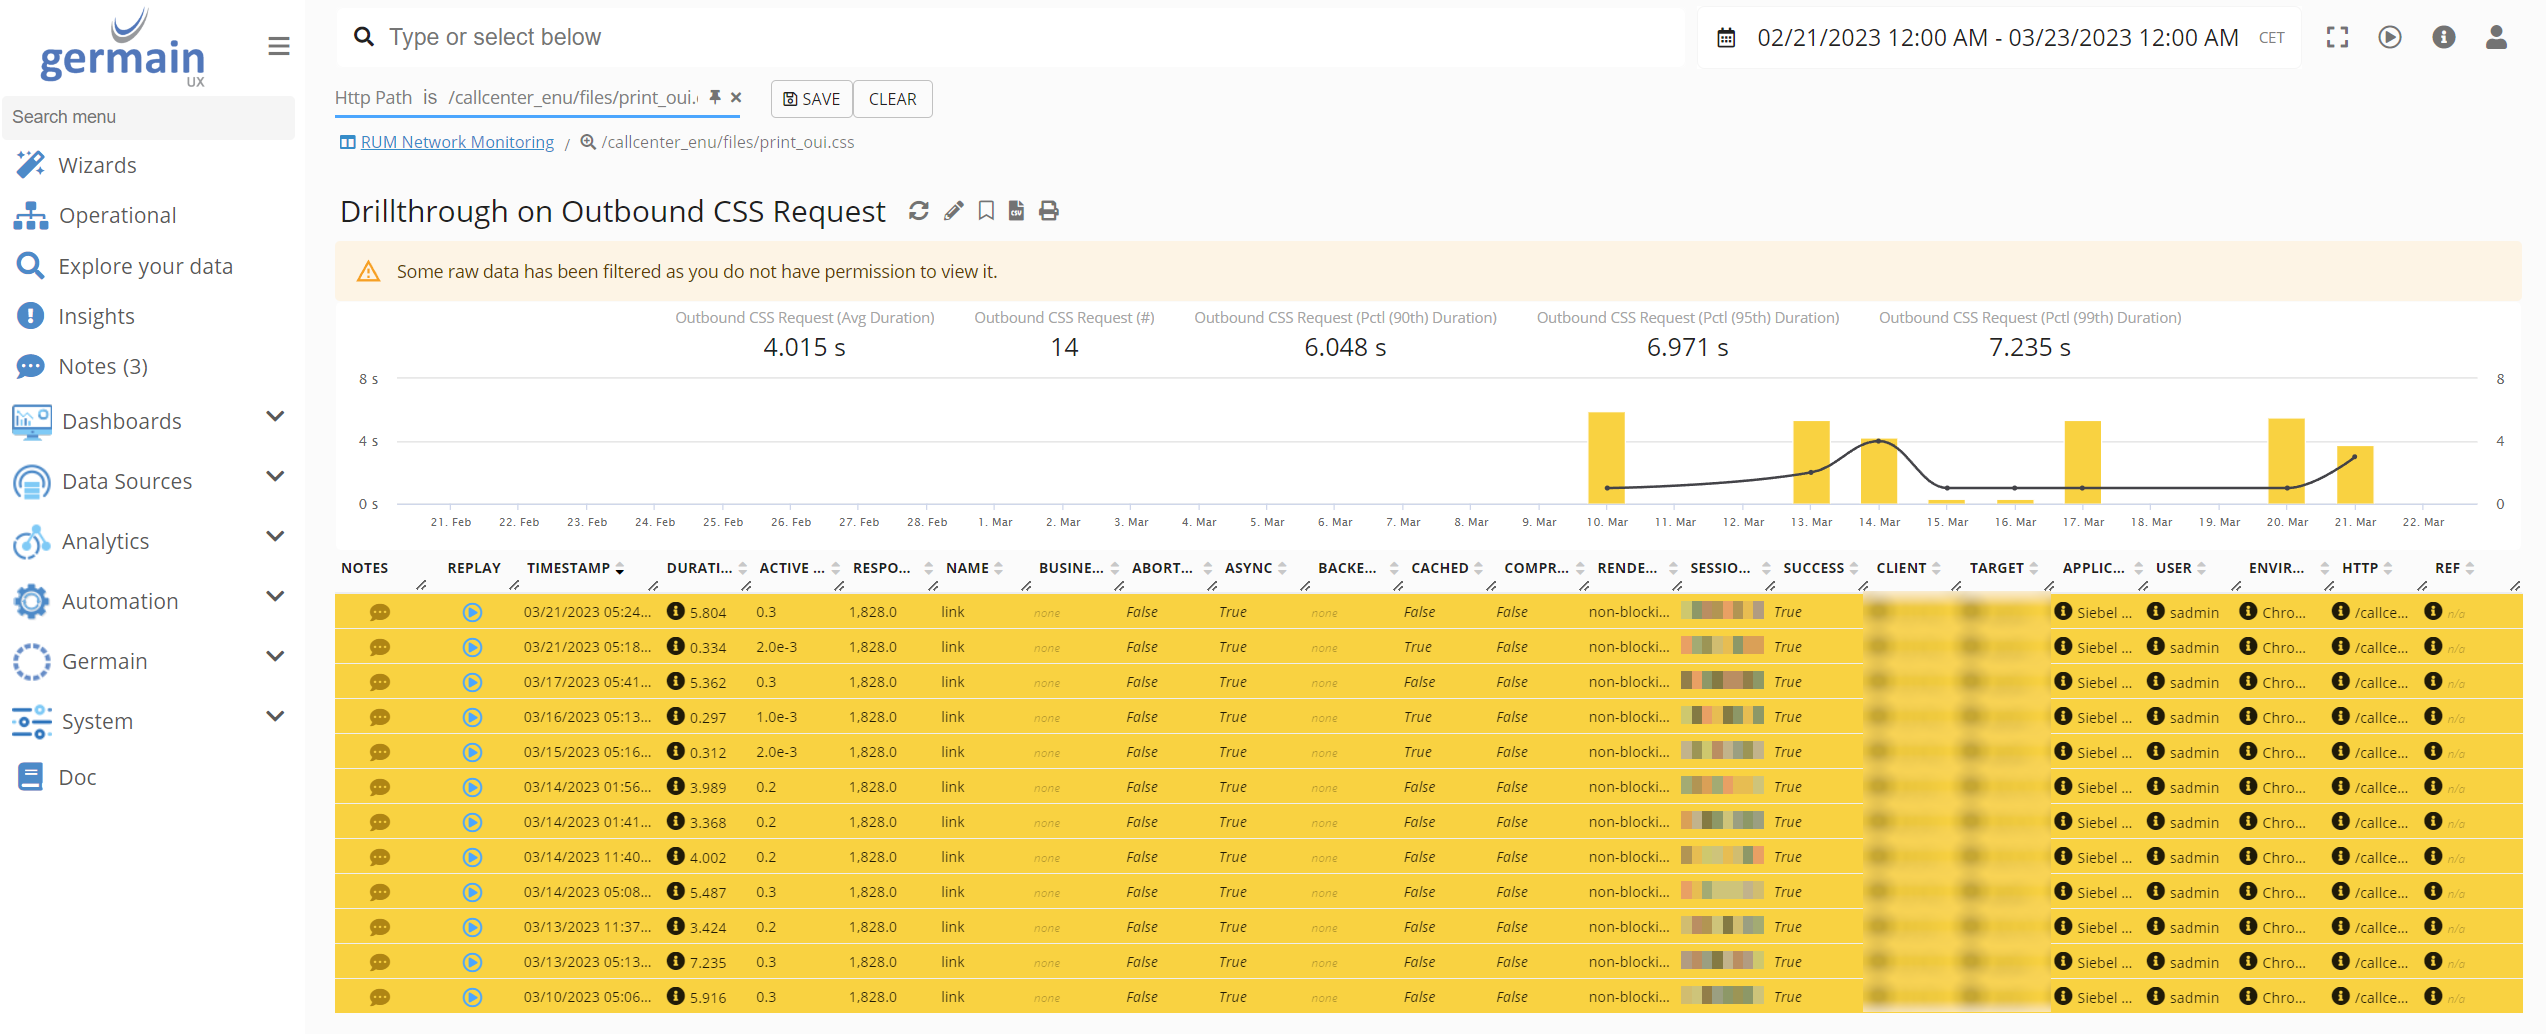
Analytics
GermainUX can analyze network requests through KPIs, measures, pivots, trends, drill-through views, and session context.
|
Analysis area |
Examples |
|---|---|
|
Availability |
Successful, failed, or unavailable requests |
|
Performance |
Duration, slow requests, and trends |
|
Impact |
Affected users, sessions, pages, and workflows |
|
Request |
URL, method, status, and available details |
|
Environment |
Application, release, browser, operating system, and device |
|
Efficiency |
Duplicate, repeated, or potentially cached requests |
|
User context |
Clicks, navigation, page activity, and Session Replay |
|
Correlation |
Front-end requests, Server Timing, and back-end transactions |
|
Code-level evidence |
JavaScript functions, resources, and browser activity |
GermainUX users can create watches to receive notifications when collected network insights meet conditions of interest.
Enable or disable monitoring
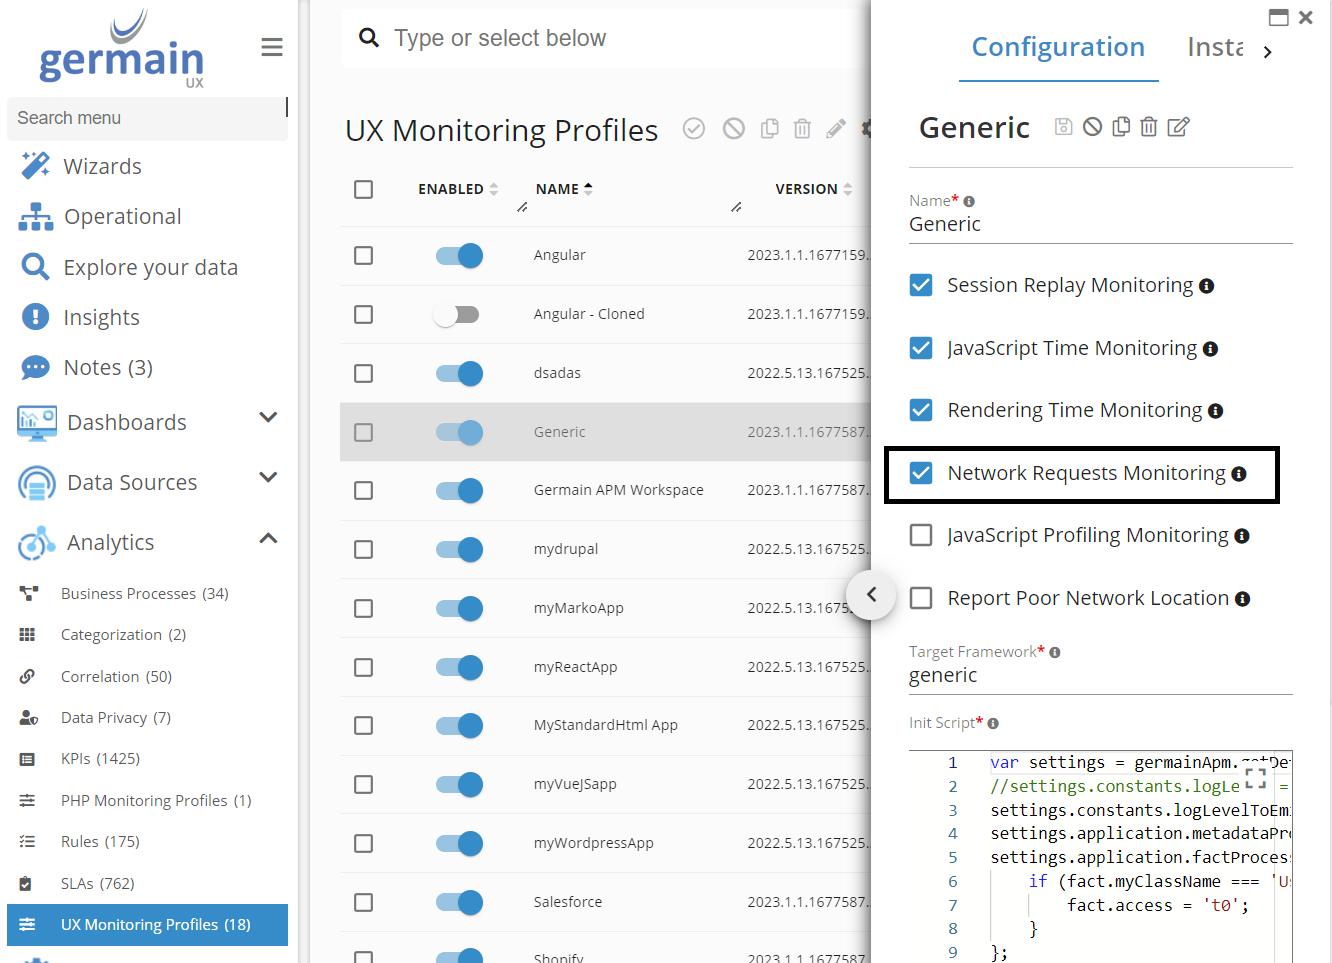
Network Request Monitoring is enabled by default.
To change its status:
-
Go to Germain Workspace > Analytics > UX Monitoring Profiles.
-
Select the applicable profile.
-
Select or clear Network Requests Monitoring.
-
Save the profile.
Request API configuration
By default, GermainUX monitors Fetch and XMLHttpRequest requests. Beacon monitoring is disabled.
The following example disables Fetch and XMLHttpRequest monitoring and enables Beacon monitoring:
const settings = germainApm.getDefaultSettings();

settings.plugins.network.monitorXHR = false;
settings.plugins.network.monitorFetch = false;
settings.plugins.network.monitorSendBeacon = true;

germainApm.start(settings);
Configure only the request mechanisms required for the application.
Request and response details
By default, GermainUX collects available request and response details. These details can contain sensitive or unnecessarily large content.
The following example disables request- and response-detail collection:
const settings = germainApm.getDefaultSettings();

settings.plugins.network.trackRequestDetails = false;
settings.plugins.network.trackResponseDetails = false;

germainApm.start(settings);
Use maxResponseBodySize to limit the size of collected response content. Content exceeding the configured limit is truncated.
const settings = germainApm.getDefaultSettings();

settings.plugins.network.maxResponseBodySize = 1024 * 1024;

germainApm.start(settings);
The default maximum response-body size is 5000 * 1024 bytes.
Exclude requests
Exclude requests that provide little diagnostic value, such as frequent heartbeat or health-check calls.
The following example excludes URLs containing heartbeat and the exact URL https://localhost/ping:
const settings = germainApm.getDefaultSettings();

settings.plugins.network.excludedUrls.push(
  /heartbeat/,
  "https://localhost/ping"
);

germainApm.start(settings);
Exclusions can use regular expressions or strings.
By default, GermainUX applies URL exclusions to the request URL. To also check the request details, enable:
const settings = germainApm.getDefaultSettings();

settings.plugins.network.checkExcludedUrlsInRequestDetails = true;

germainApm.start(settings);
Avoid inspecting request bodies for exclusions unless required, particularly when those bodies may contain sensitive information.
Duplicate-request detection
GermainUX can detect requests repeatedly executed within a short interval. Duplicate-request monitoring is enabled by default.
Default behavior:
|
Setting |
Default |
|---|---|
|
Consecutive duplicates required |
20 |
|
Maximum interval between requests |
300 milliseconds |
|
Comparison |
HTTP method and URL, including protocol, path, and query string |
The thresholds and comparison logic can be customized through settings.plugins.network.monitorDuplicates.
Duplicate requests can indicate:
-
An application loop.
-
Repeated component rendering.
-
Excessive polling.
-
Duplicate event handlers.
-
Unnecessary API traffic.
-
A user action that unintentionally submits the same request repeatedly.
Cached-request classification
Browser APIs do not always identify whether a response came from cache. GermainUX uses request duration as a heuristic.
Requests faster than cacheThresholdMillis are classified as potentially cached. The default threshold is 30 milliseconds.
This classification is an estimate and should not be treated as definitive proof that the browser served the response from cache.
Server Timing
GermainUX can collect timing information returned through the HTTP Server-Timing header. Server Timing monitoring is enabled by default.
Configuration supports:
-
Enabling or disabling Server Timing collection.
-
Restricting collection to selected timing names.
-
Defining a hierarchy of timing types.
-
Providing a custom Server Timing extractor
See Server Timing Monitoring for additional details.
Front-end-to-back-end correlation
GermainUX can add a tracking header to selected outbound requests to correlate browser activity with monitored back-end transactions.
The header is disabled by default and must only be enabled for approved URLs:
const settings = germainApm.getDefaultSettings();

settings.plugins.network.trackingEnabled = true;
settings.plugins.network.trackingUrls.push(
  /^https:\/\/api\.example\.com\//
);

germainApm.start(settings);
When enabled, GermainUX adds the germain-apm-sequence tracking header to matching requests.
Limit tracking to services that:
-
Are controlled or approved by the organization.
-
Accept the custom header.
-
Permit it through their CORS configuration.
-
Participate in the applicable GermainUX back-end monitoring.
Do not add the tracking header indiscriminately to third-party services.
Advanced processing
GermainUX supports application-specific network processing through:
|
Setting |
Purpose |
|---|---|
|
|
Modifies the network event before GermainUX generates monitoring data. |
|
|
Filters, masks, or transforms request and response content before truncation and fact processing. |
|
|
Modifies or filters the generated HTTP data point before submission. |
Use these processors to:
-
Remove sensitive values.
-
Normalize dynamic URLs.
-
Exclude non-actionable requests.
-
Categorize application-specific failures.
-
Transform request or response content.
-
Reduce duplicate or excessively detailed data.
Privacy and security
Request URLs, headers, query parameters, payloads, and responses can contain sensitive data.
Before collecting request or response details:
-
Confirm that content collection is required.
-
Disable payload or response collection when it is unnecessary.
-
Never collect passwords, authentication tokens, secrets, or payment credentials.
-
Mask or remove personal and confidential information.
-
Exclude authentication, payment, and other sensitive endpoints when appropriate.
-
Limit the maximum response size.
-
Restrict access to detailed network and session evidence.
-
Apply the organization’s retention and compliance requirements.
-
Review the configuration after application or API changes.
Recommended investigation workflow
-
Use RUM JS or the RUM Extension to identify a slow, failed, or repeated request.
-
Determine the affected applications, pages, users, sessions, and workflows.
-
Review the request duration, method, URL, status, and permitted details.
-
Correlate the request with the user’s clicks, page activity, errors, and Session Replay.
-
Review Server Timing or back-end transaction evidence when available.
-
Enable the JS Profiler for a controlled scope when deeper browser or code-level evidence is required.
-
Identify the responsible front-end code, API, service, or dependency.
-
Implement the correction.
-
Validate the result through continuous network monitoring.
Deployment and configuration
|
For your browser environment |
|---|
|
Review Browser Monitoring. |
|
Review the Browser Monitoring Deployment Overview. |
|
Deploy GermainUX RUM JS when the monitoring script can be added to the application. |
|
Deploy the GermainUX RUM Extension when direct script deployment is unavailable or access to the complete browser-page context requires an extension. |
|
Deploy the GermainUX JS Profiler for deeper network, JavaScript, and browser diagnostics. |
|
Review the available Browser Monitoring configuration. |
|
Review Server Timing Monitoring. |
|
Review WebSocket Monitoring. |
|
Review the KPIs for User Monitoring and Replay. |
|
Review the available Browser Monitoring KPIs. |
ℹ️ Get Help
The Germain Team can help you set this up. Contact GermainUX Support.
Component: JS Profiler, RUM JS, RUM Extension
Feature Availability: 2021.1 or later
Browser Support: only latest Chrome, Edge and Opera