Feature
You can create your own Aggregate, Pivot, Drillthrough or RCA dashboard.
Aggregate Dashboard Creation
Different ways to create your own Aggregate Dashboard.
Video overview: https://youtu.be/tJoPdEmqFwA?si=xWGxFwZFFJU7XioP
Explore Your Data
Log on to Germain Workspace > Left Menu > Dashboards > Create > Select keywords > Save your dashboard
Advanced Dashboard Creation
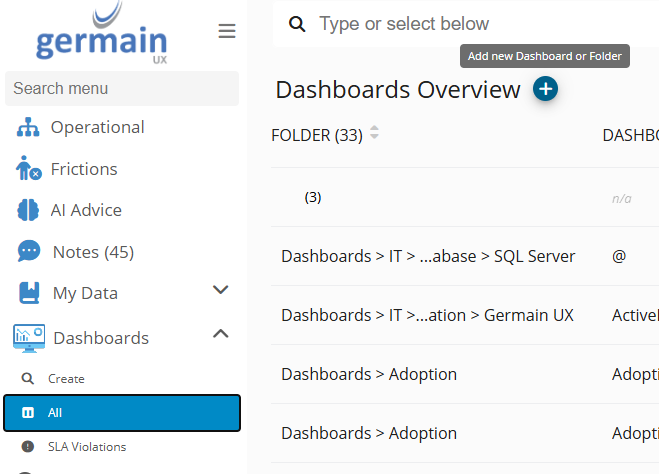
Log on to Germain Workspace > Left Menu > Dashboard > ALL
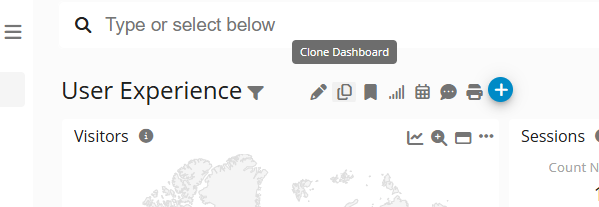
Clone an Existing Dashboard
Log on to Germain Workspace > Left Menu > Dashboard > select any dashboard you like and click “Clone”
Pivot Dashboard Creation
Pivot Dashboard are automatically generated for you, but you have the option to further customize them
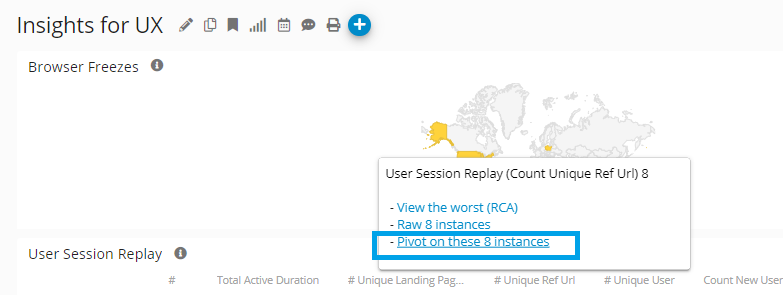
Existing Pivot Dashboards are either accessible by moving your mouse over any metrics on any Aggregate Dashboard and select <Pivot on..>:
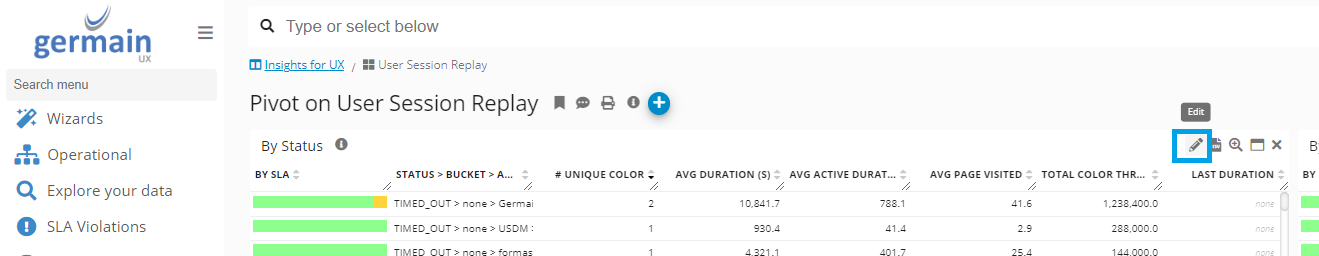
Then “Edit” existing portlet:
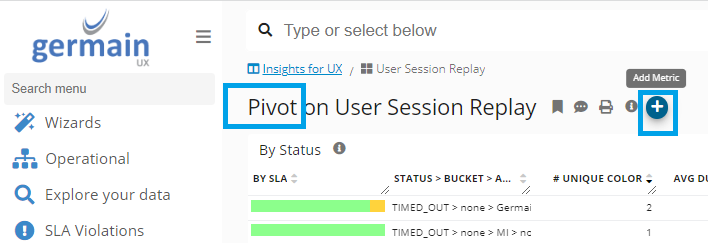
Or “Add Metric”
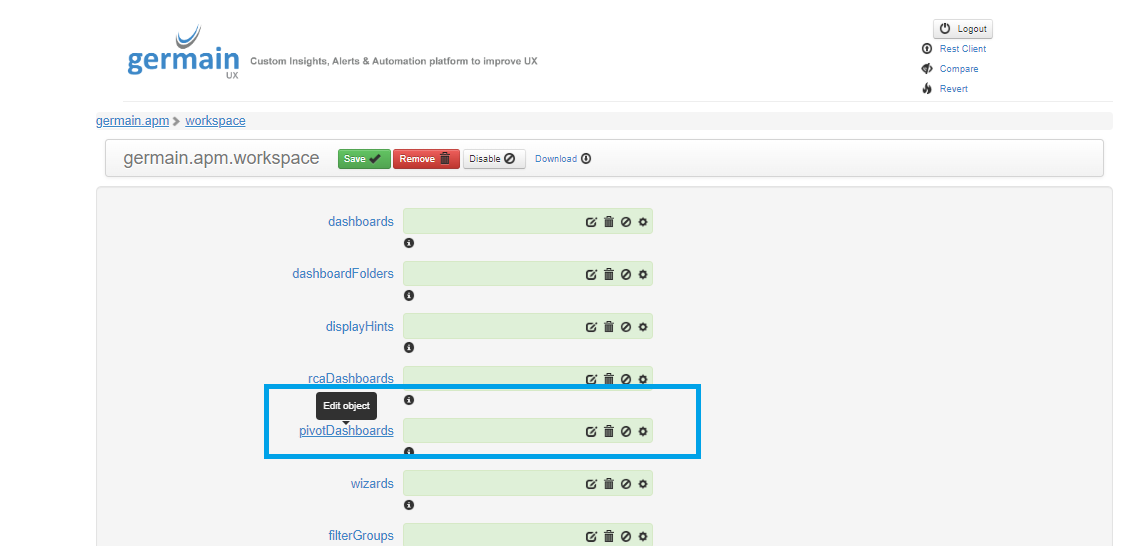
or go to the Config Console and edit Pivot Dashboard from there:
Drillthrough Dashboard Creation
Drillthrough Dashboard are automatically generated for you. but you have the option to further customize them if you like by updating the default portlet or adding new portlets
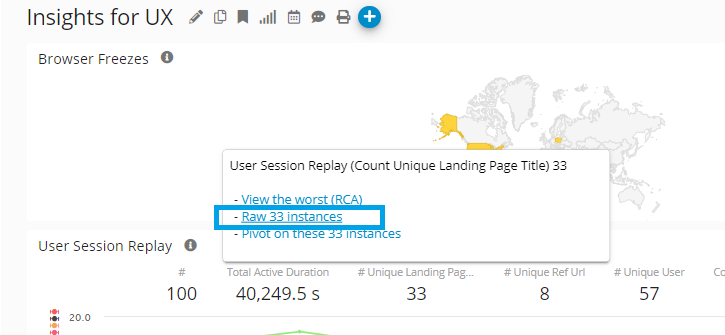
Existing Drillthrough Dashboards are either accessible by moving your mouse over any metrics on any Aggregate Dashboard, and select <Raw…>:
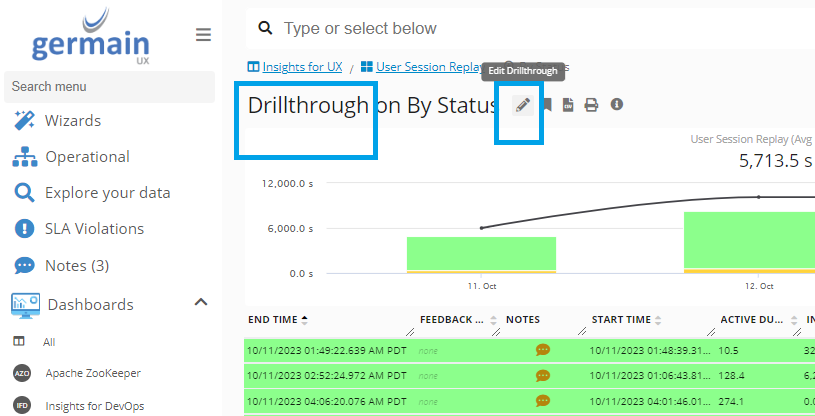
Then “Edit” existing portlet:
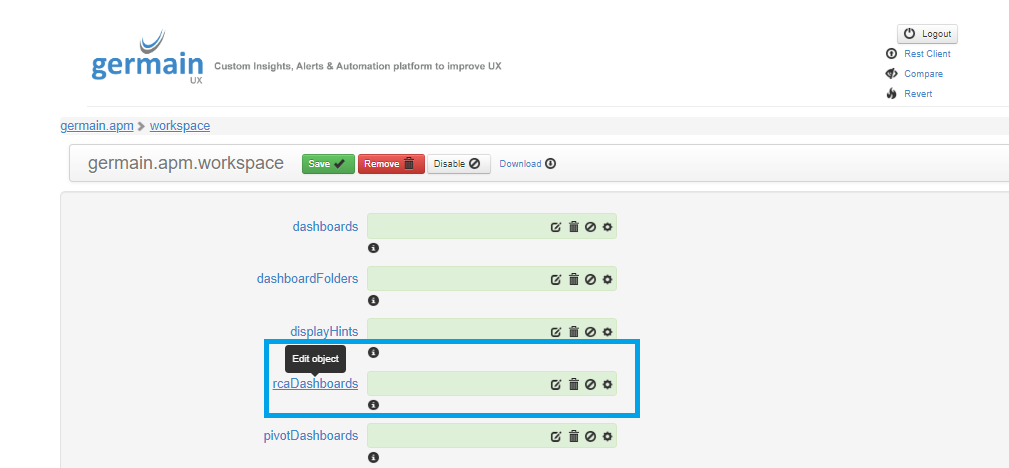
RCA Dashboard Creation
RCA Dashboards are automatically generated for you, but you have the option to further customize them.
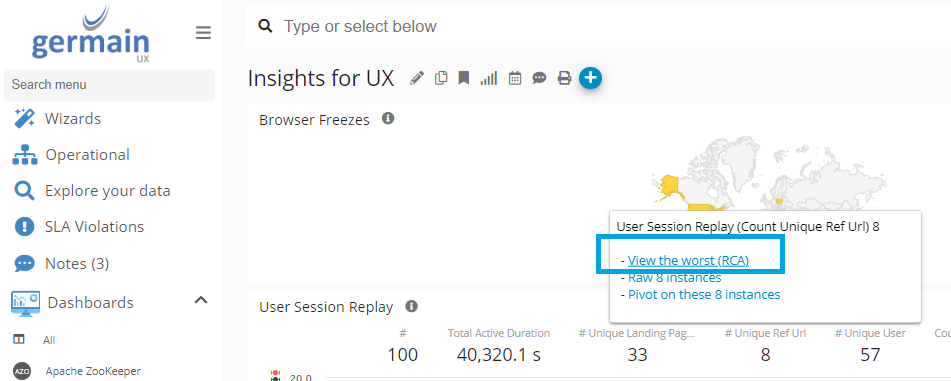
Existing RCA Dashboards are either accessible by moving your mouse over any metrics on any Aggregate Dashboard and select <View the worst (RCA)>:
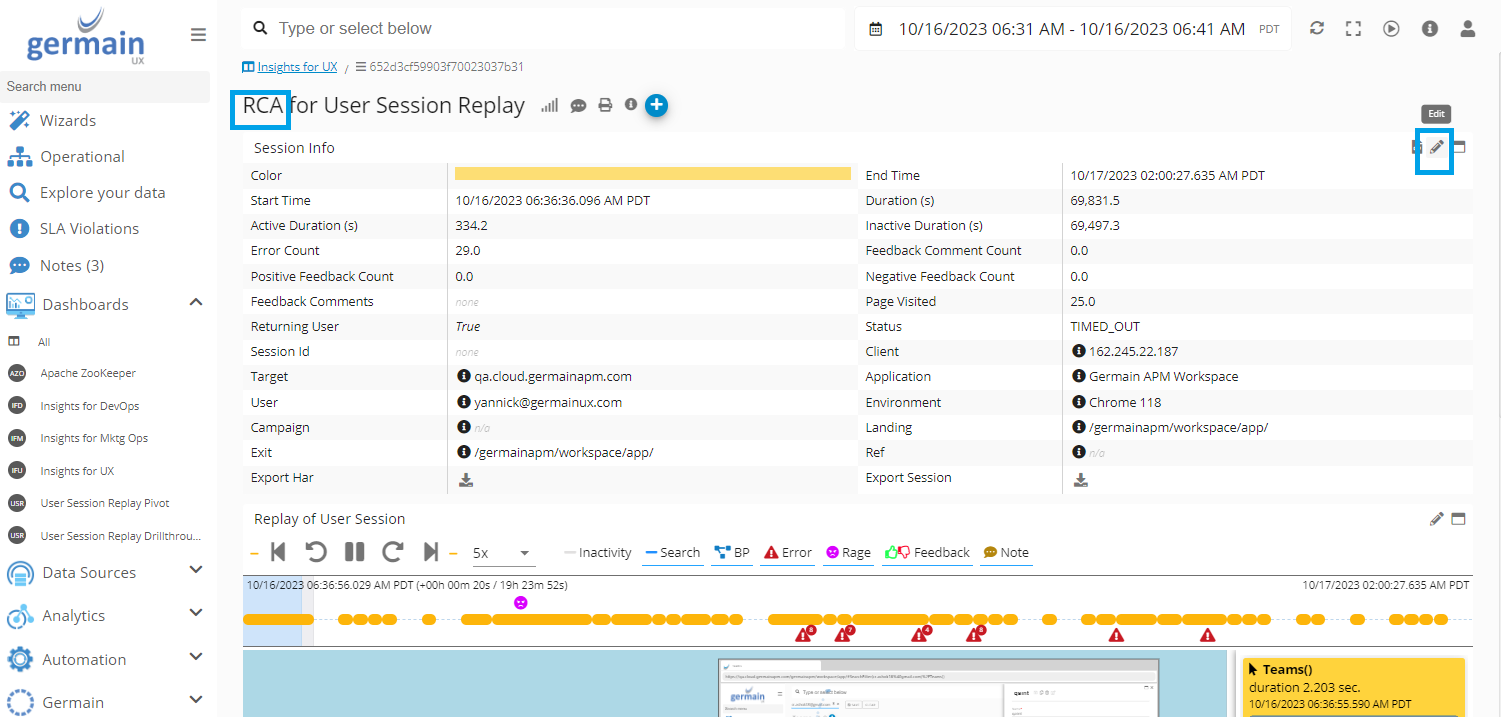
Then “Edit” existing portlet:
or go to the Config Console and edit RCA Dashboard from there: