

Android App
Monitoring & Analytics
Node.js
Monitoring & Analytics
Java & JVM (deeper insights)
Monitoring & Analytics
User Replay
Monitoring & Analytics
IIS web server
Monitoring & Analytics
Oracle KB
Monitoring & Analytics
Siebel - Error by OM
Monitoring & Analytics
Siebel - SQL Statement - raw & bound
Monitoring & Analytics
compliance & audit review
Monitoring & Analytics
Plugins available in germain APM
Monitoring & Analytics
MySQL for germain APM
Maintenance
SiteMinder support
Maintenance
Tuning Tip for Spring Boot (if using germain APM < 8.5.15)
Maintenance
minor enh & bugs (january)
Maintenance
Monitoring & Analytics - Android App
Description
Germain is now able to monitor additional metrics and events while monitoring an Android App, such as:- Crash
- Page navigation
- Transactions
Monitoring & Analytics - Node.js
Description
Germain is now able to monitor performance of NodeJS application and send alert (email/sms) for any issue. Areas/entities that Germain monitors and provides insights on while monitoring a NodeJS application, in the case you use Node.js as an application server (on the other end, if you are using Node.js as a front-end, the below list of benefit may or not apply and all you need to do to enable that monitoring is to declare our 2 javascripts within your node.js app, and we can provide more details if needed):- Crash monitoring and analysis
- Disk monitoring
- Error monitoring (crash, etc)
- Event loop performance monitoring
- Exception monitoring
- Exit monitoring
Show all 20
Show all 20
- Express monitoring
- Heap size and heap usage monitoring for node.js process
- Integrate existing generic monitoring features
- Load average monitoring
- Logging integration
- MarkoJS app name extractor
- MultipleResolves monitoring
- Network / incoming and outgoing HTTP monitoring
- OS monitoring
- Promises rejection monitoring (Unhandled promise rejections, etc).
- Startup duration monitoring
- Tagging requests from UX and extract on node.js
- Transaction monitoring
- Warning monitoring (bad coding practices, bugs, or security vulnerabilities),
- Configuration for the session extractors
- NPM deployment
- Email Alert (generic, preconfigured for NodeJS, and configurable)
Installation & Configuration
Node.jsSupport
Node.js 8.0.0 and above.Monitoring & Analytics - Java & JVM (deeper insights)
Description
Re-designed and enhanced germain Germain’s Java & JVM monitoring feature. Customers can now monitor the execution duration of any java method / service through code injection. Our past/old Java monitoring capability was just doing sampling CPU profiling (i.e., check every N milliseconds to see which function is currently active and accumulate that over time). Code injection provides a significantly better accuracy and greater depth when it comes to identifying slow or inefficient java methods. Features:- Call(s) per Service
- Events monitoring
- Inbound & outbound HTTP monitoring
- Inbound & outbound JMS monitoring
- Session ID self-populate on inbound HTTP requests
- Support for generating metrics collection
- SQL execution
- Transactions monitoring
Benefits
Greater depth of insights to help identify bottlenecks that prevent a Java application to be available or be fastPerformance Impact
Small/negligibleperformance impact on the monitored application. Here are some details about the load tests we performed on our labs, to understand how much of an impact this newly enhanced java monitoring mechanism may cause on a monitored application Test scenario & result: 50 concurrent users browsing germain Germain dashboard and config console + 300 users using a CRM web application and being monitored by germain Germain engines & js scripts) CPU Increase: 0.5% increase in CPU Memory increase: < 50 MB Response time (average overhead / request) HTTP requests: +0.26ms Generic Java method: +0.35ms SQL statements: +0.37ms SQL Prepared statement: +1.5msConfiguration
Java Operational Experience IntelligenceExample
RCA for Inbound Java request > custom java method call > SQL query execution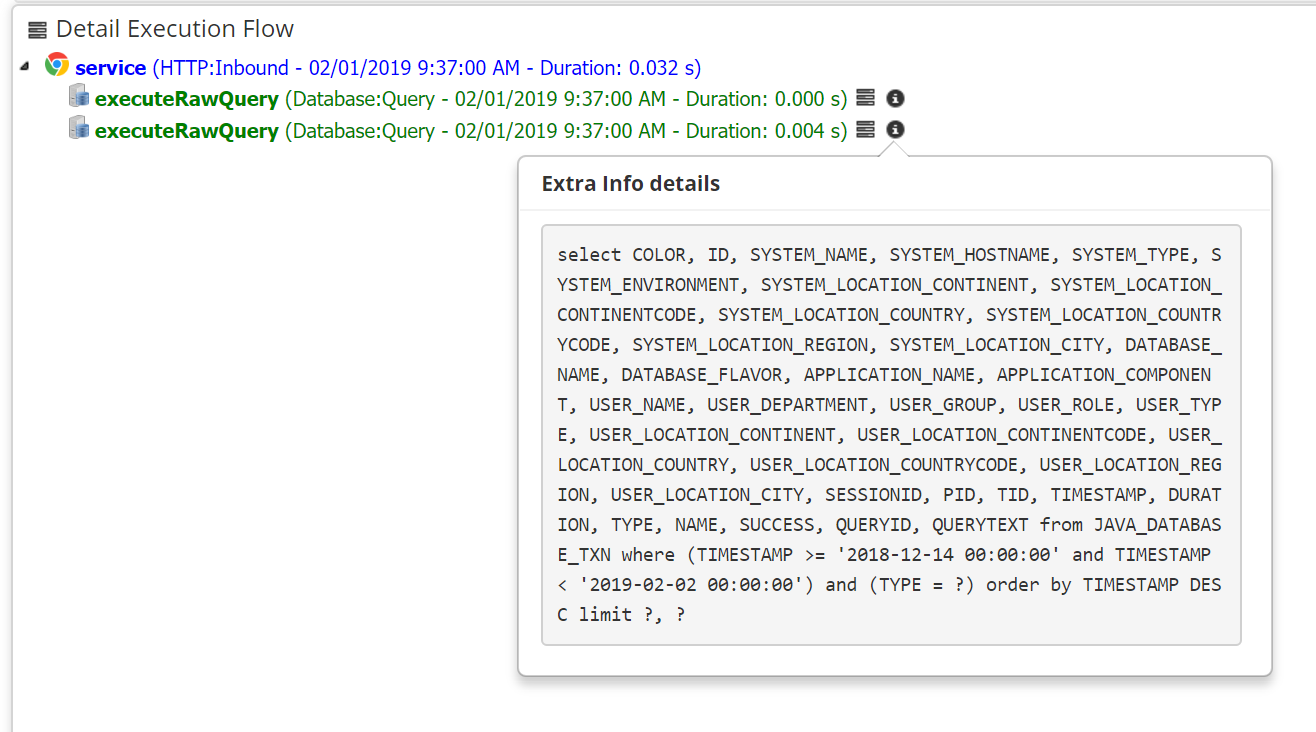
- and all these other benefits and visualizations are still available: Monitoring & Analytics - Java & Weblogic
- and there is more to come in February and March of 2019 - stay tuned…🙂
Monitoring & Analytics - User Replay
Description
As announced last month, we have released a re-designed and enhanced version of our Real User Session Replay feature. Here is below an example of User Session Replay for a Siebel CRM (we added that video example a week after announcing the 12/31/19 release notes.Monitoring & Analytics - IIS web server
Description
Enhanced IIS monitoring and now provide:- User Agent, Method, …monitoring and raw data extract available.
- Requests
- Errors
- Warnings
Example
Monitoring & Analytics - Oracle KB
Description
Synthetic Transaction against Oracle Knowledge Base management (https://www.oracle.com/applications/knowledge-management.html), is now preconfigured in OOTB GermainBenefit
Detect availability or performance issue with Oracle Knowledge Base managementMonitoring & Analytics - Siebel - Error by OM
Description
Added OOTB a portlet that views siebel error by object manager…this was a 5min job, but FYI it is available in Germain 8.5.15 onwards.Monitoring & Analytics - Siebel - SQL Statement - raw & bound
Description
Germain now reports RAW and BOUND SQL statement. that is currently configured for Siebel and the Siebel log level have to be set accordingly. And as a reminder and as an alternative, SQL statements are also monitored directly from within the database (Oracle, SQL srvr, DB2 UDB, MySql, etc).Benefit
Time saving for DBAs that need these to tune slow SQL statements.Example
Monitoring & Analytics - compliance & audit review
Description
One of our clients needs to provide data from its CRM application to another system for Compliance review & Auditing. Specifically, client is planning to query Germain datamart to pull out data and send it to its compliance repository. Some of the data that is going to be pulled out of the Germain datamart:- Successful Logon Attempts
- Logoff
- Failed Logon Attempts
- Authorization Failures
- Input validation errors (CRM application errors when user inputs invalid data)
- Logging Failures (gaps in logging)
Show all 18
Show all 18
- Unexpected service stop
- Log(Disk) storage capacity exceeded
- Saved browsers (which browsers accessed system)
- Administrator Activities
- All activities while logged in as administrator
- System start-up
- System shut-down
- Log service start
- Log service stop
- Changes to system (CRM configuration changes, etc)
- Change of CRM logging level
- etc
Monitoring & Analytics - Plugins available in germain APM
We updated the list of technologies we have configured Germain for: https://germainux.com/pluginsMaintenance - MySQL for germain APM
Description FYI. For some of our AWS cloud customers using MySQL as datastore for Germain, and with almost no tuning, we are reaching 4k inserts per second in MySQL (2kb insert size in average).
- Oracle DB
- DB2 UDB
- Sql Server
- MySQL
- MemSQL, in-memory db technology)
Maintenance - SiteMinder support
Description
UX through siteminder url, to be able to securely monitor User Experience of an application using a public URLMaintenance - Tuning Tip for Spring Boot (if using germain APM < 8.5.15)
Issue
Our Spring Boot service (used for Session Replay) was crashing running out of memory generating this exception: Exception:2019-01-26 17:44:00,006 INFO SessionTrackingService - Processed 130 sessions. - [pool-2-thread-1] 2019-01-26 17:44:03,733 ERROR FileBackedStorageEngine - Failed to allocate a direct buffer for a FileChannel write. Consider increasing the -XX:MaxDirectMemorySize property to allow enough space for the FileChannel transfer buffers - [Ehcache [_default_]-1147] 2019-01-26 17:44:04,633 ERROR FileBackedStorageEngine - Failed to allocate a direct buffer for a FileChannel write. Consider increasing the -XX:MaxDirectMemorySize property to allow enough space for the FileChannel transfer buffers - [Ehcache [_default_]-1148] 2019-01-26 17:44:58,060 INFO SessionCache - Flushing stale sessions before: 2019-01-26T16:44:58.060 - [pool-2-thread-1] 201
Tuning solution
Please apply this tuning recommendation to your environment if you are on Germain 8.5.14 or prior: Add parameter -Djdk.nio.maxCachedBufferSize=262144to the session services to prevent them from caching large files in memory in these files: Windows: $germain/…/ServiceDistribution/src/main/bin/GermainSessionTrackingServices.xml Unix: $germain/…/ServiceDistribution/src/main/bin/session-tracking/GermainSessionTrackingServices.xml Java options would look like this: …/… JAVA_OPTS=“-Xms2g -Xmx4g -XX:+CrashOnOutOfMemoryError -Djdk.nio.maxCachedBufferSize=262144” …/…Maintenance - minor enh & bugs (january)
Description
Bugs and optimizations implemented this month (more details available upon request):Get Help
Contact GermainUX Support
The Germain Team can help you set this up.
Can't find what you need?
Search all GermainUX docs with Ctrl + K, or use the feedback buttons at the bottom of this page to tell us what is missing.
The content of this document is proprietary to GERMAIN SOFTWARE LLC.