
⚙️ Server Timing Monitoring
GermainUX collects server-side performance metrics returned with HTTP responses through the standard Server-Timing header. These metrics help teams understand how back-end processing contributes to the response time experienced by real users.
Server Timing Monitoring is enabled by default for each User Monitoring Profile as part of Network Request Monitoring. The monitored application or service must return a valid Server-Timing response header for server-side metrics to be available.
🔎 Monitoring components
|
Component |
Role |
|---|---|
|
Collects Server Timing metrics from browser HTTP responses when the monitoring script can be deployed in the application. |
|
|
Provides browser and Server Timing monitoring when RUM JS cannot be deployed directly or access to the complete page context requires an extension. |
|
|
Provides deeper network, JavaScript, resource-loading, and browser evidence when a slow request requires detailed investigation. |
How it works
The monitored server adds performance metrics to an HTTP response:
Server-Timing: database;dur=120, application;dur=75, cache;dur=8
In this example:
|
Metric |
Duration |
|---|---|
|
Database |
120 ms |
|
Application |
75 ms |
|
Cache |
8 ms |
GermainUX collects the available metrics and associates them with the corresponding browser request, page, user, and session.
The metric names and values are produced by the monitored server. GermainUX cannot provide server-processing breakdowns when the application does not return them.
Capabilities
GermainUX can:
-
Collect metrics exposed through the
Server-Timingresponse header. -
Associate each server metric with its originating HTTP request.
-
Compare browser-request duration with the available server-processing duration.
-
Analyze individual server phases such as application, database, cache, or integration processing.
-
Restrict collection to approved Server Timing metric names.
-
Organize related metrics into an application-specific hierarchy.
-
Use a custom extractor when the default Server Timing extraction does not meet the application’s requirements.
-
Correlate Server Timing data with users, sessions, pages, workflows, errors, and other browser activity.
-
Use the JS Profiler for deeper investigation of the browser and JavaScript activity surrounding a slow request.
Default monitoring
|
Capability |
Default |
|---|---|
|
Server Timing Monitoring |
Enabled |
|
Collection of available metric names |
All metrics |
|
Metric hierarchy |
Not configured |
|
Custom extractor |
Not configured |
No GermainUX customization is required when the server returns standard Server Timing headers and all exposed metrics should be collected.
Business benefits
Server Timing Monitoring helps organizations:
-
Determine whether a slow user interaction is caused by browser, network, or server processing.
-
Identify which server-side operation contributes most to a request’s duration.
-
Find database, application, cache, or integration bottlenecks visible to real users.
-
Prioritize back-end problems according to affected users and business workflows.
-
Reduce the time required to correlate browser complaints with server performance.
-
Compare server performance across pages, APIs, releases, and user populations.
-
Validate whether a server-side correction improved the actual user experience.
Continuous monitoring
GermainUX RUM JS or the GermainUX RUM Extension collects Server Timing metrics as part of browser Network Request Monitoring.
Use:
-
RUM JS when the GermainUX monitoring script can be deployed directly in the application.
-
RUM Extension when direct script deployment is unavailable or access to the required browser context requires an extension.
The browser and monitored service must make the Server Timing information available to the page. Cross-origin services may require appropriate response-header and resource-timing access configuration.
Deeper investigation with JS Profiler
When Server Timing identifies a slow request, the GermainUX JS Profiler can provide additional browser-side evidence, including:
-
JavaScript functions associated with the request.
-
Function execution time.
-
Network requests and resource loading.
-
Long-running browser tasks.
-
JavaScript errors and stack traces.
-
Browser events and user interactions.
-
DOM and rendering activity.
-
Application, page, workflow, and session context.
The JS Profiler complements Server Timing Monitoring. It does not create missing server-side measurements; those must be generated by the responding application or service.
Analytics
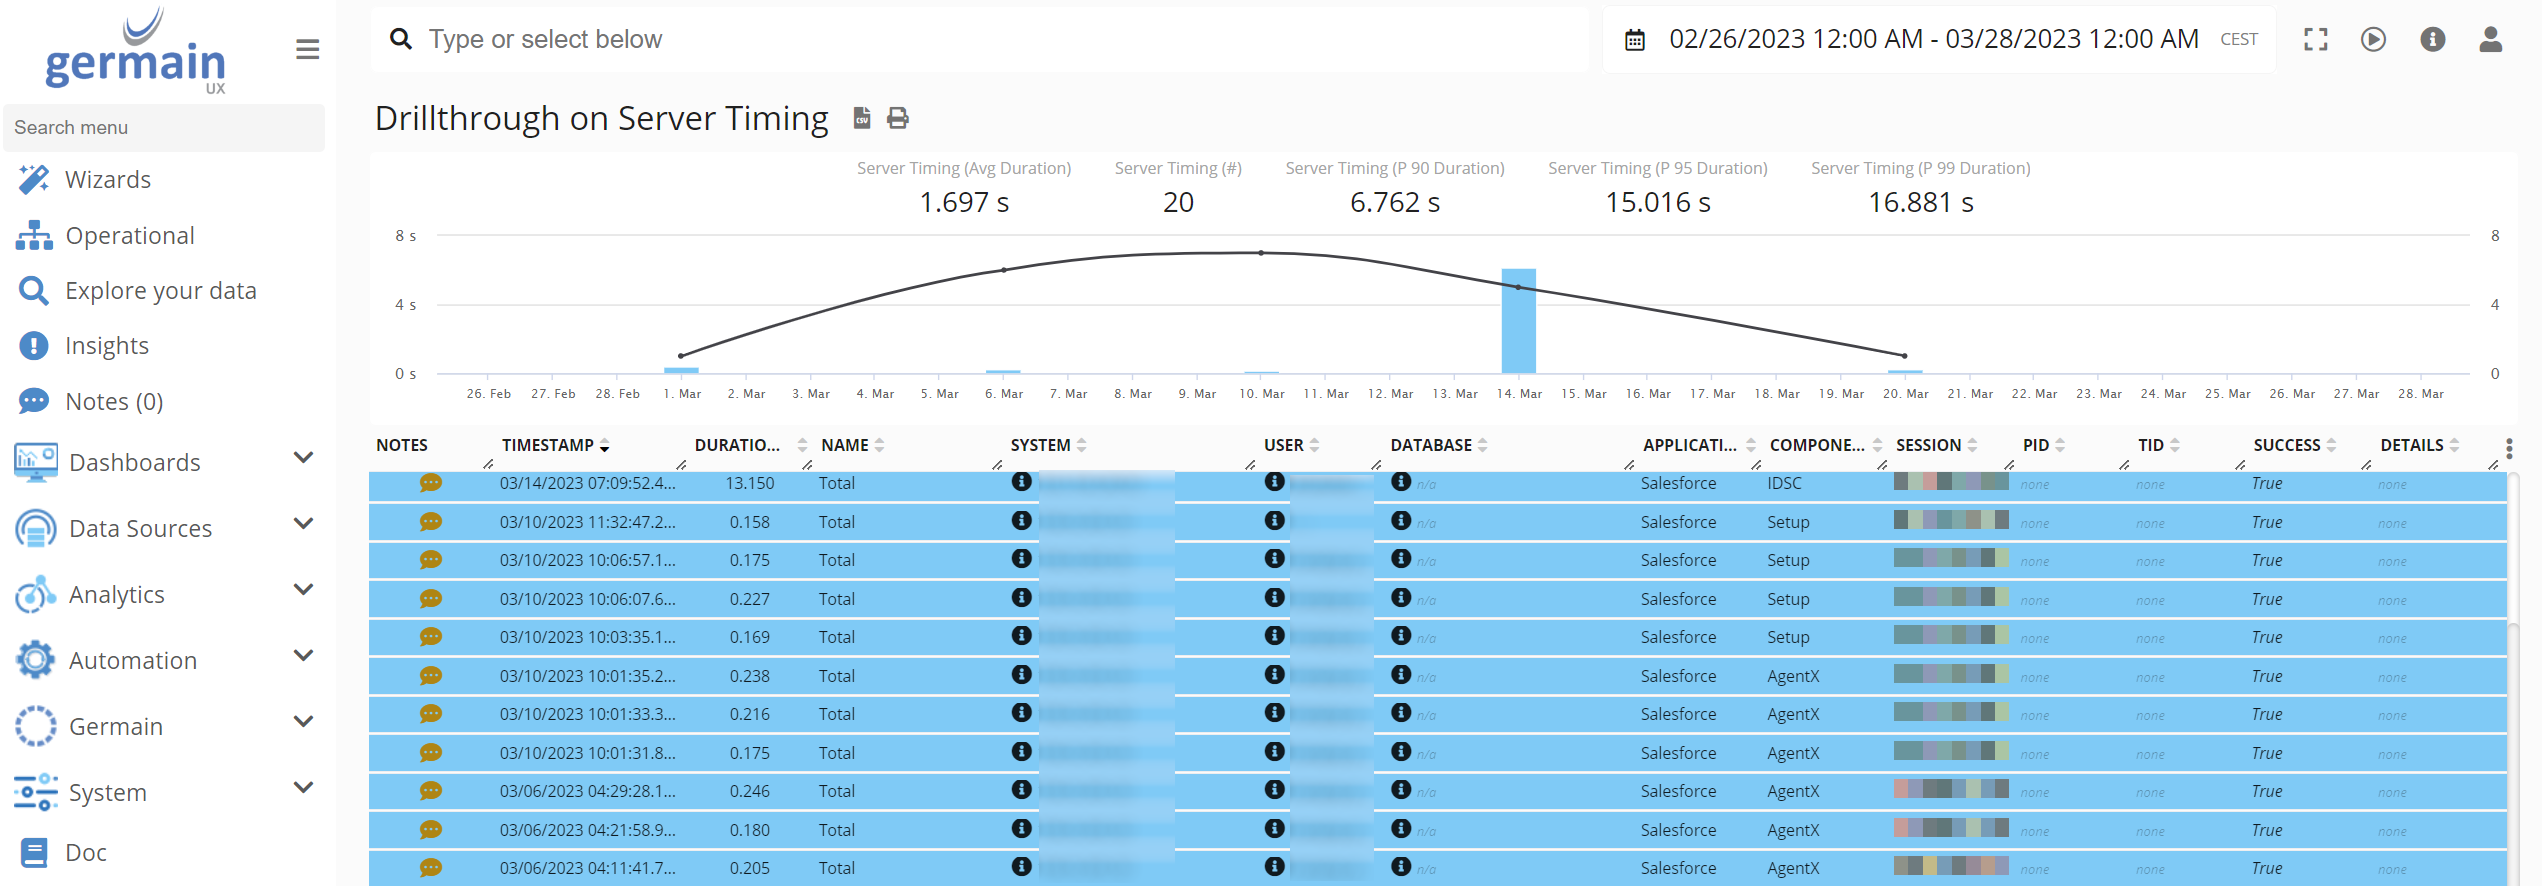
GermainUX can analyze Server Timing metrics through KPIs, measures, pivots, trends, drill-through views, and session context.
|
Analysis area |
Examples |
|---|---|
|
Request performance |
Total browser-observed request duration |
|
Server processing |
Duration of each metric returned by the server |
|
Bottleneck |
Application, database, cache, integration, or another exposed phase |
|
Impact |
Affected users, sessions, pages, and workflows |
|
Environment |
Application, API, release, browser, and device |
|
User context |
Clicks, navigation, page activity, and Session Replay |
|
Technical context |
Network failures, JavaScript errors, resources, and long tasks |
GermainUX users can create watches to receive notifications when collected Server Timing insights meet conditions of interest.
Server configuration
Instrument the applicable application, API, proxy, or service to return a valid Server-Timing response header.
For example:
Server-Timing: database;dur=120;desc="Database query",
 application;dur=75;desc="Application processing"
Use stable metric names so GermainUX can consistently aggregate and compare measurements over time.
Do not include sensitive information in metric names or descriptions.
Enable or disable monitoring
Server Timing Monitoring is controlled through Network Request Monitoring.
To change its status:
-
Go to Germain Workspace > Analytics > UX Monitoring Profiles.
-
Select the applicable profile.
-
Select or clear Network Requests Monitoring.
-
Save the profile.
Disabling Network Request Monitoring also prevents the collection of Server Timing metrics associated with those requests.
Collect selected metric types
By default, GermainUX collects all available Server Timing metric names. Use allowedTypes to restrict collection to approved metrics:
const settings = germainApm.getDefaultSettings();

settings.plugins.network.serverSideTimingsMonitoring = {
  enabled: true,
  allowedTypes: [
    "application",
    "database",
    "cache"
  ]
};

germainApm.start(settings);
Metric names must match those returned in the Server-Timing header.
Disable Server Timing collection only
Server Timing collection can be disabled without disabling all network-request monitoring:
const settings = germainApm.getDefaultSettings();

settings.plugins.network.serverSideTimingsMonitoring.enabled = false;

germainApm.start(settings);
Network requests can continue to be monitored without their Server Timing breakdown.
Metric hierarchy
Use typesHierarchy when application-specific Server Timing metrics need to be organized into logical groups:
const settings = germainApm.getDefaultSettings();

settings.plugins.network.serverSideTimingsMonitoring = {
  enabled: true,
  typesHierarchy: {
    backend: [
      "application",
      "database",
      "cache"
    ]
  }
};

germainApm.start(settings);
The hierarchy should reflect the metric names and organization used by the monitored application.
Custom extraction
Use a custom extractor when Server Timing values require application-specific processing:
extractor?: (
  entry: PerformanceResourceTiming,
  event?: NetworkMonitoringEvent
) => ServerTiming[];
A custom extractor can normalize metric names, select specific values, or adapt nonstandard application behavior. Use it only when the default extraction is insufficient.
Privacy and security
Server Timing headers are visible to the browser and may be visible to users through browser developer tools.
When defining server metrics:
-
Do not expose credentials, tokens, internal hostnames, database statements, personal information, or secrets.
-
Use general and stable metric names.
-
Avoid revealing unnecessary infrastructure details.
-
Restrict cross-origin exposure appropriately.
-
Review metric descriptions for sensitive information.
-
Apply the organization’s security and compliance requirements.
Server Timing should expose performance measurements—not confidential diagnostic content.
Recommended investigation workflow
-
Use RUM JS or the RUM Extension to identify a slow browser request.
-
Review the Server Timing breakdown returned for that request.
-
Determine whether the delay occurred in the application, database, cache, integration, or another exposed server phase.
-
Identify the affected users, sessions, pages, and business workflows.
-
Correlate the request with Session Replay, errors, and other browser activity.
-
Use the JS Profiler when deeper browser or JavaScript evidence is required.
-
Review corresponding server-side monitoring, logs, or transactions when available.
-
Correct the responsible application component or dependency.
-
Validate the correction through continuous Server Timing and Network Request Monitoring.
Deployment and configuration
|
For your browser and server environment |
|---|
|
Review Browser Monitoring. |
|
Review the Browser Monitoring Deployment Overview. |
|
Deploy GermainUX RUM JS when the monitoring script can be added to the application. |
|
Deploy the GermainUX RUM Extension when direct script deployment is unavailable or access to the complete browser-page context requires an extension. |
|
Deploy the GermainUX JS Profiler for deeper JavaScript, network, and browser diagnostics. |
|
Configure the monitored application or service to return approved |
|
Review Network Request Monitoring. |
|
Review the available Browser Monitoring configuration. |
|
Review the KPIs for User Monitoring and Replay. |
|
Review the available Browser Monitoring KPIs. |
ℹ️ Get Help
The Germain Team can help you set this up. Contact GermainUX Support.
Component: JS Profiler, RUM JS, RUM Extension
Feature Availability: 2021.1 or later
Browser Support: only latest Chrome, Edge and Opera