DB2 UDB Monitoring
Features for DB2
Germain can be configured to monitor availability and performance of DB2 database servers.
Database availability
Monitor the availability of the DB2 database to ensure it is up and running. Track uptime and receive alerts if the database goes down or experiences any connectivity issues.
Performance metrics
Monitor key performance metrics of the DB2 database, including CPU usage, memory utilization, disk I/O, and network traffic. These metrics help identify any bottlenecks or resource constraints that could impact the performance of the database.
Query performance
Monitor the performance of SQL queries executed against the DB2 database. Track metrics such as query response time, execution plans, and index usage. Identify slow-running queries and optimize their performance to improve overall database efficiency.
Database connections
Monitor the number of active database connections and track connection usage. Identify any connection leaks or excessive connections that could impact the performance and scalability of the database.
Disk space and tablespace utilization
Monitor the disk space usage of the DB2 database and its tablespaces. Ensure that there is sufficient disk space available for data storage and log files. Identify any tablespaces that are running out of space and take necessary actions to prevent data issues.
Locking and concurrency
Monitor locks and concurrency within the DB2 database. Identify any lock contention issues that could lead to performance degradation or data inconsistency. Track the number of lock timeouts and deadlocks to optimize transaction concurrency.
Backup and recovery
Monitor the backup and recovery processes of the DB2 database. Ensure that regular backups are performed successfully and monitor the backup completion status. Track recovery times in case of any database failures or data corruption.
Error and event logs
Monitor DB2 error logs and event logs to identify and resolve any issues or errors that occur within the database. Log and track error messages, warnings, and informational events for troubleshooting and proactive maintenance.
For basic monitoring of a single instance, Germain uses a regular database user account with CONNECT permissions.
In order to perform more in-depth monitoring, the database user needs to be granted additional permissions to execute queries against a series of system views and tables.
Please note that Germain can monitor any other DB2 tables (system or data) i.e. the above requirements are the bare minimum requirements yet can be extended to any other tables. Germain User permissions:
Table / View | Permission |
|---|---|
SYSIBMADM.TBSP_UTILIZATION | SELECT |
SYSIBMADM.LOG_UTILIZATION | SELECT |
SYSIBMADM.LOCKS_HELD | SELECT |
SYSIBMADM.LOCKWAITS | SELECT |
SYSIBMADM.APPL_PERFORMANCE | SELECT |
SYSIBMADM.BP_HITRATIO | SELECT |
SYSIBMADM.APPLICATIONS | SELECT |
SYSIBMADM.LONG_RUNNING_SQL | SELECT |
For more detailed information, please reach out to us. We will provide you with specific guidance and assistance tailored to your needs.
Configuration
Go to Germain Workspace > Left Menu > Wizard > DB2 UDB
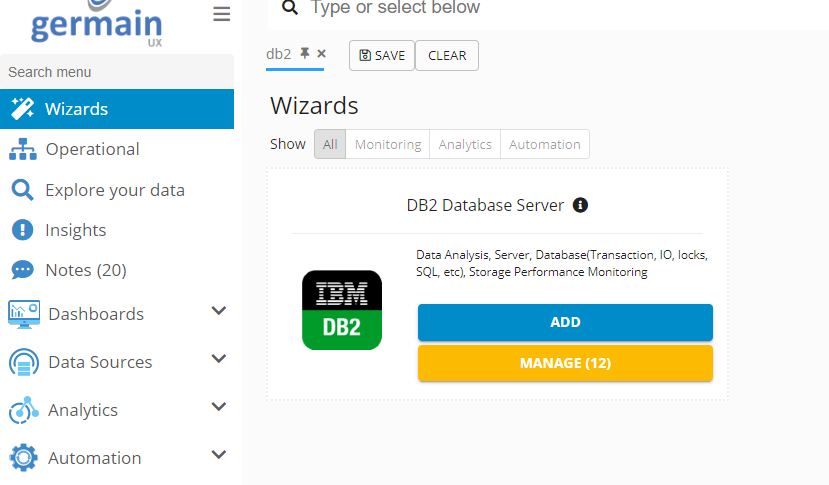
DB2 Database Wizard - Germain UX
Add Database as Data Source
Germain workspace > Left Menu > Data Sources > Database > Add New Configuration

Add DB2 Database as Data Source - Germain UX
Add DB Credentials
Germain Workspace > Left Menu > Data Sources > Credentials
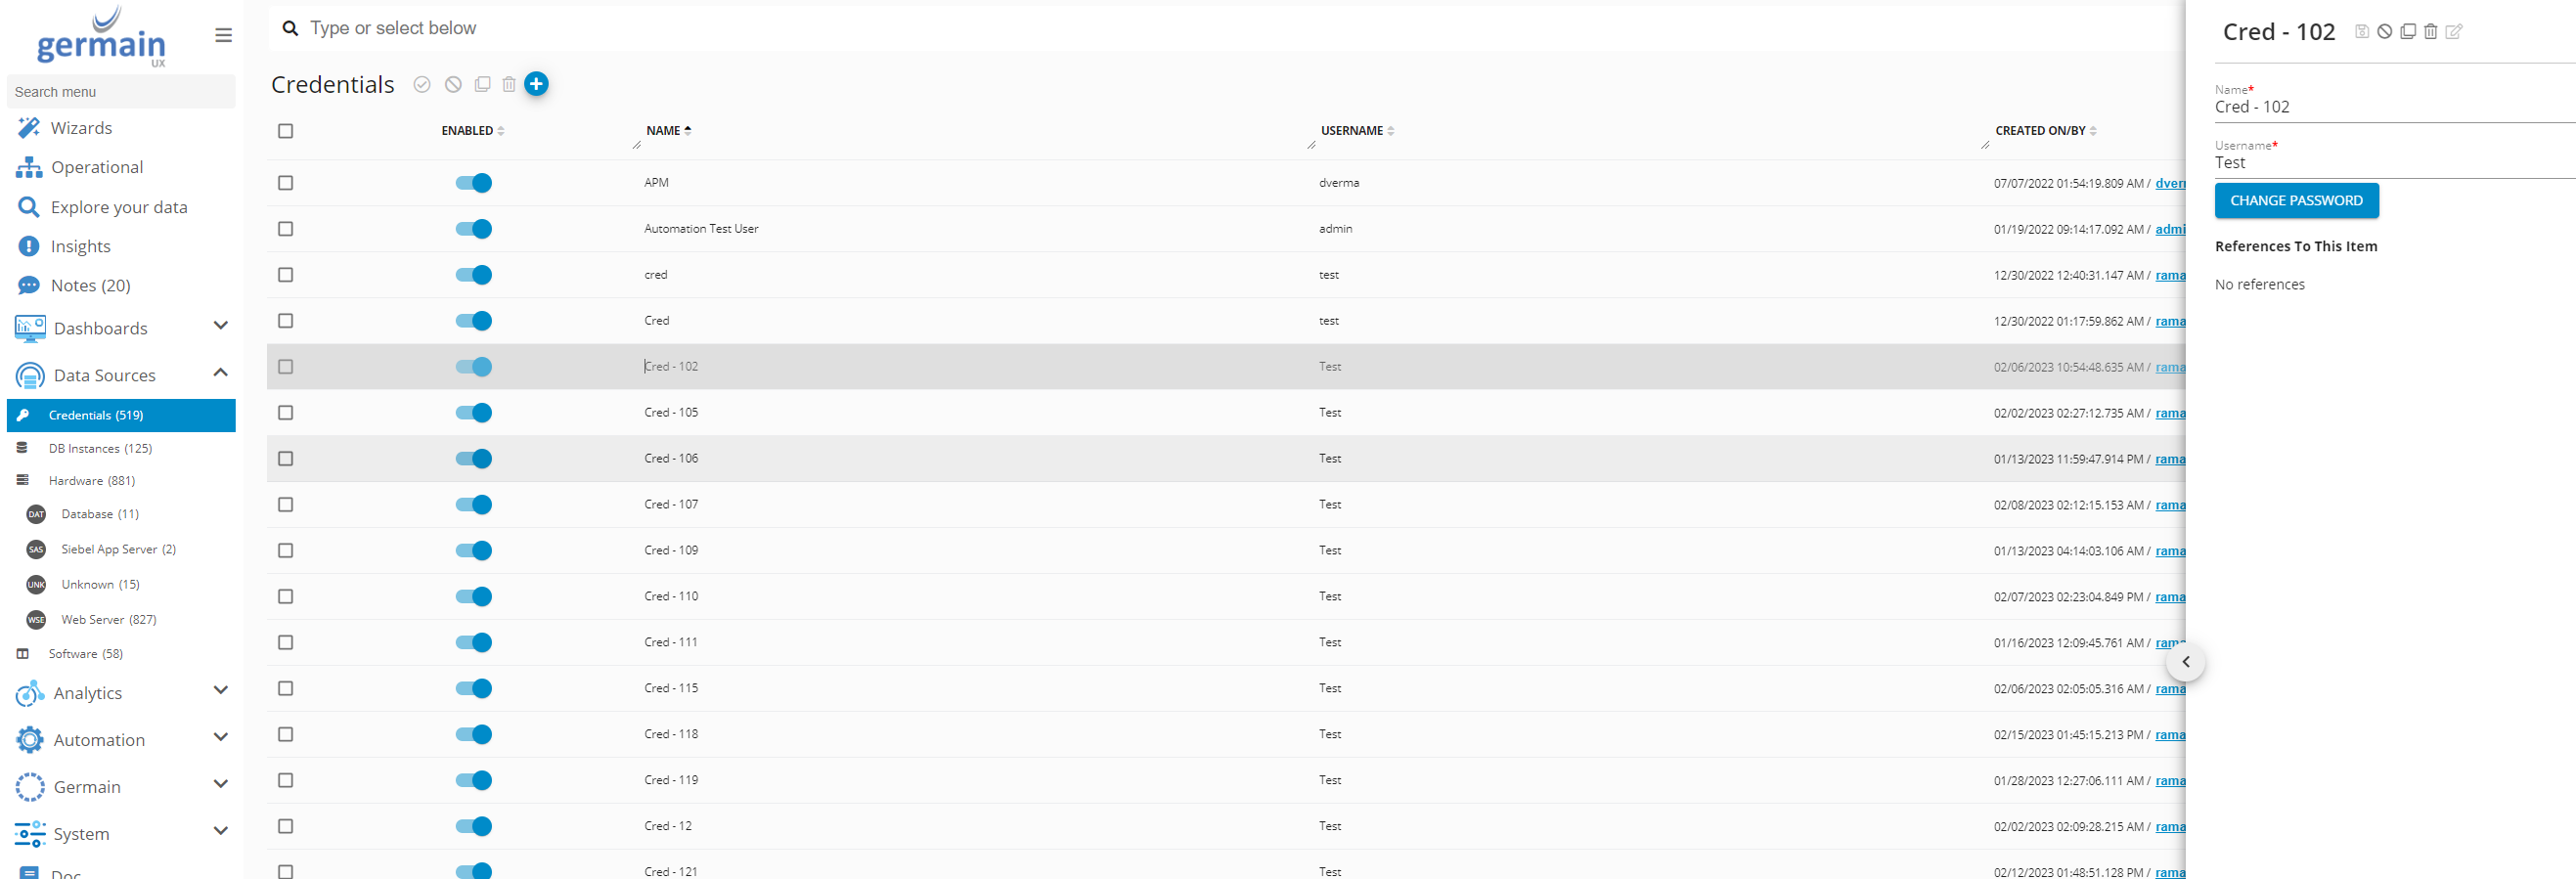
Add Credentials - Germain UX
Add Database Query Monitor
Germain Workspace > Left Menu > Wizards > Database Query Monitor Deployment
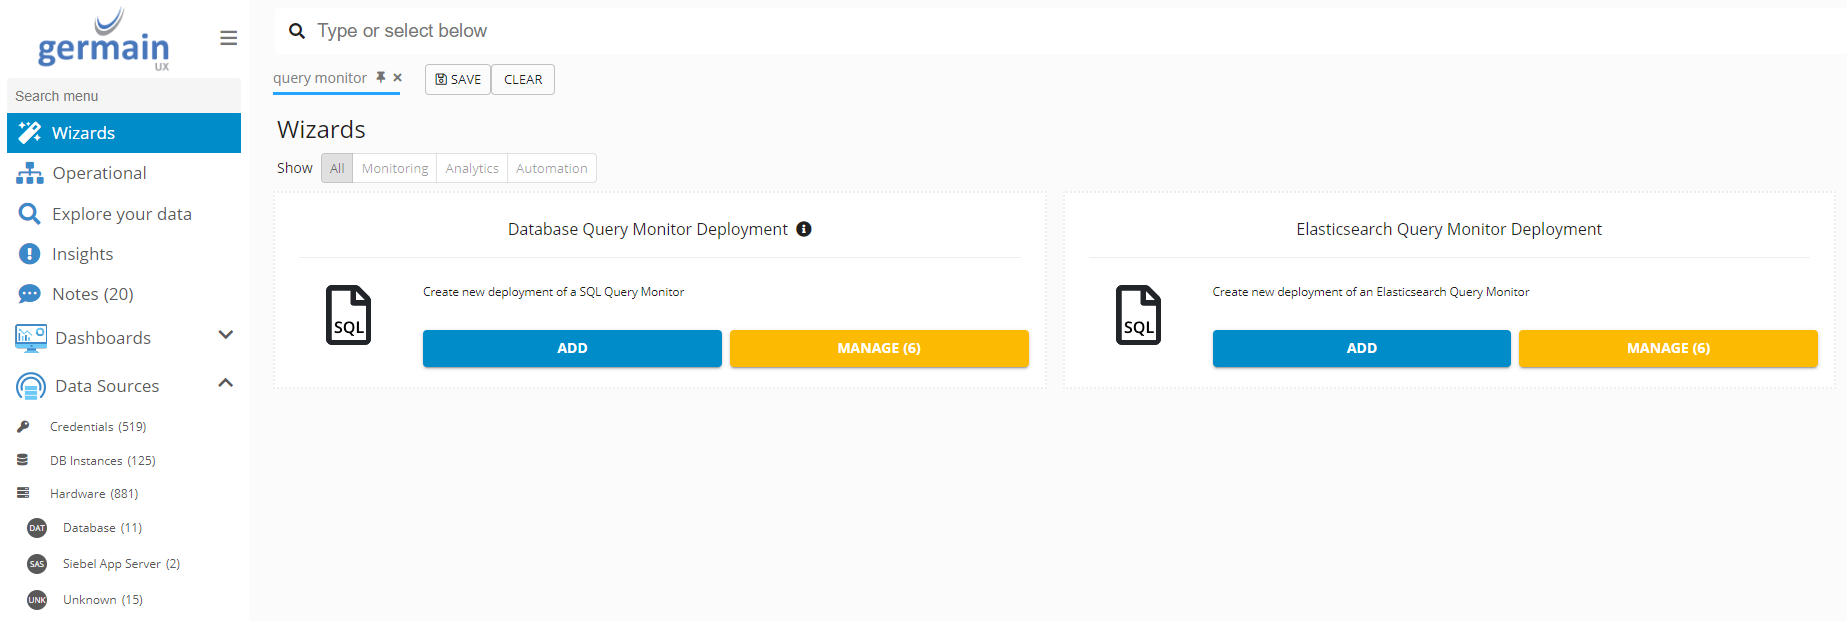
Add Database Query Monitor - Germain UX
Enter Database details
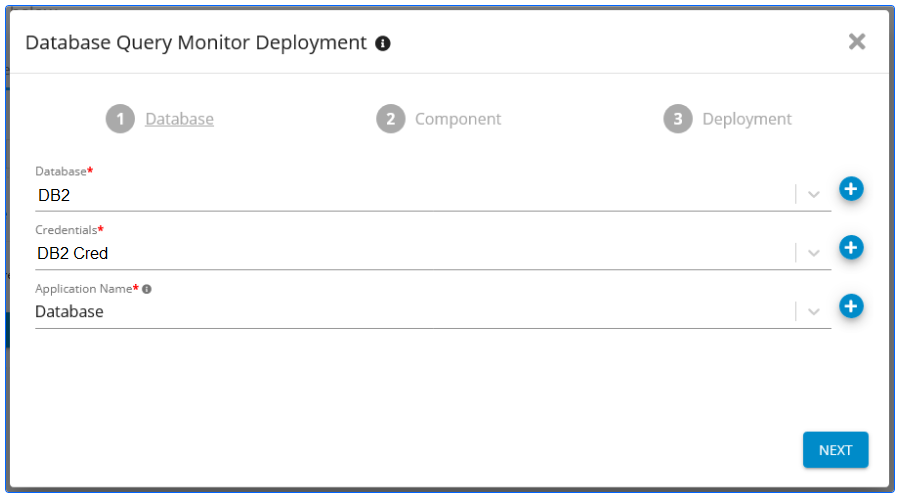
Enter DB2 Database Details - Germain UX
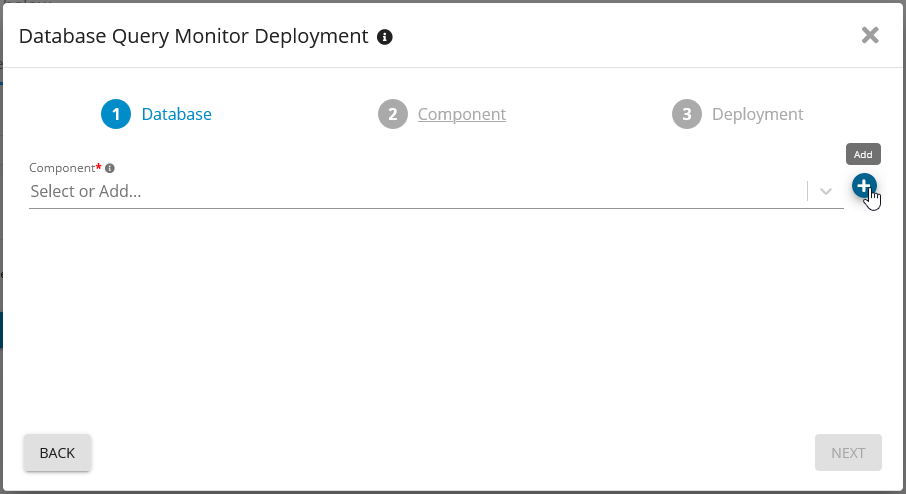
Add DB2 database Query Monitor - Germain UX
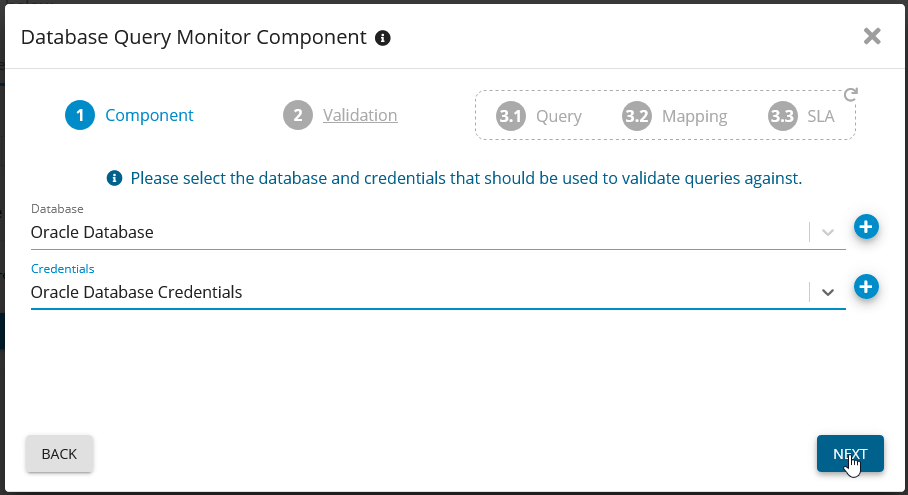
DB2 Database Query Monitor - Germain UX
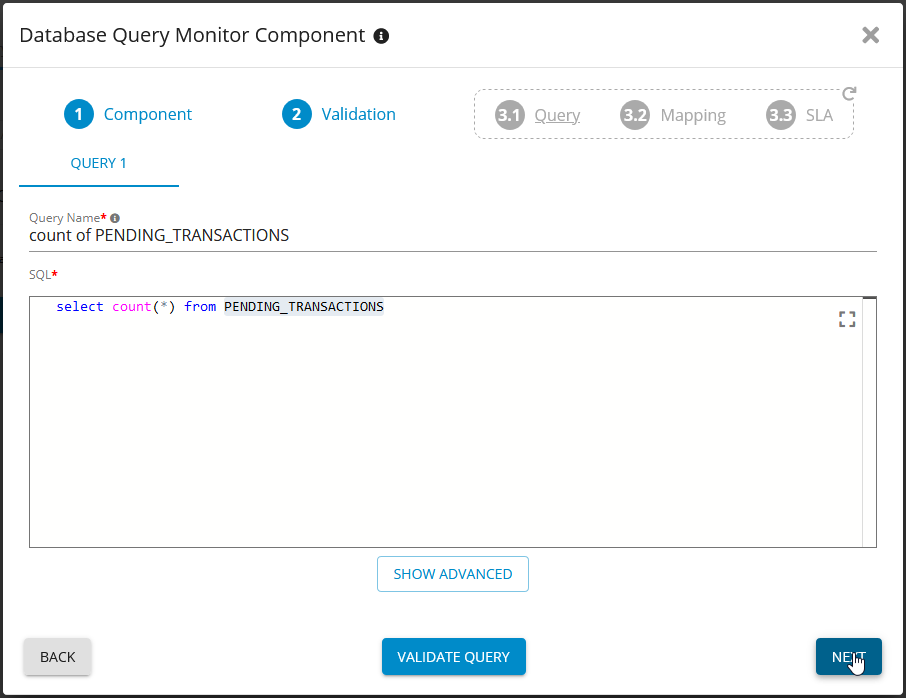
Add DB2 Database Query Monitor Component - Germain UX
Add KPI
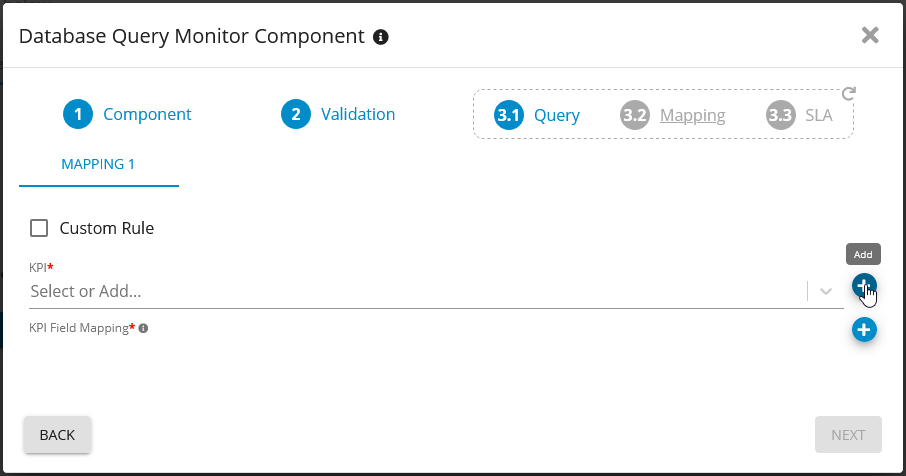
Add KPI for your DB2 database- Germain UX
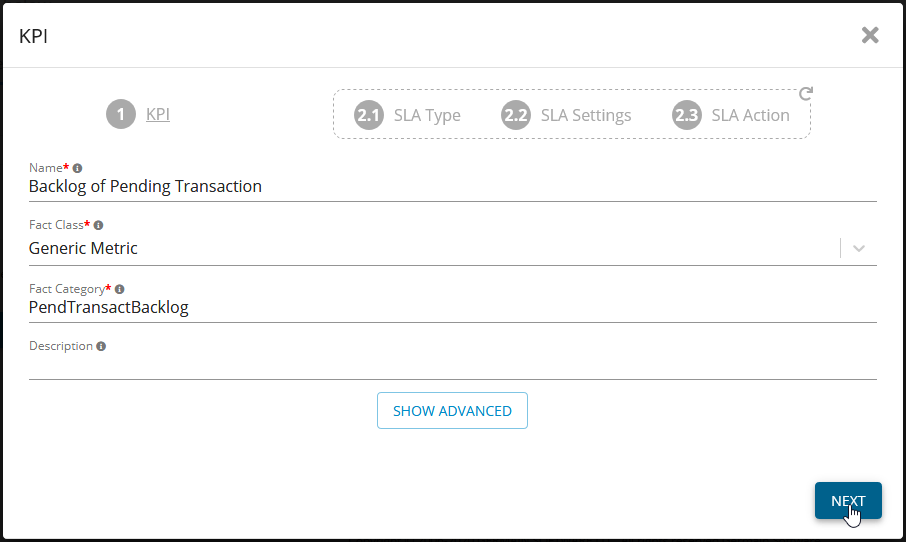
Add KPI for DB2 - Germain UX
Create the base SLA for the new KPI. Choose Fact-based SLA
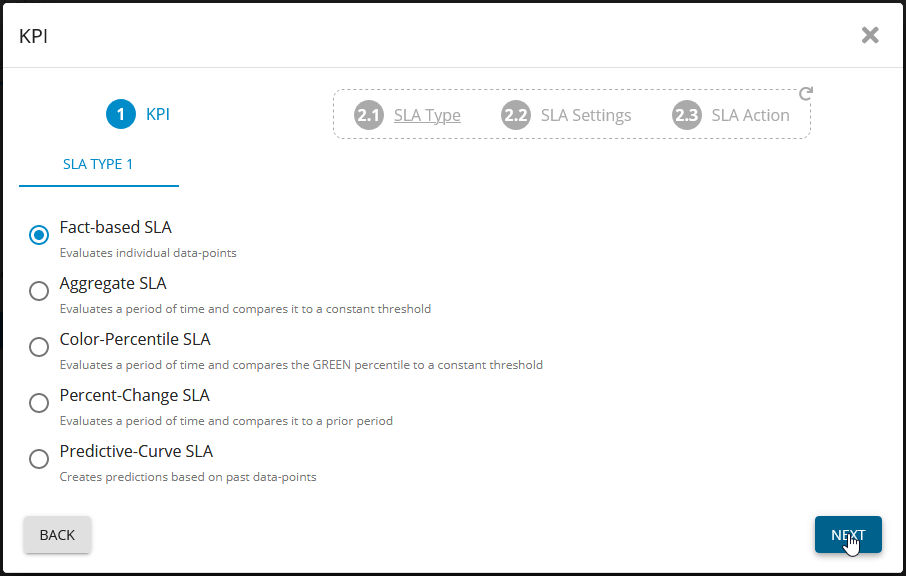
Add SLA for DB2 - Germain UX
Add SLA
Alert Template: SLA.
Choose one or more of your actions (Alerts, Reports, Scripts, ect..)
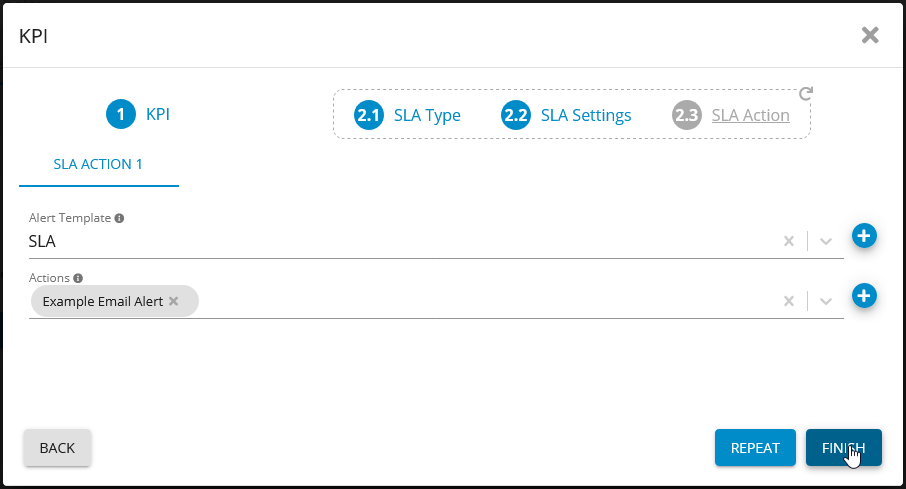
Add SLA Alert Template - Germain UX
Set KPI
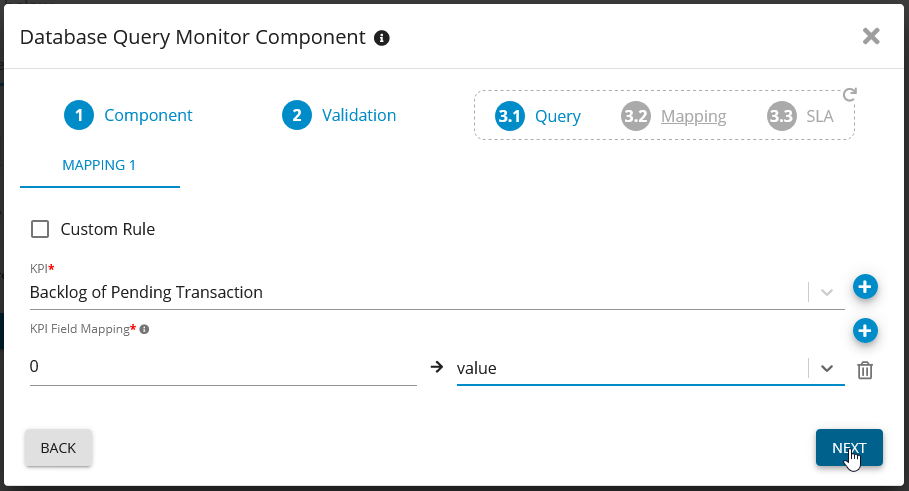
Configure KPI for DB2 - Germain UX
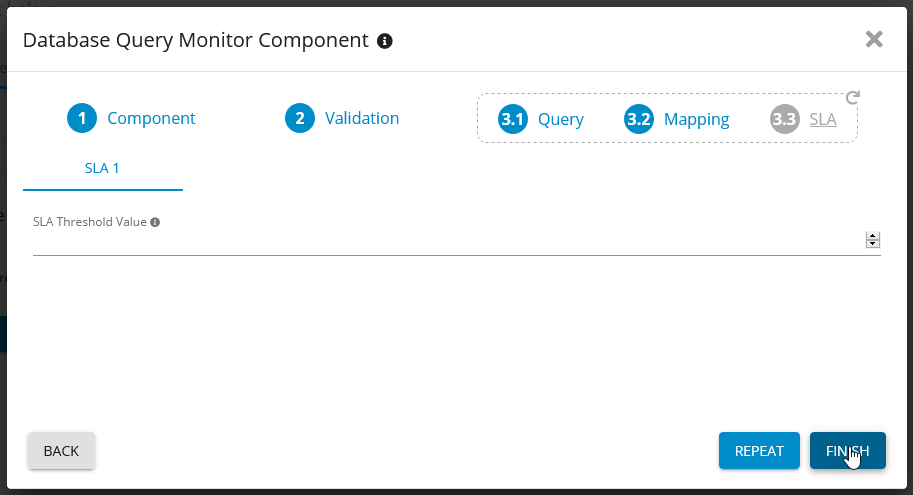
Add SLA Threshold for DB2 - Germain UX
Deployment details
Monitoring Node: The Node that the Engine runs from
Engine: The engine you want to run the Monitor on
Fill in the schedule you would like the Monitor to run on
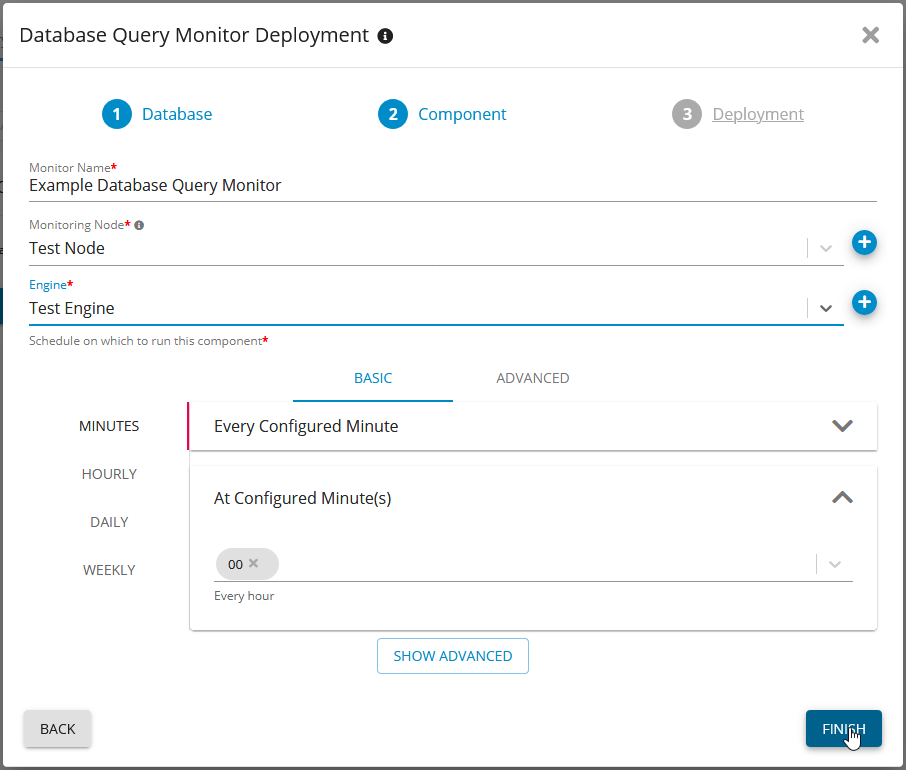
Deploy Database Query Monitor for DB2 - Germain UX
Verify the Monitor by finding in “Germain State”
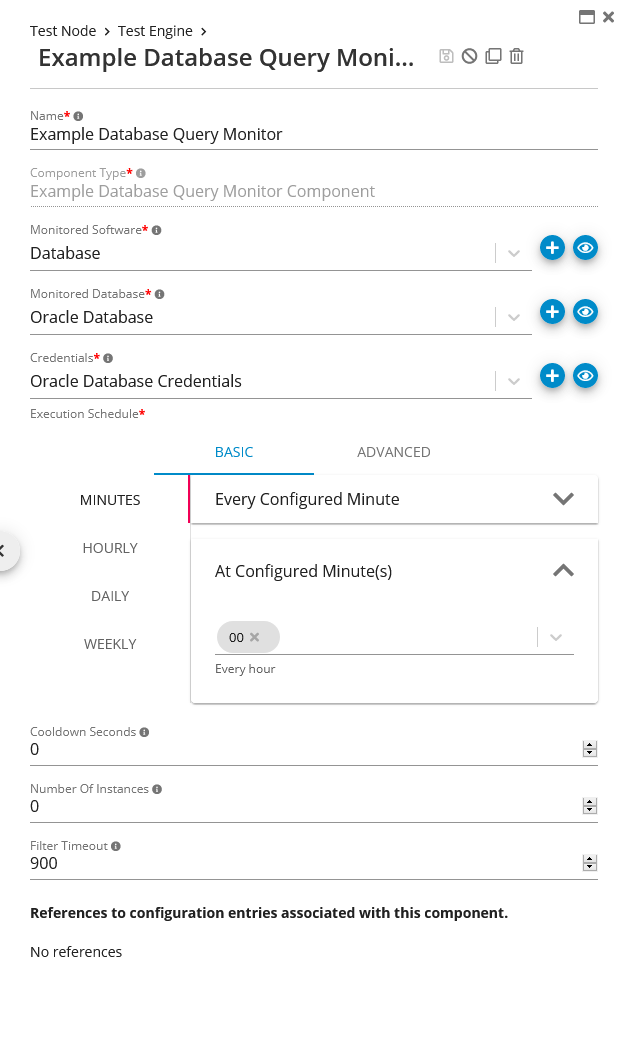
Check Running State of Database Query Monitor
Component: Engine
Feature Availability: 8.6.0 or later
