
🔖 Salesforce Stats Monitoring by Germain UX.
GermainUX uses the Salesforce REST API to collect operational, performance, usage, and configuration statistics. These metrics help teams monitor Salesforce activity, identify trends, detect abnormal behavior, and investigate performance or adoption issues.
🔍 Collected Statistics
By default, GermainUX collects statistics for:
|
Category |
Statistics |
|---|---|
|
Apex and automation |
Apex actions, Flow custom actions, external-service actions, scheduled jobs, and Flow interviews |
|
Lightning performance |
Navigation performance by browser and page |
|
Lightning adoption |
User sessions and switches between Lightning Experience and Salesforce Classic |
|
Processes |
Approval processes and workflow rules |
|
Salesforce data |
Record counts |
Additional REST API queries can be configured to collect organization-specific Salesforce metrics.
⚙️ Enable Monitoring
Salesforce statistics monitoring is enabled during the initial Salesforce deployment:
-
Open Germain Workspace.
-
Start the Salesforce Application wizard.
-
Configure and complete the Salesforce monitoring deployment.
🕒 Configure the Monitoring Frequency
By default, GermainUX collects Salesforce statistics once per hour.
✨ During the Initial Deployment
-
Open the Salesforce Application wizard.
-
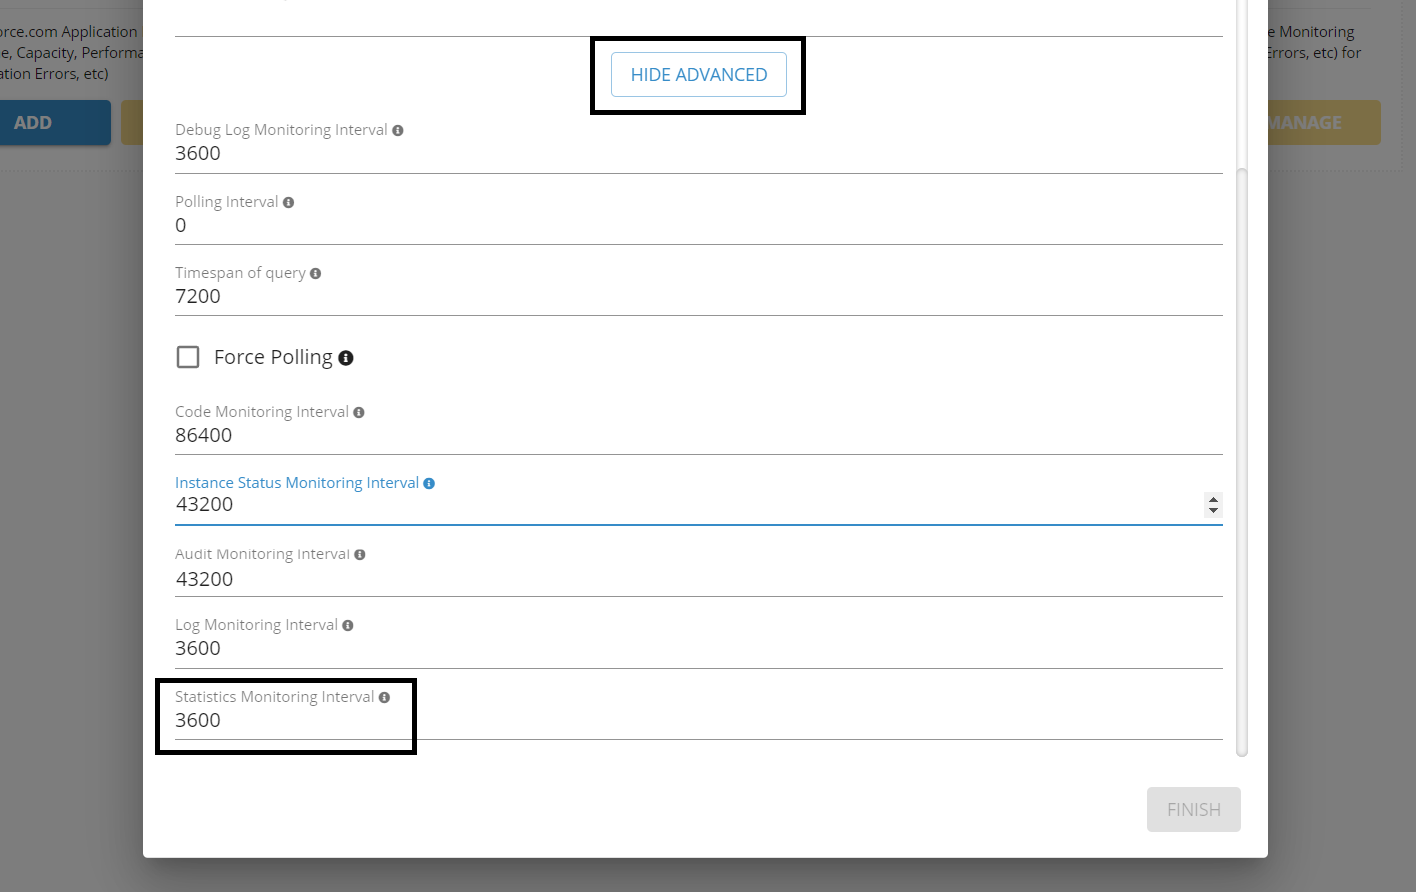
Click Show Advanced.
-
Set the Stats Monitoring Interval.
-
Complete the deployment.
🔧 After Deployment
To change the execution frequency of an existing monitor:
-
Open Germain Workspace.
-
From the left menu, go to Germain.
-
Select the State tab.
-
Search for components with the type name Salesforce Stats Monitor.
-
Select the component you want to update.
-
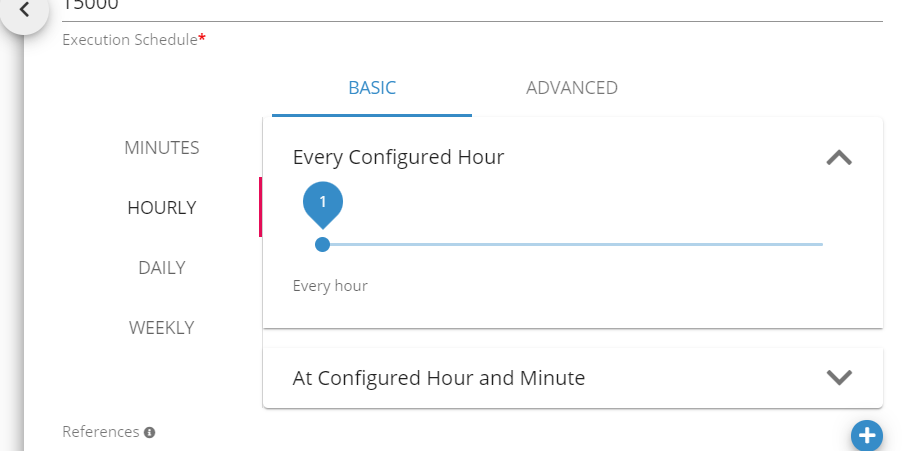
Modify its Execution Schedule.
-
Save the configuration.
⛔ Disable Monitoring
To stop collecting all Salesforce statistics:
-
Open Germain Workspace.
-
From the left menu, go to Germain.
-
Select the State tab.
-
Search for components with the type name Salesforce Stats Monitor.
-
Disable the applicable component using the toggle in the Enabled column.
💨 Disable an Individual Statistics Query
Individual REST API queries can be disabled without stopping the entire Salesforce Stats Monitor:
-
Open Germain Workspace.
-
From the left menu, go to System → Engine → Component Types.
-
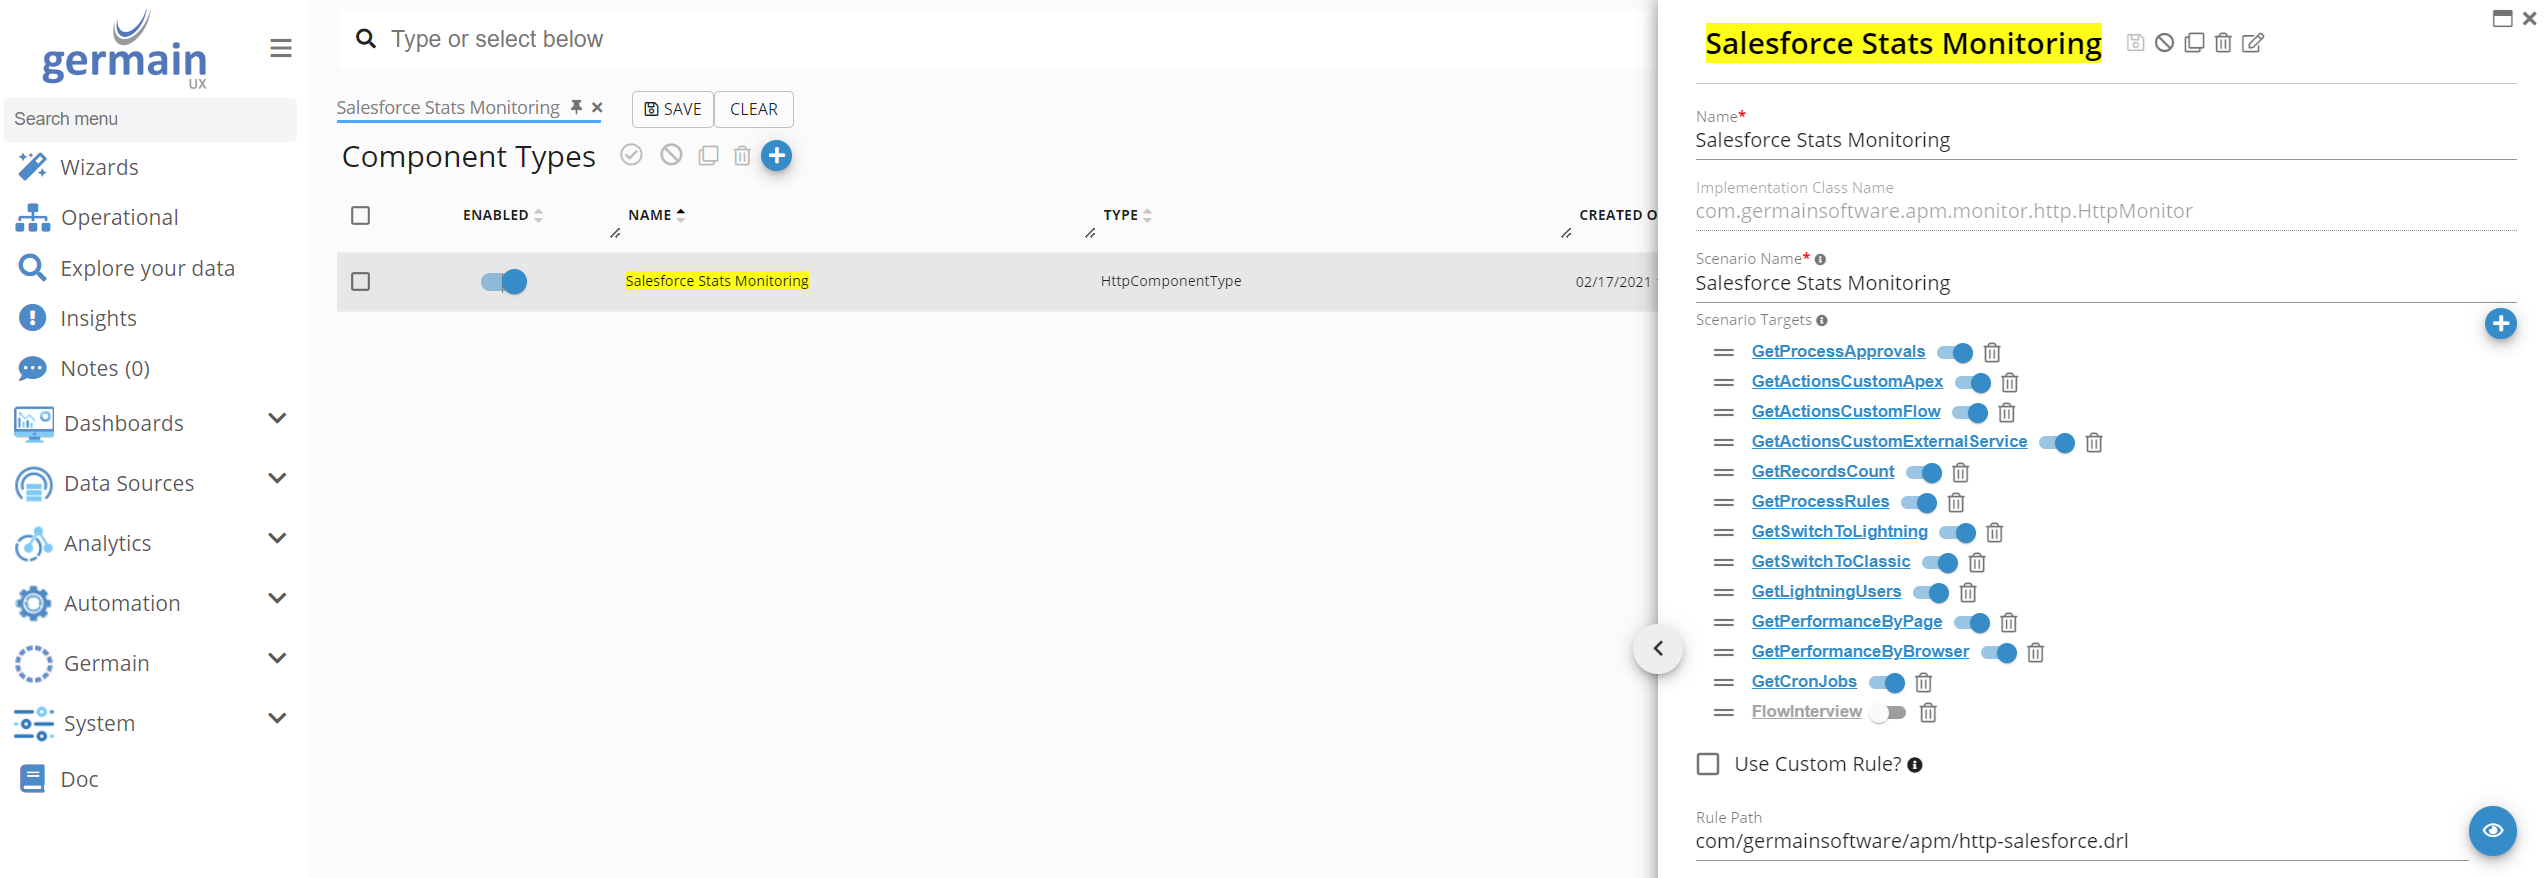
Search for the component type named Salesforce Stats Monitoring.
-
Locate the query under Scenario Targets.
-
Disable the query using its toggle.
-
Save the configuration.
➕ Add a Statistics Query
Additional Salesforce REST API queries can be added to collect metrics specific to your organization.
Contact the GermainUX team for assistance configuring a new statistics query.
📊 Analyze the Collected Data
🏆 KPIs
Use the configured Salesforce Stats KPIs to monitor collected statistics, establish baselines, detect deviations, and trigger alerts or automated actions.
🖼️ Dashboard
Navigate to:
Germain Workspace → Dashboards → All → Salesforce Stats
The dashboard provides an aggregated view of the collected Salesforce statistics and supports drill-through analysis.
💡 Examples
The existing examples should remain on the page:
|
Example |
Details |
|---|---|
|
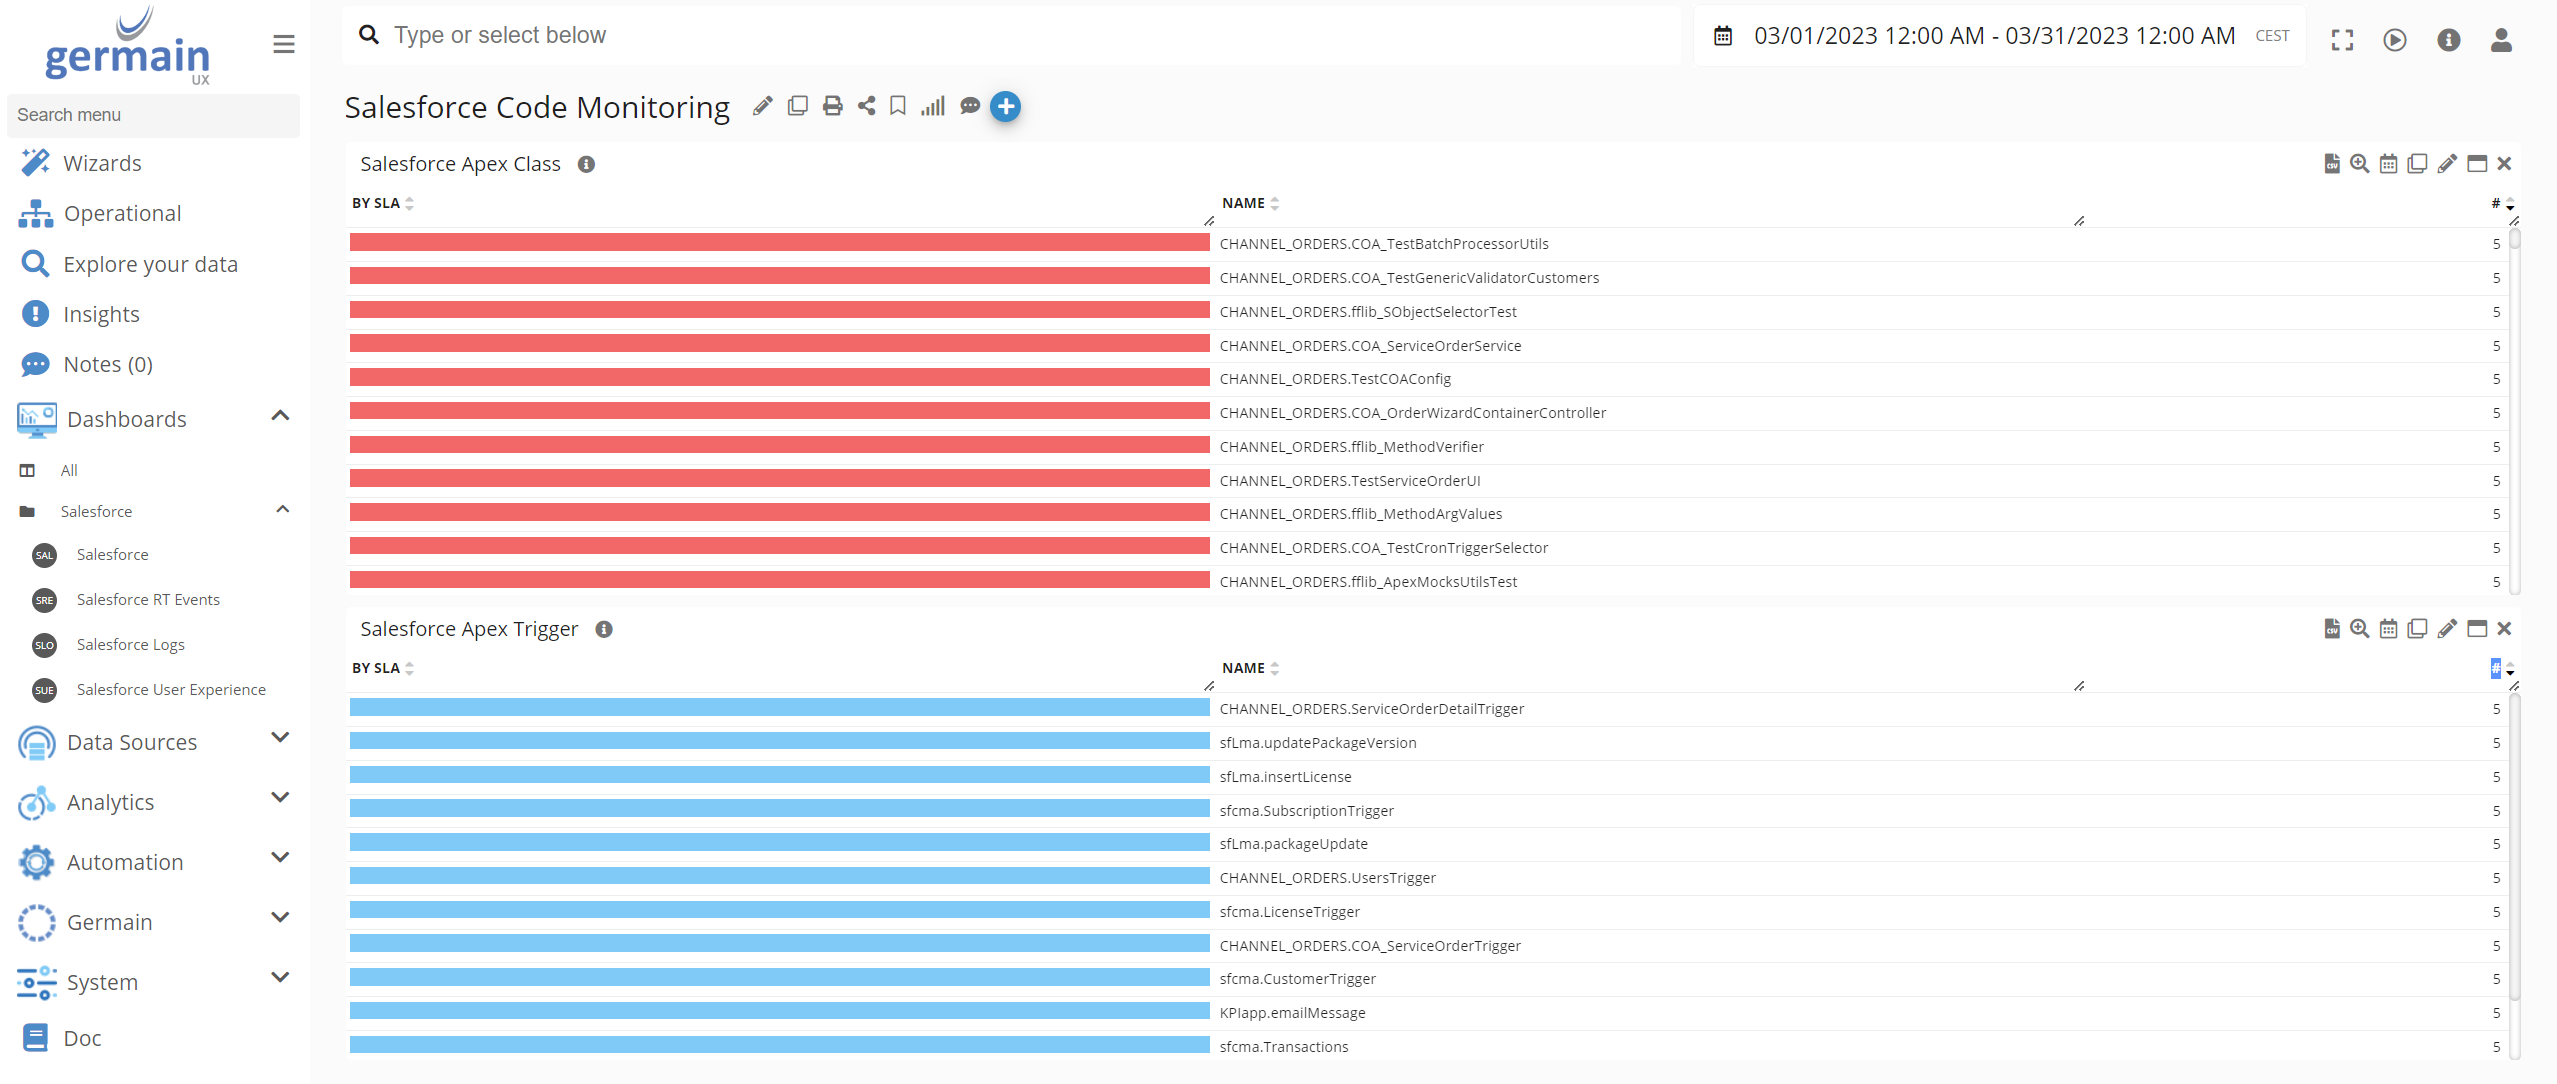
Apex Class and Trigger Monitoring |
|
|
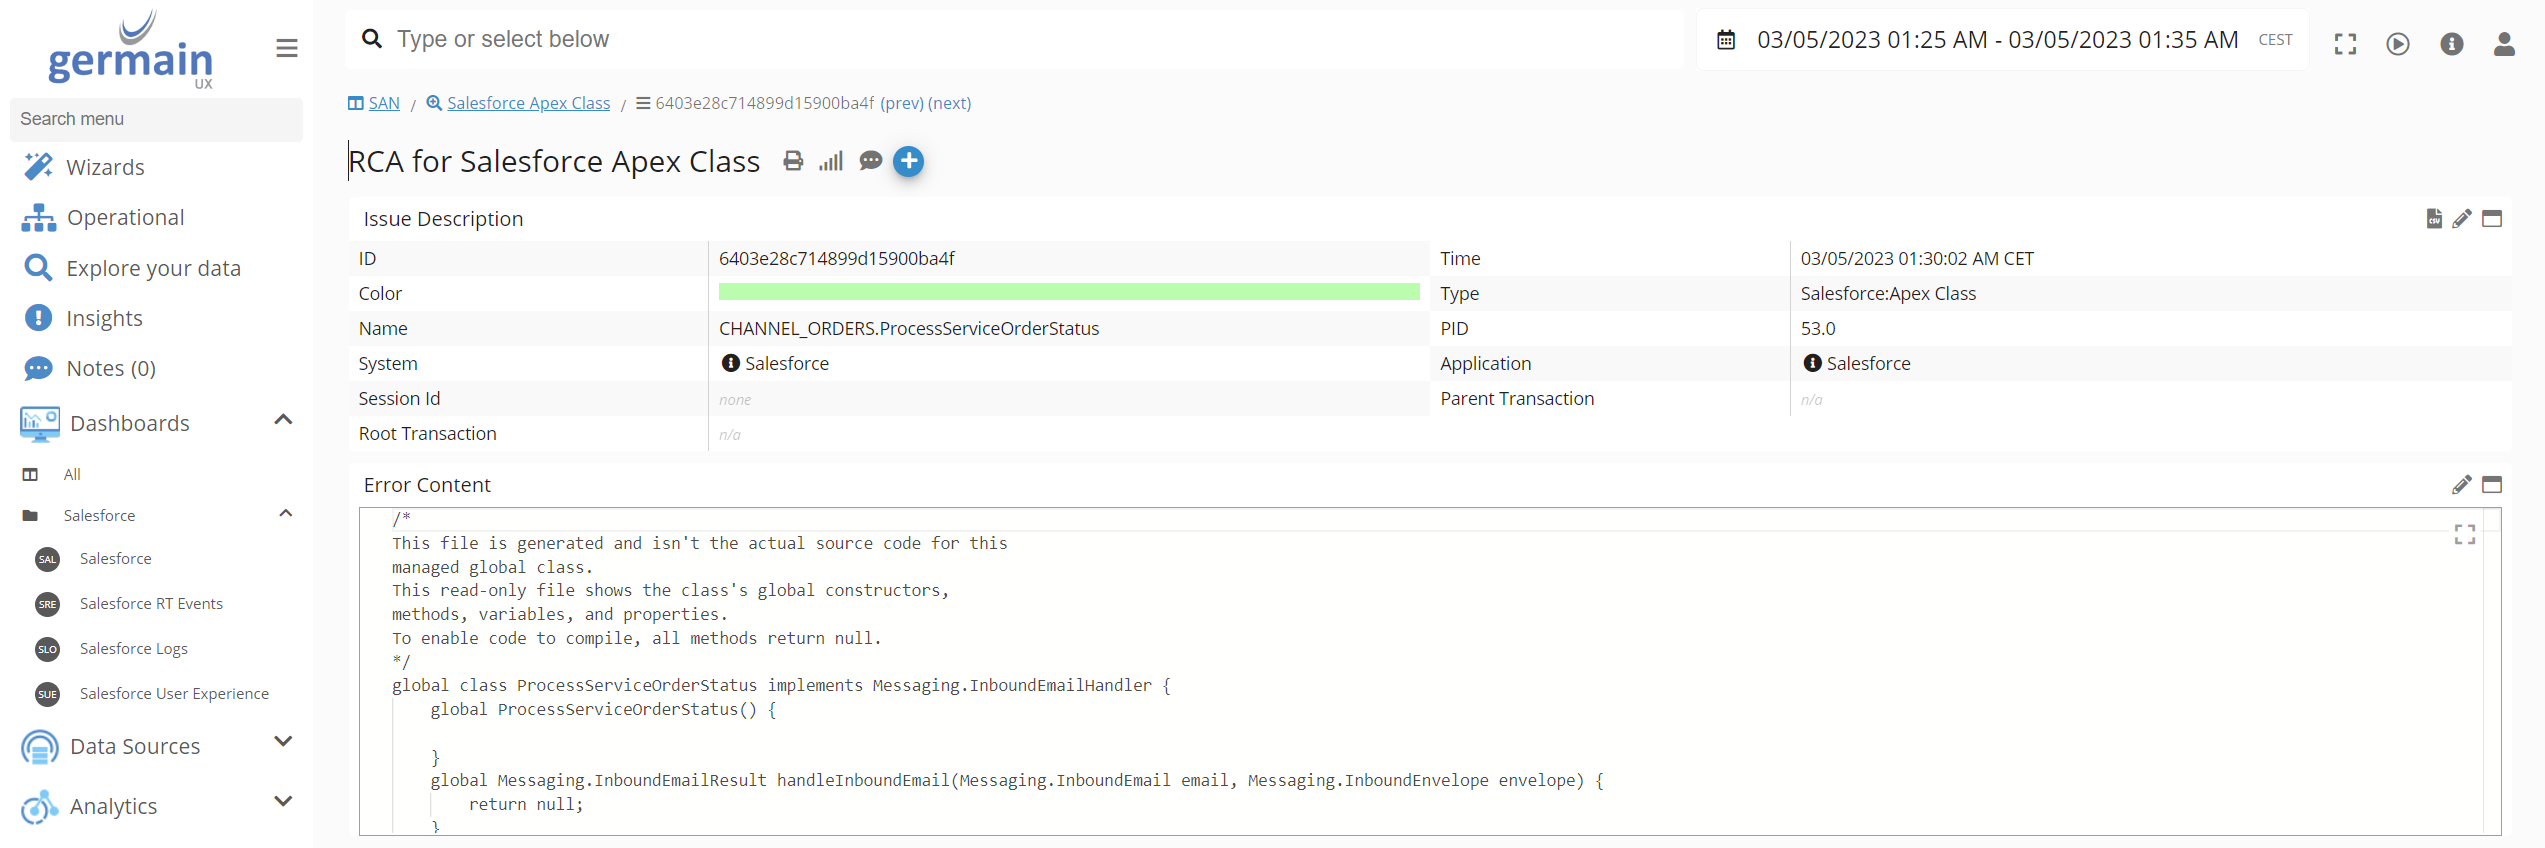
Apex Class Details in the Analysis Dashboard |
|
📚 Related Documentation
-
Other Analytics Features
-
Other Automation Features
ℹ️ Get Help
The Germain Team can help you set this up. Contact GermainUX Support.
Component: Engine, Mobile App, RUM Ext, RUM JS
Feature Availability: 2017.1 or later