
🛰 WordPress Operational Experience Intelligence
Monitor and optimize the availability, performance, user experience, and operational health of WordPress websites with GermainUX.
GermainUX combines Real User Monitoring, Session Replay, browser and JavaScript analysis, synthetic transactions, REST API monitoring, log monitoring, database monitoring, and infrastructure observability to help teams identify issues affecting visitors and website operations.
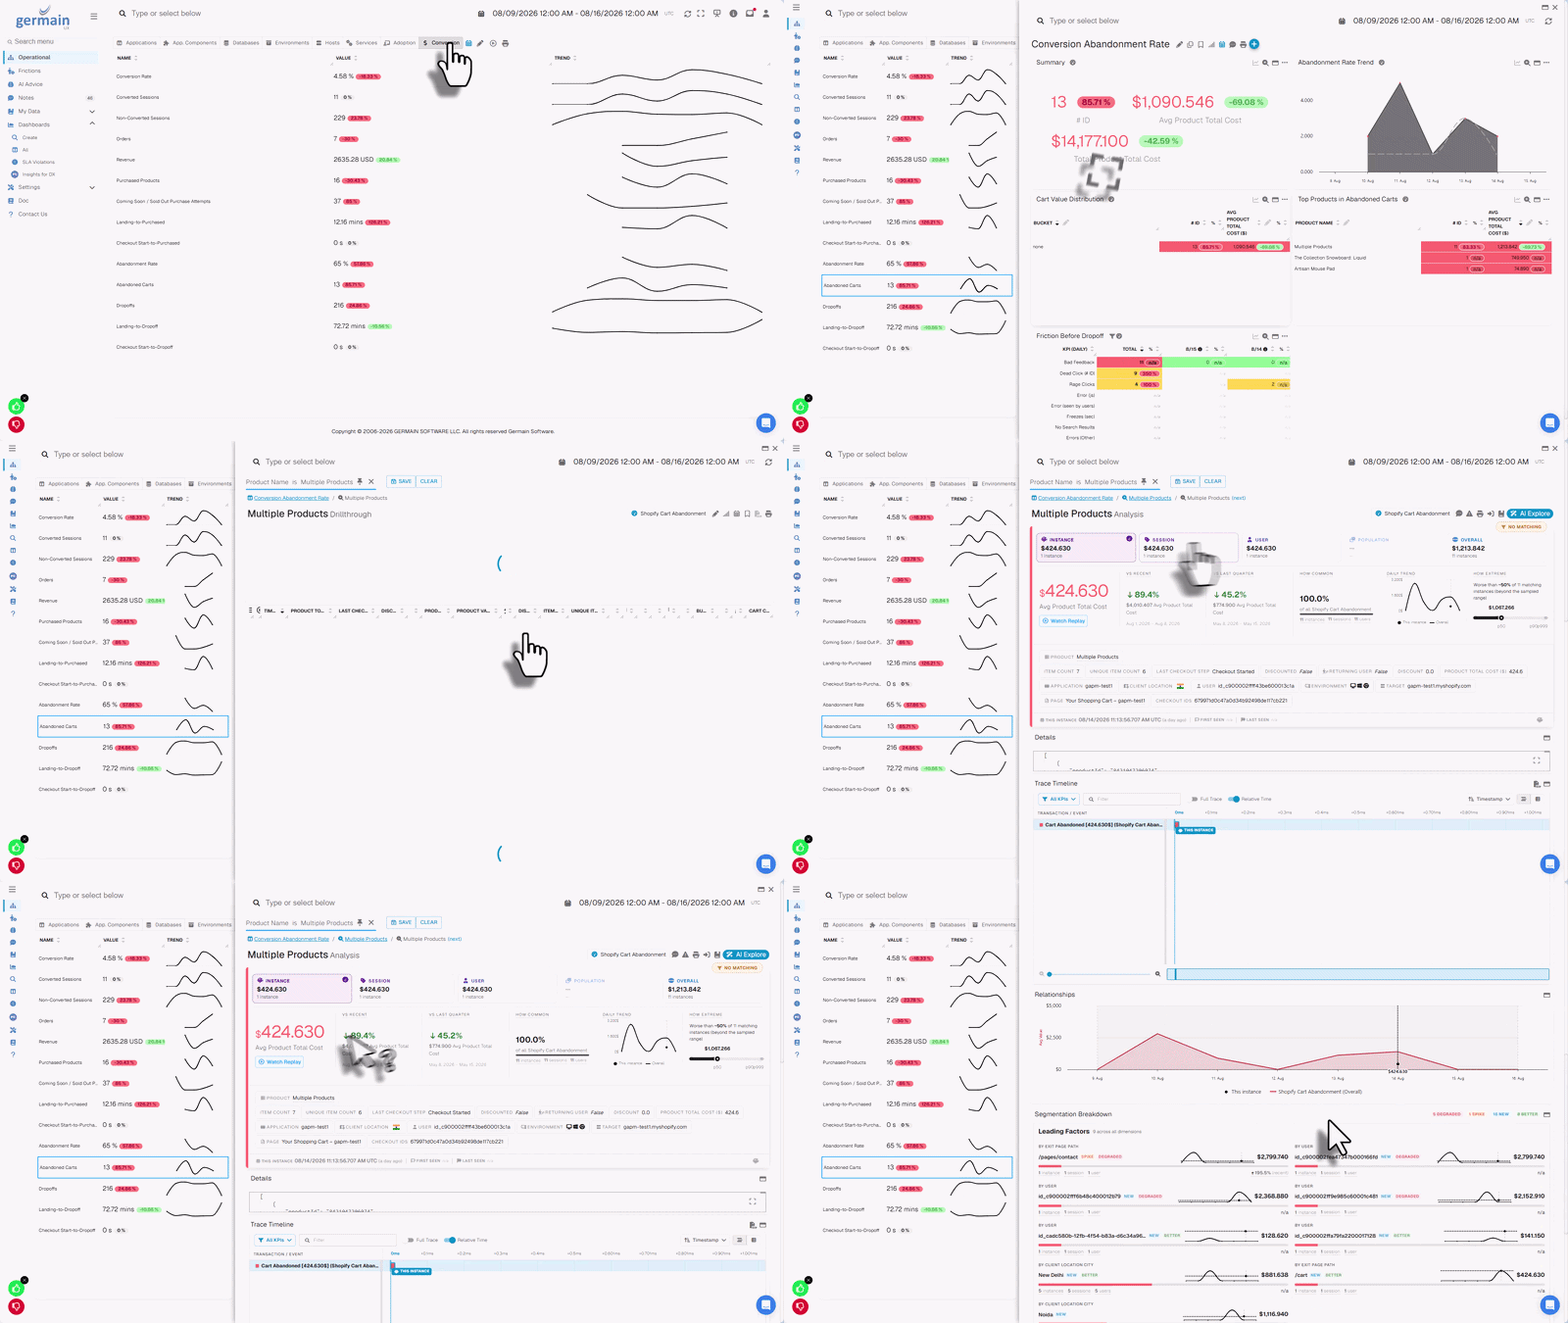
👀 Real User Monitoring
Understand how real users experience your WordPress website.
GermainUX can monitor:
|
Metric |
|---|
|
User sessions |
|
Page views |
|
Navigation |
|
Clicks and interactions |
|
Page-load performance |
|
User interaction performance |
|
Browser activity |
|
Network requests |
|
JavaScript errors |
|
User journeys |
|
Business workflows |
Analyze individual user sessions or broader trends across visitor populations.
🎥 Session Replay
GermainUX Session Replay reconstructs user activity across monitored WordPress pages.
Use Session Replay to investigate:
|
Issue |
|---|
|
Navigation issues |
|
Dead clicks |
|
Rage clicks |
|
Error clicks |
|
Repeated actions |
|
Slow interactions |
|
JavaScript errors |
|
Form issues |
|
Failed workflows |
|
User abandonment |
Combine Session Replay with analytics and searchable events to quickly identify affected sessions.
📡 Website Availability
Monitor whether important WordPress websites and pages are available.
Depending on the configured monitoring, GermainUX can analyze:
|
Check |
|---|
|
Website availability |
|
Page availability |
|
HTTP status |
|
Response time |
|
Expected content |
|
TLS certificate validity |
|
Synthetic transaction availability |
Availability monitoring complements Real User Monitoring by detecting issues even when no real visitor is currently using the website.
🚤 Website Performance
Monitor performance from both the visitor and server perspectives.
Analyze:
|
Metric |
|---|
|
Page-load time |
|
User interaction time |
|
Browser processing |
|
Network-request duration |
|
Server response time |
|
API response time |
|
PHP processing |
|
Database performance |
|
Infrastructure resource utilization |
This helps determine whether poor experience originates in the browser, WordPress application, database, infrastructure, or an external dependency.
🐛 JavaScript Error Monitoring
Detect browser-side issues such as:
|
Error Type |
|---|
|
JavaScript errors |
|
Browser console errors |
|
Failed network requests |
|
HTTP failures |
|
Resource-loading failures |
|
Third-party script failures |
Errors can be correlated with:
|
Correlation |
|---|
|
User |
|
Session |
|
Page |
|
Interaction |
|
Browser |
|
Device |
|
Workflow |
🔧 Advanced JavaScript Analysis
Use GermainUX JS Profiler when deeper browser troubleshooting is required.
Depending on the monitored application and configuration, analyze:
|
Focus |
|---|
|
JavaScript execution |
|
Slow functions |
|
Long-running JavaScript |
|
Browser processing |
|
Network activity |
|
Third-party scripts |
|
Integration activity |
|
Browser freezes |
This can help identify issues caused by themes, plugins, custom JavaScript, or third-party services.
🧩 Theme and Plugin Impact
WordPress performance and user experience can be affected by themes and plugins.
GermainUX can help identify conditions associated with:
|
Condition |
|---|
|
JavaScript errors |
|
Slow browser execution |
|
Network failures |
|
Slow HTTP requests |
|
PHP errors |
|
Database delays |
|
Log errors |
|
Performance regressions after changes |
Compare application behavior before and after theme, plugin, or WordPress updates.
🔁 WordPress REST API Monitoring
GermainUX Engine can monitor authorized WordPress REST APIs.
Depending on permissions and requirements, monitor:
|
Aspect |
|---|
|
Availability |
|
Response time |
|
HTTP status |
|
Authentication |
|
Errors |
|
Response validation |
|
Scheduled API checks |
Use the minimum API permissions required for monitoring.
📄 WordPress Log Monitoring
When logs are accessible, GermainUX Engine can monitor WordPress and supporting application logs.
Examples include:
|
Log |
|---|
|
WordPress debug logs |
|
PHP logs |
|
Web-server logs |
|
Plugin logs |
|
Integration logs |
|
Operating-system logs |
Use log monitoring to detect:
|
Issue |
|---|
|
PHP errors |
|
Plugin errors |
|
Authentication failures |
|
Application exceptions |
|
Integration failures |
|
Repeated warnings |
|
Unexpected application behavior |
🏬 Database Monitoring
When authorized database access is available, GermainUX can monitor the database supporting WordPress.
Depending on the environment, this commonly includes MySQL or MariaDB.
Analyze:
|
Metric |
|---|
|
Availability |
|
Connections |
|
Query performance |
|
Capacity |
|
Locks |
|
Errors |
|
Slow queries |
Database telemetry can be correlated with slow WordPress pages and transactions.
⚙️ Server and Infrastructure Monitoring
When the WordPress hosting environment is customer-controlled or accessible, GermainUX can monitor supporting infrastructure.
Depending on the architecture, this can include:
|
Resource |
|---|
|
CPU |
|
Memory |
|
Disk |
|
Filesystem |
|
Network |
|
Processes |
|
Web server |
|
PHP |
|
Containers |
|
Cloud infrastructure |
This can help distinguish application issues from underlying resource constraints.
📝 Forms and Business Workflows
Monitor important WordPress workflows such as:
Landing Page → Form → Submission → Confirmation
Login → Account → Action → Confirmation
Content → Call to Action → Conversion
Analyze:
|
Workflow Metric |
|---|
|
Completion |
|
Duration |
|
Abandonment |
|
Errors |
|
Performance delays |
|
Repeated actions |
|
User friction |
🤖 Synthetic Transactions
Use GermainUX RPA Bot Recorder to proactively execute critical WordPress workflows.
Examples include:
Open Website → Navigate → Verify Expected Content
or:
Open Website → Submit Test Form → Verify Confirmation
Synthetic scenarios can identify availability, performance, or functional issues before real users encounter them.
Use approved test accounts and test data.
🔍 Root Cause Analysis
GermainUX can correlate user activity with available technical telemetry.
For example:
Slow Page → Slow PHP Request → Slow Database Query
or:
Form Failure → JavaScript Error → Failed API Request
or:
Website Degradation → Plugin Error → Increased PHP Processing
This helps teams move from detecting a poor experience to identifying its likely cause.
🤖 Automated Analytics
GermainUX can help identify:
|
Anomaly |
|---|
|
Performance regressions |
|
Error increases |
|
Unusual page response time |
|
API degradation |
|
Database performance issues |
|
Infrastructure resource pressure |
|
New browser errors |
|
Outlier behavior |
|
Repeated workflow failures |
🔔 Alerts and Automation
When GermainUX detects a condition requiring attention, it can:
|
Action |
|---|
|
Send an alert |
|
Notify subscribed users through a Watch |
|
Generate a report |
|
Trigger approved diagnostics |
|
Execute approved automation |
📦 Additional Resources
-
Deploy Monitoring or automation for Wordpress
-
Configure Monitoring or automation for Wordpress
-
AI Insights & Recommendations
-
More Analytics Features
-
More Automation Features
ℹ️ Get Help
The Germain Team can help you set this up. Contact GermainUX Support.
Component: Engine, JS Profiler, Mobile App, RPA Bot Recorder, RUM JS
Feature Availability: 8.6.0 or later