
🧭 Customer Journey and Workflow Analysis
GermainUX monitors customer journeys, employee workflows and operational processes across applications, channels and supporting technologies in near real time.
It captures and correlates user interactions, workflow milestones, application behavior, performance, errors and business outcomes. This connected visibility helps organizations understand how journeys progress, where users or processes encounter friction, why completion fails and what should be improved first.
🔎 Capabilities and Approach
By combining flow analysis, behavior analytics, time and process mining, Session Replay, feedback, conversation analysis and technology observability, GermainUX provides both the population-level view and instance-level evidence required to improve conversion, adoption, productivity and customer satisfaction.
🎯 Business Outcomes
GermainUX Journey Analysis helps organizations:
-
Visualize how customers, employees and processes progress across meaningful milestones.
-
Identify where journeys slow down, deviate, fail or drop off.
-
Quantify conversion loss, poor adoption, wasted time and operational delay.
-
Compare successful and unsuccessful paths.
-
Correlate journey friction with user behavior, errors, performance and dependencies.
-
Replay the sessions contributing to an issue.
-
Understand feedback and conversations in the context of the complete journey.
-
Prioritize improvements according to affected users and business impact.
-
Validate whether process, UX or technology changes improve outcomes.
🧩 What Is a Journey?
A journey is a sequence of meaningful events or milestones leading toward an intended outcome.
Journeys can include:
|
Journey type |
Example |
|---|---|
|
Customer journey |
Campaign → Product discovery → Cart → Checkout → Payment → Fulfillment |
|
CRM workflow |
Lead → Qualification → Opportunity → Quote → Approval → Sale |
|
Employee workflow |
Sign in → Search account → Update record → Submit request → Confirmation |
|
Service journey |
Request help → Chat or case → Assignment → Investigation → Resolution |
|
Compliance journey |
Identity collection → Verification → Review → Approval or rejection |
|
Operational process |
Order received → Inventory allocation → Fulfillment → Shipment → Delivery |
A journey can involve one user and one application, or span multiple users, teams, systems, channels and automated processes.
🏁 Define the Journey and Intended Outcome
Reliable journey analysis requires a meaningful definition of success.
A configured journey can include:
-
Entry or intent signal
-
Expected milestones
-
Optional and alternative paths
-
Successful completion event
-
Failure and abandonment conditions
-
Expected duration or SLA
-
Relevant users, systems and business outcomes
Not every deviation is a problem. Users may legitimately take different paths or complete the objective through another channel. GermainUX journey definitions can account for valid alternatives so normal behavior is not incorrectly classified as friction.
🌐 Cross-Application and Cross-Channel Monitoring
Many business journeys extend beyond a single application or digital channel. GermainUX can correlate observable events across:
-
Websites and eCommerce storefronts
-
CRM and ERP applications
-
Native Windows and internal applications
-
Mobile applications
-
Chatbots, messaging and human-agent conversations
-
APIs, integrations and middleware
-
Databases and backend services
-
Operational and fulfillment systems
Correlation depends on the identifiers, timestamps and instrumentation available across each environment.
📋 Examples of Journey Monitoring
|
Use case |
What GermainUX can analyze |
|
Identity collection, verification steps, delays, failures and completion in a financial-services process |
|
|
Checkout and cart abandonment |
Product discovery, cart activity, checkout, payment, errors and revenue-impacting drop-off 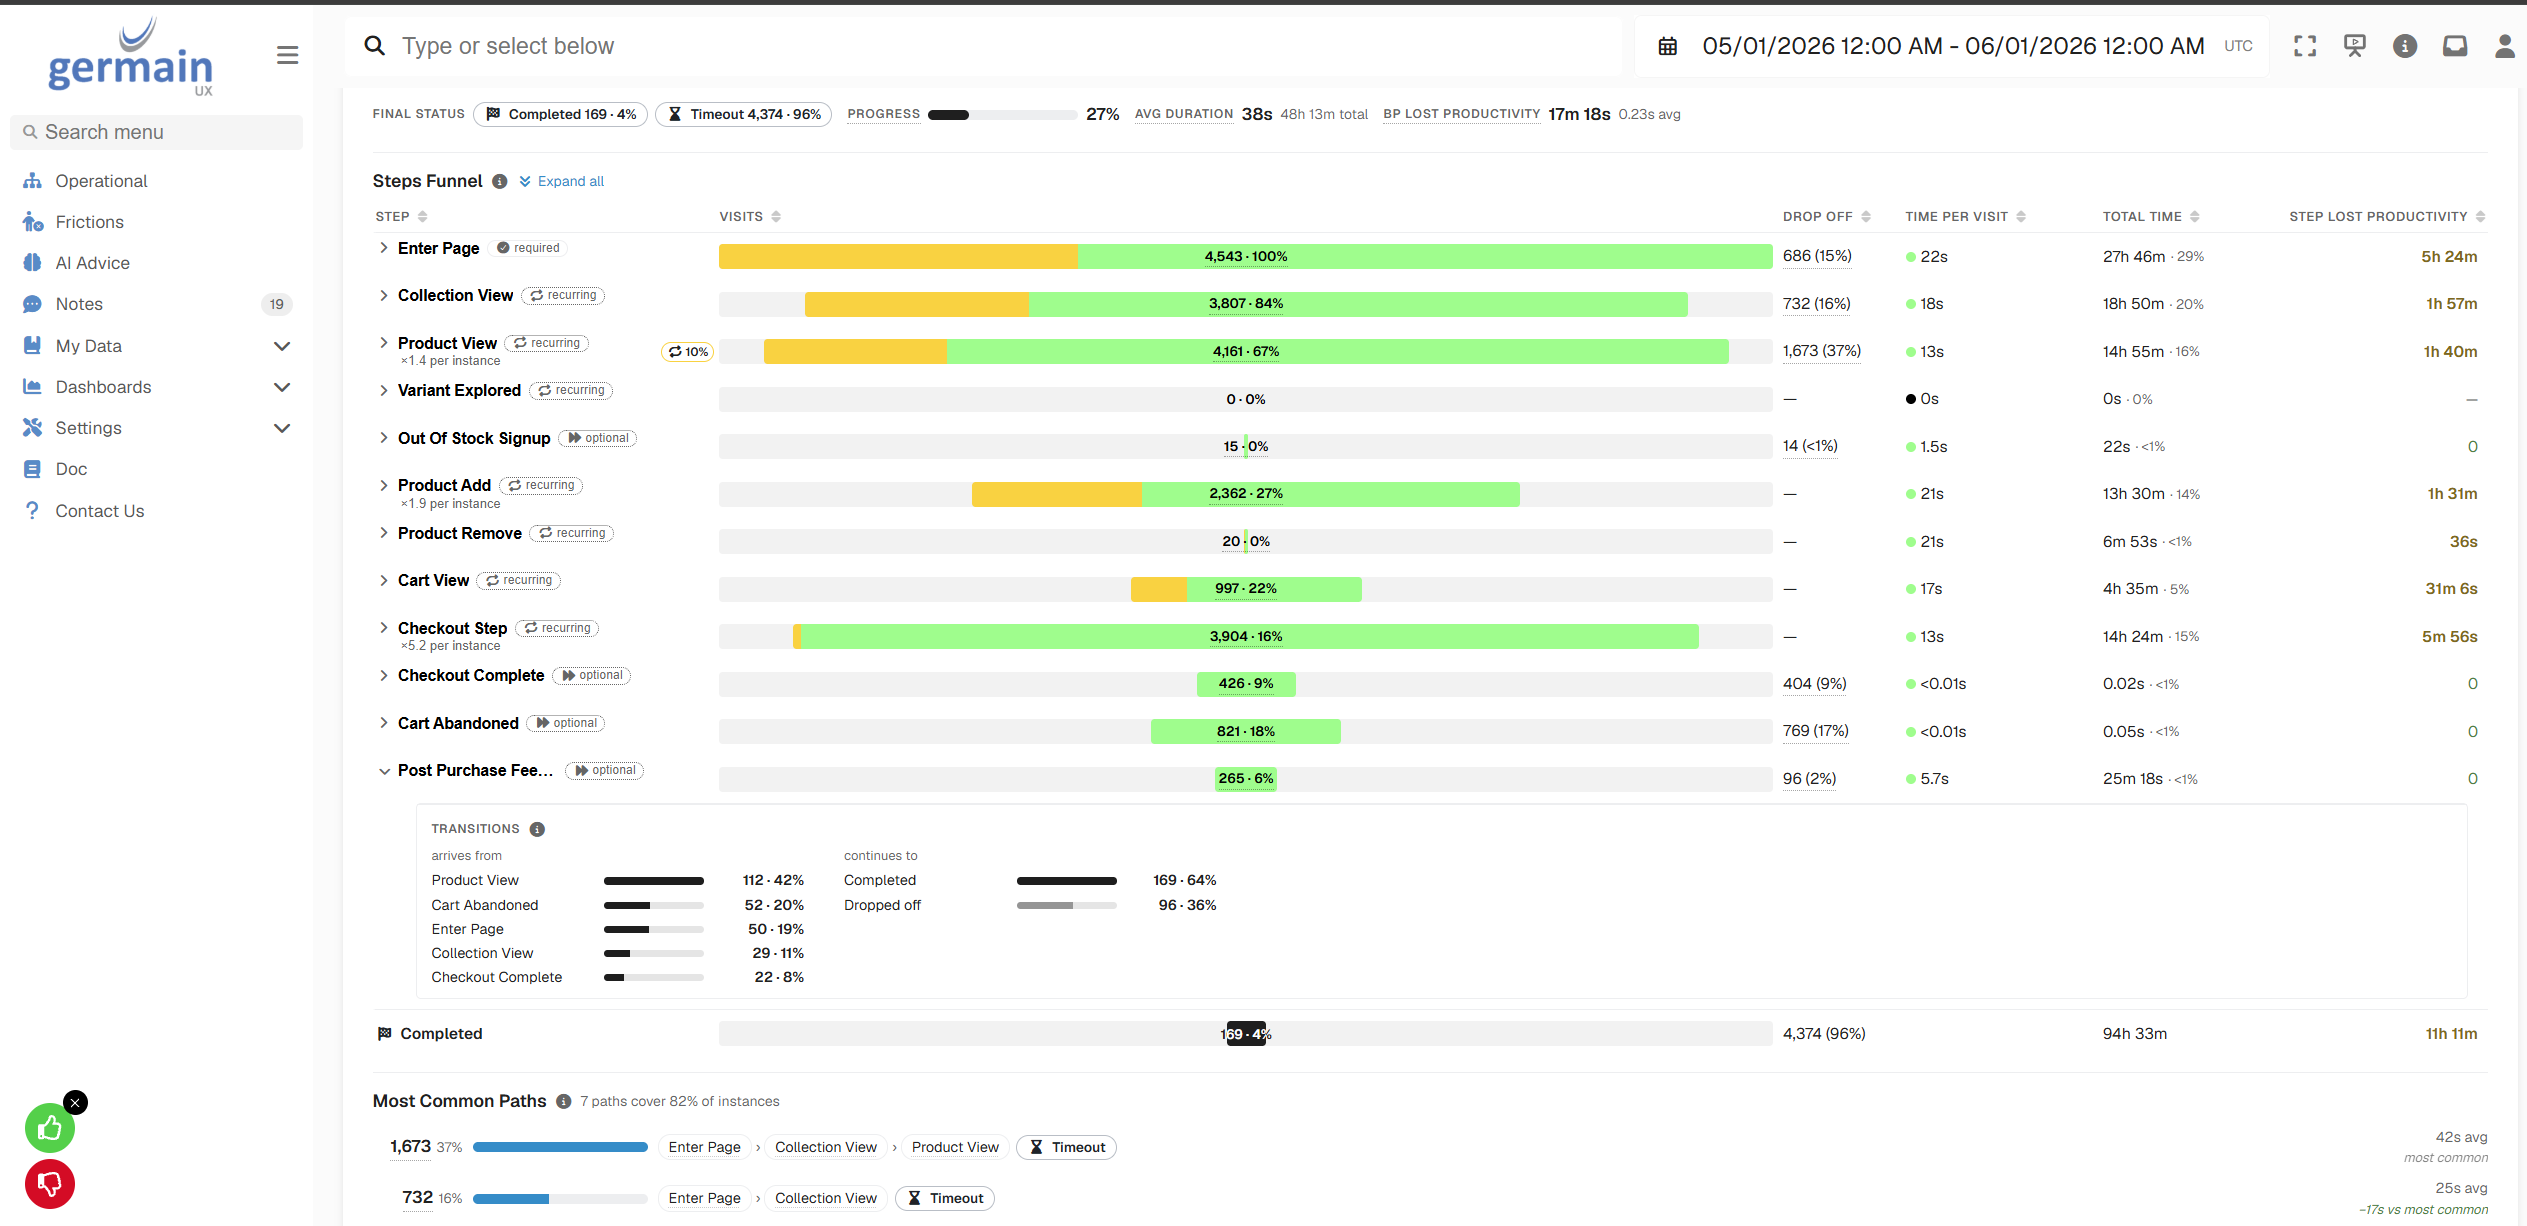
|
|
Employee workflow |
Application usage, process milestones, delays, errors and lost productivity across sales or support teams |
|
Customer service |
Search, chatbot, agent availability, conversation, case creation and resolution |
|
Order fulfillment |
Purchase, inventory, approval, processing, shipment and delivery across connected systems |
Journey definitions and insights can be tailored to the application, industry and business outcome.
🗺️ Flow and Milestone Analysis
GermainUX flow visualizations show how users and processes progress between configured milestones.
Flow analysis helps teams understand:
-
The number of users or process instances reaching each stage
-
Common paths and alternative routes
-
Completion and drop-off between milestones
-
Repeated or looping behavior
-
Steps with excessive duration or waiting time
-
Errors and performance conditions associated with each transition
-
Differences across users, teams, products, devices or other segments
🎞️ Focused Flow and Story Beats
Focused Flow can analyze journey progression using user clicks, business-process data, Story Beats or custom events. Story Beats represent meaningful events within a digital or operational story, allowing organizations to model journeys according to business meaning rather than page URLs alone.
Learn more about Story Beats and Focused Flow.
🔍 Behavior Analysis
GermainUX analyzes how users behave throughout a journey and where behavior indicates confusion, frustration or disengagement.
Behavioral evidence can include:
-
User paths and navigation
-
Clicks, selections and searches
-
Rage clicks and dead clicks
-
Repeated or unnecessary actions
-
No-result searches
-
Inactivity and abandonment
-
Page and feature engagement
-
Heatmaps and behavioral overlays
-
Return visits and repeated attempts
Comparing users who completed the journey with those who did not helps teams identify the behavior most associated with success or failure.
Learn more about Behavior Analysis.
📉 Drop-Off and Completion Analysis
GermainUX detects when eligible users or process instances fail to reach the intended completion event.
Analysis can show:
-
The milestone where abandonment occurred
-
Drop-off count, rate and share
-
Users and sessions affected
-
Time spent before abandonment
-
Last completed step
-
Repeat attempts or later recovery
-
Conversion, productivity or operational impact
-
Behavioral and technical conditions preceding the drop-off
Drop-offs should be based on a defined or credibly inferred intent and completion event. A normal page exit is not necessarily abandonment.
⏱️ User and Process Time Mining
GermainUX measures how long users and automated processes spend across journeys and workflow stages.
Time analysis can identify:
-
Steps taking longer than expected
-
Waiting time between milestones
-
Manual approvals and handoff delays
-
Repeated work
-
Application slowness affecting completion
-
Process overrun and lost productivity
-
Differences across users, teams, applications or versions
Teams can quantify time lost at scale and then investigate representative instances to understand why the delay occurred.
Learn more about Workflow Monitoring.
⚠️ Friction Detection and Impact Analysis
GermainUX correlates journey outcomes with behavioral, workflow, experience and technology friction.
🧠 Behavioral Friction
-
Confusing navigation
-
Repeated or ineffective interactions
-
Failed searches
-
Abandonment after hesitation
-
Low engagement with an important action
🔁 Workflow Friction
-
Excessive or unclear steps
-
Manual approvals and waiting
-
Failed process handoffs
-
Missing or outdated business data
-
Automation that did not execute
🛠️ Technology Friction
-
User-facing errors
-
Slow pages or application operations
-
Browser freezes and crashes
-
Failed APIs, databases or integrations
-
Unavailable services or infrastructure
💼 Business and Experience Friction
-
Out-of-stock products
-
Unexpected fees or policies
-
Unavailable agents or chat services
-
Inadequate payment or delivery options
-
Irrelevant content or guidance
Teams can filter journey views and use detailed Analysis dashboards to determine which friction affects the greatest number of users or creates the most business impact.
🎬 Session Replay and Instance Analysis
Population-level flow and timing identify the pattern. GermainUX Session Replay provides evidence of what an individual user experienced.
Replay can show:
-
The user’s path and apparent objective
-
The sequence and timing of interactions
-
Process milestones reached
-
Errors, delays and failed requests
-
Signs of confusion or frustration
-
What happened immediately before abandonment or failure
-
Whether the user recovered or changed course
This helps teams investigate journey problems without asking users to reproduce them or selecting recordings at random.
Learn more about Session Replay and Monitoring.
Feedback in Journey Context
The GermainUX Feedback Popup—or an integrated third-party feedback source—can collect ratings and comments during the journey.
Feedback can be associated with:
-
The user and session
-
Journey stage
-
Application, page or feature
-
Errors and performance conditions
-
Completion or abandonment outcome
-
Product, service or workflow involved
Each response can be analyzed alongside the corresponding Session Replay, allowing teams to understand why the feedback was provided and whether the same issue affects other users.
Learn more about the Feedback Popup.
Conversation and Chatbot Context
When conversation data is available from an integrated chatbot or human-agent platform, GermainUX can analyze the interaction as part of the journey.
Analysis can help determine:
-
Why the user requested assistance
-
Whether an agent or chatbot was available
-
Whether the question was understood and answered
-
Whether the conversation helped the user progress
-
Whether the interaction resulted in conversion, resolution or abandonment
-
Which application or technology friction preceded the conversation
Providing Context to Integrated Chatbots
GermainUX can provide authorized contextual signals to compatible chatbot or guidance systems so they can respond more effectively.
Examples include:
|
Detected condition |
Possible chatbot response |
|
Product is out of stock |
Recommend available alternatives |
|
Search returns no results |
Suggest alternative terms, categories or products |
|
User is blocked at a workflow step |
Provide guidance for the next valid action |
|
Application error or service outage occurs |
Explain the condition or provide an alternative path |
The chatbot determines and delivers the response; GermainUX supplies relevant monitored context through the configured integration.
Learn more about chatbot integration.
Configuration Examples
Out-of-Stock Product Attempts
An example portlet for monitoring customers attempting to purchase unavailable products can use:
-
Portlet KPI:
Notify As Not In Stock -
Portlet filter:
Name == "Not In Stock Notification"
Agent or Chat Service Unavailable
An example portlet for identifying chat attempts when no representative is available can use:
-
Portlet KPI:
Chat Event -
Portlet filter:
Agent Is Available == false && Name == "Chat Created"
Exact KPI names, fields and filters may vary by application, data source and GermainUX configuration.
Segmentation and Business Impact
Journey outcomes can be segmented by dimensions such as:
-
Customer, employee, role or team
-
New versus returning user
-
Application, page or workflow
-
Product, service, campaign or account
-
Device, browser or version
-
Region or location
-
Error, performance or availability condition
-
Completed, abandoned or failed outcome
GermainUX can prioritize journey friction using measures such as affected users, completion rate, conversion impact, revenue, lost productivity, process duration and SLA severity.
AI-Assisted Journey Analysis
AI Explore can help teams ask questions about the available journey evidence, including:
-
Where do users or processes experience the greatest friction?
-
Why does one segment complete less often than another?
-
Which related KPIs changed at the same time?
-
What patterns appear across relevant sessions?
-
Which probable causes should be investigated first?
-
What corrective actions may improve completion?
AI-generated findings should be validated against the journey definition, underlying metrics, Session Replay and technical evidence.
Alerts, Reports and Automation
GermainUX can turn journey analysis into action through:
-
Real-time alerts for failed or delayed journeys
-
Anomaly detection for completion, drop-off and duration changes
-
Scheduled conversion, adoption and productivity reports
-
Links to affected segments and Session Replay
-
Dynamic investigation actions
-
Approved follow-up or remediation workflows
Automation should be used where the detection and response are sufficiently understood and controlled.
Validate Improvement
After a journey, workflow, UX or technology change is deployed, GermainUX can verify whether:
-
Completion and conversion improved
-
Drop-off declined
-
Users progressed through milestones faster
-
Errors and delays decreased
-
Lost productivity was reduced
-
Customer or employee feedback improved
-
The improvement persisted across segments and application versions
Security and Privacy
Journey analysis may combine user, business-process, conversation and application data. Collection and access should follow the organization’s consent, privacy, retention, security and governance requirements.
Depending on the deployment, GermainUX can mask, anonymize or exclude sensitive information and restrict access to authorized users.
ℹ️ Get Help
The Germain Team can help you set this up. Contact GermainUX Support.
Service: Analytics
Feature Availability: 2021.3 or later