
💾 Windows Application Monitoring, Analytics, and Automation
Overview: GermainUX continuously monitors native Windows applications and their supporting environments, 24/7 and in real time. It helps organizations identify and resolve the user experience, workflow, application, and technology issues that reduce adoption, employee productivity, operational efficiency, and application reliability.
By combining Real User Monitoring, native Windows Session Replay, process monitoring, application performance monitoring, code-level diagnostics, infrastructure observability and automation, GermainUX helps teams understand not only what happened, but also why it happened, who was affected and what action should be taken. When appropriate and considered safe, remediation can also be automated.
🎯 Business Outcomes
GermainUX helps organizations using Windows applications:
|
Outcome |
Details |
|---|---|
|
Improve employee productivity |
Improve employee productivity by identifying slow, confusing or inefficient workflows. |
|
Increase application adoption |
Increase application adoption by understanding how users interact with features and where they encounter friction. |
|
Reduce detection and resolution time |
Reduce the time required to detect, diagnose and resolve Windows application issues. |
|
Investigate without reproduction |
Investigate problems without requiring users to reproduce them. |
|
Identify failures affecting real users |
Identify application freezes, crashes, errors and slow operations affecting real users. |
|
Distinguish issue sources |
Distinguish issues caused by the application, code, dependencies, Windows environment or user workflow. |
|
Prioritize improvements |
Prioritize improvements according to the users affected and the resulting productivity or business impact. |
|
Detect and automate remediation |
Detect emerging issues proactively and automate safe remediation workflows. |
👀 What GermainUX Monitors
GermainUX provides connected visibility from the user’s interaction with a native Windows application to the application code, dependencies and supporting Windows environment.
|
Category |
Details |
|---|---|
|
User experience |
User experience: Mouse and keyboard activity, window changes, text input, searches, messages, and user sessions |
|
Adoption and productivity |
Adoption and productivity: Feature usage, workflow progression, repeated actions, delays, and time lost |
|
Application behavior |
Application behavior: Startup, shutdown, state changes, application events, freezes, and crashes |
|
Performance |
Performance: Application responsiveness, operation duration, transactions, and resource consumption |
|
Errors |
Errors: User-facing messages, exceptions, failures, and affected sessions |
|
Code and dependencies |
Code and dependencies: Application code, APIs, databases, files, network services, and connected systems |
|
Windows environment |
Windows environment: Services, processes, CPU, memory, disk, network, and Windows events |
🎬 Native Windows Session Replay
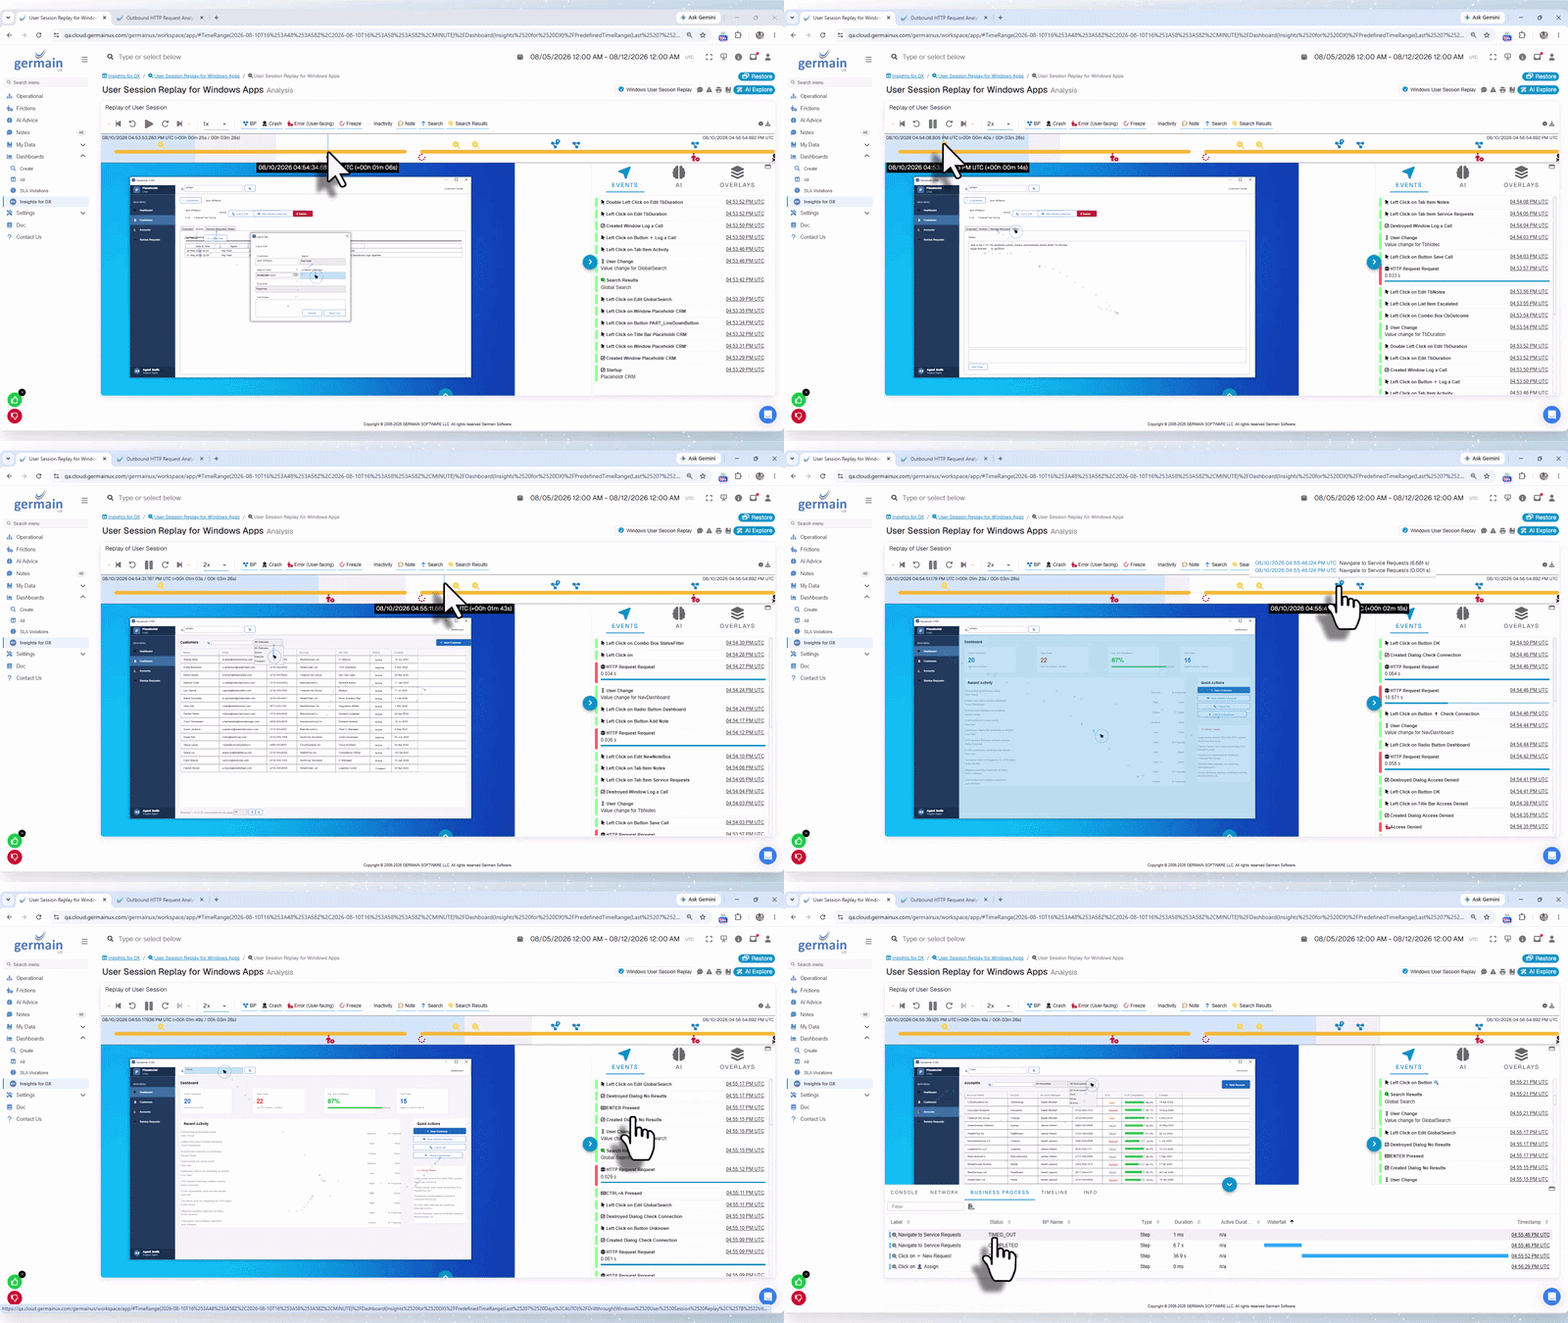
GermainUX records and replays real user activity inside native Windows applications. Session Replay visually reconstructs what occurred during a user’s session, allowing teams to investigate an issue without asking the user to reproduce it.
Unlike browser-only replay technologies, GermainUX Windows Session Replay is designed for native desktop applications, including applications built with technologies such as .NET, C# and C++.
🛠 Teams can use Session Replay to:
|
Capability |
Details |
|---|---|
|
See user actions |
See exactly what the user did before an issue occurred |
|
Understand sequence |
Understand the sequence of interactions, window changes and application events |
|
Investigate unexpected behavior |
Investigate unexpected behavior, freezes, crashes and errors |
|
Identify workflows |
Identify confusing or inefficient workflows |
|
Correlate events |
Correlate user activity with application, code and technology events |
|
Search sessions |
Search for specific actions, messages or conditions across sessions |
|
Replay relevant portions |
Replay the most relevant portion of a session whenever needed |
Recorded sessions can become available for analysis shortly after the activity occurs, subject to the deployed configuration and processing conditions.
🔍 Searchable Sessions and Events
Teams can search across recorded sessions to find users who:
|
Search Target |
Details |
|---|---|
|
Encountered a specific error or message |
Encountered a specific error or message |
|
Performed a particular action |
Performed a particular action |
|
Used a specific application feature |
Used a specific application feature |
|
Experienced performance issues |
Experienced a slow operation, freeze or crash |
|
Repeated interactions |
Repeated an interaction |
|
Abandoned workflows |
Abandoned or failed to complete a workflow |
|
Identified technology conditions |
Experienced an identified technology condition |
This makes Session Replay useful not only for investigating individual support incidents, but also for identifying recurring friction across a large user population.
🤖 AI-Generated Session Summaries
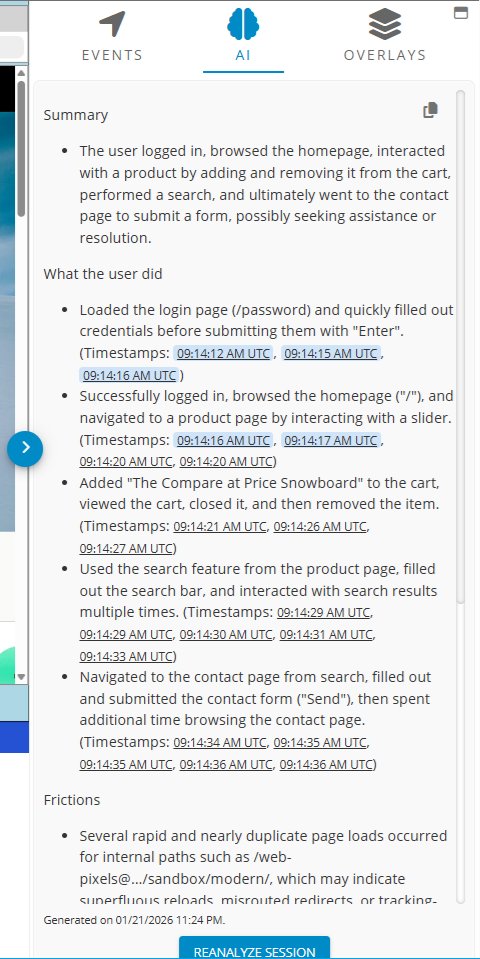
GermainUX can summarize an individual Windows application session so teams can understand what the user attempted to accomplish, where friction occurred and what may have affected productivity or adoption without replaying the entire session.
Multiple sessions can also be analyzed together to identify and rank the most frequent or consequential user experience, workflow and technology issues.
📊 User Experience and Adoption Analytics
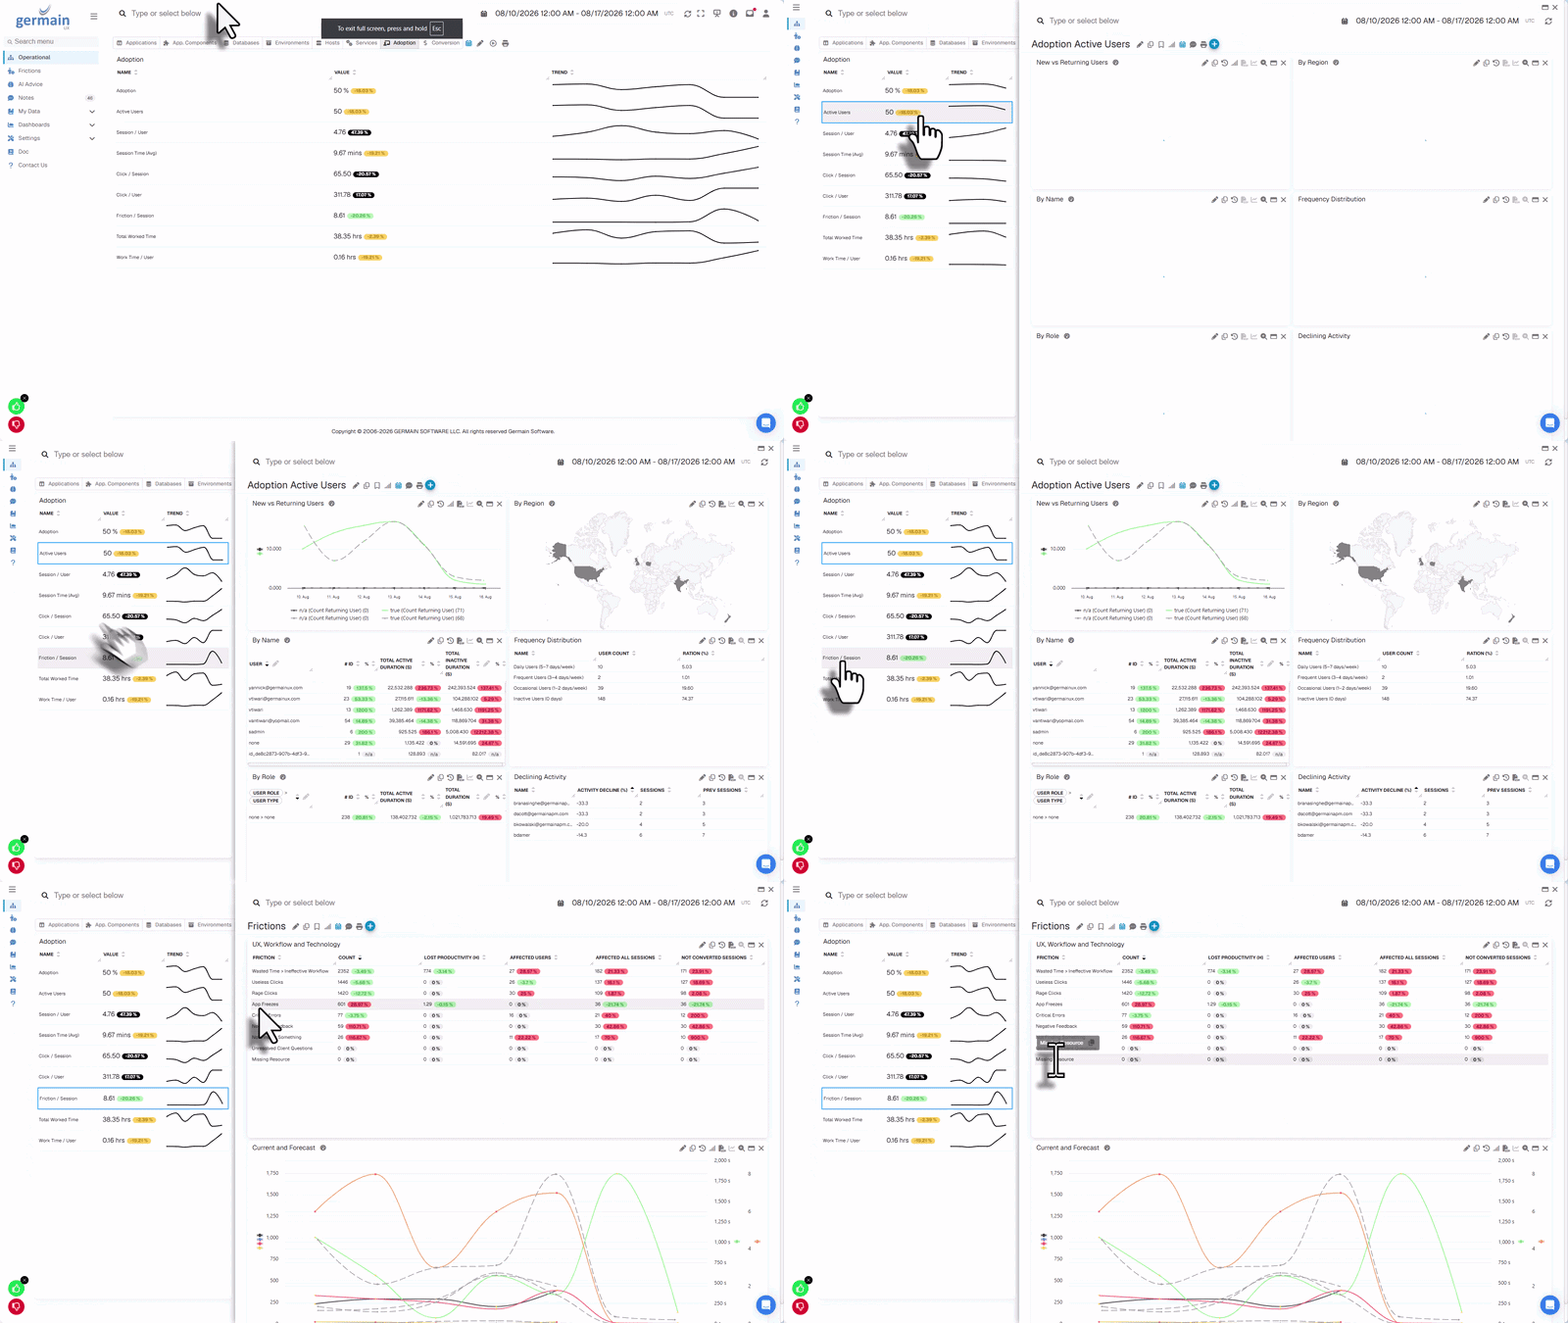
GermainUX captures how Windows applications are actually used instead of relying only on application logs or user descriptions.
📋 Analysis can include:
|
Metric |
|---|
|
Application and feature usage |
|
User interactions and navigation |
|
Session volume and duration |
|
Window and application-state changes |
|
Keyboard, mouse, search and text-input activity |
|
User-facing messages |
|
Repeated or unnecessary interactions |
|
Errors, freezes and crashes |
|
Performance conditions |
-20260823-171225.gif?cb=4dc22f4a9d4e34fc491e2b2aa2729287)
These insights help product, operations, support and engineering teams determine whether an adoption problem is caused by training, workflow design, application usability or technical behavior.
⚙️ Workflow and Productivity Analysis
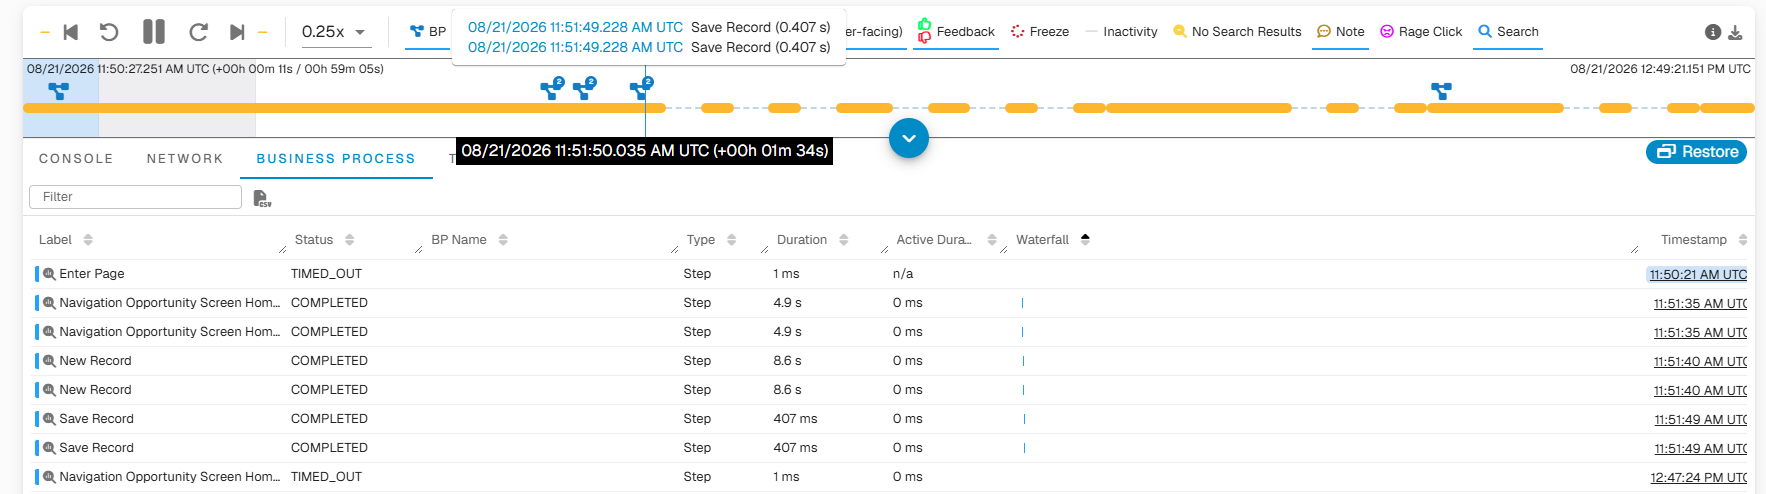
GermainUX monitors the business processes performed through Windows applications and identifies where they become inefficient.
It can help identify:
|
Issue |
Details |
|---|---|
|
Long workflows |
Workflows taking longer than expected |
|
Bottlenecks |
Bottlenecks and excessive waiting time |
|
Repeated actions |
Repeated or unnecessary actions |
|
Failed processes |
Failed or abandoned processes |
|
Interrupting conditions |
Application conditions that interrupt work |
|
Disproportionate impact |
Users, teams, applications or workflow stages disproportionately affected |
Time lost can be quantified across individual sessions and larger populations. Teams can then replay the sessions contributing to the measured loss and determine whether the cause is UX friction, application performance, errors, code, infrastructure or the process itself.
🚤 Application Performance Monitoring
GermainUX monitors the performance and responsiveness of Windows applications as experienced by real users.
It can help identify:
|
Performance Issue |
Details |
|---|---|
|
Slow startup/shutdown |
Slow application startup or shutdown |
|
Slow user operations |
Slow user operations and long-running transactions |
|
Hangs and freezes |
Application hangs, freezes or degraded responsiveness |
|
Bottlenecks |
Performance bottlenecks |
|
High resource consumption |
High application resource consumption |
|
Slow external services |
Slow APIs, databases or connected services |
|
Regressions over time |
Performance regressions and changes over time |
Performance data can be correlated with the affected user, session, workflow, application event, code execution and supporting technology to determine what caused the observed experience.
💥 Error, Freeze and Crash Analysis
GermainUX captures and analyzes application errors, exceptions, freezes and crashes in real time.
For each issue, teams can determine:
|
Question |
Details |
|---|---|
|
What went wrong |
What went wrong |
|
When and frequency |
When and how frequently it occurred |
|
Involved component |
Which application, version or component was involved |
|
Affected users |
Which users and sessions were affected |
|
Preceding actions |
What the user was doing immediately before the issue |
|
Nearby events |
Which application and technology events occurred nearby |
|
Scope |
Whether the problem is isolated, new or recurring |
Issues can be investigated directly in the context of the user’s session. This evidence helps support and engineering teams move from a user report to a reproducible, evidence-backed diagnosis more quickly.
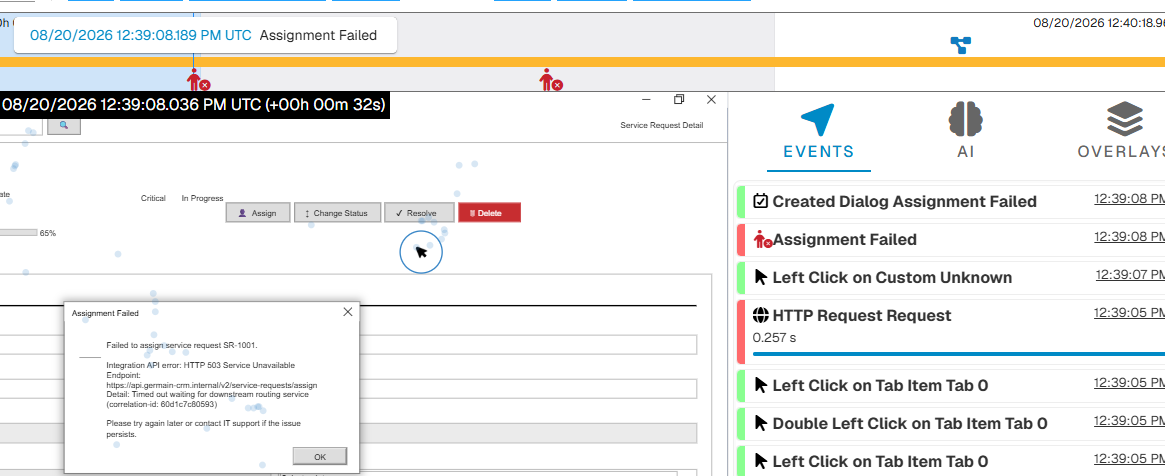
🔗 Code, Transaction and Dependency Analysis
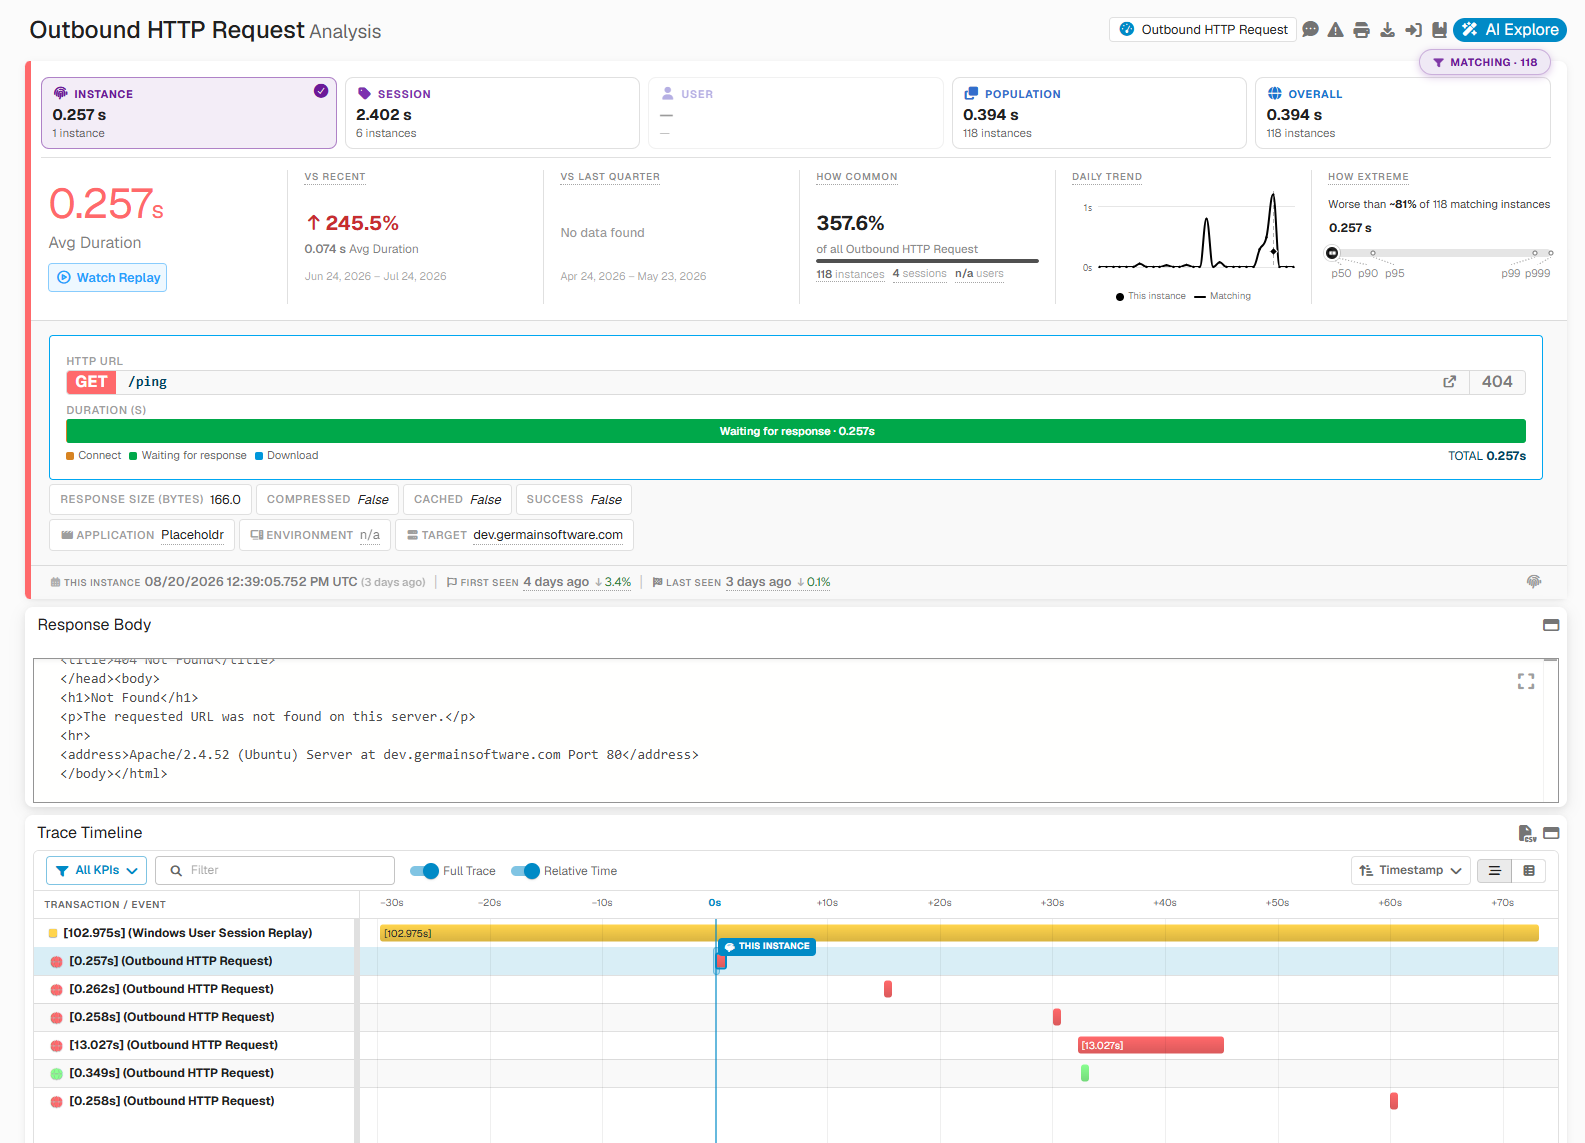
Windows applications commonly depend on application code, APIs, databases, files, web services, network services and other systems. GermainUX can monitor these observable dependencies and correlate their behavior with the Windows application experience.
A user interaction can be analyzed across the following chain:
User interaction → Application event → Code or transaction → API or network call → Database or backend service → Windows infrastructure
This helps teams distinguish whether an issue originated in:
|
Possible Origin |
|---|
|
The Windows application or its code |
|
The user’s workflow |
|
An API, database or backend service |
|
A file or external dependency |
|
Network latency or connectivity |
|
IIS or another web service |
|
The Windows operating system or infrastructure |
🔬 Code-Level Diagnostics
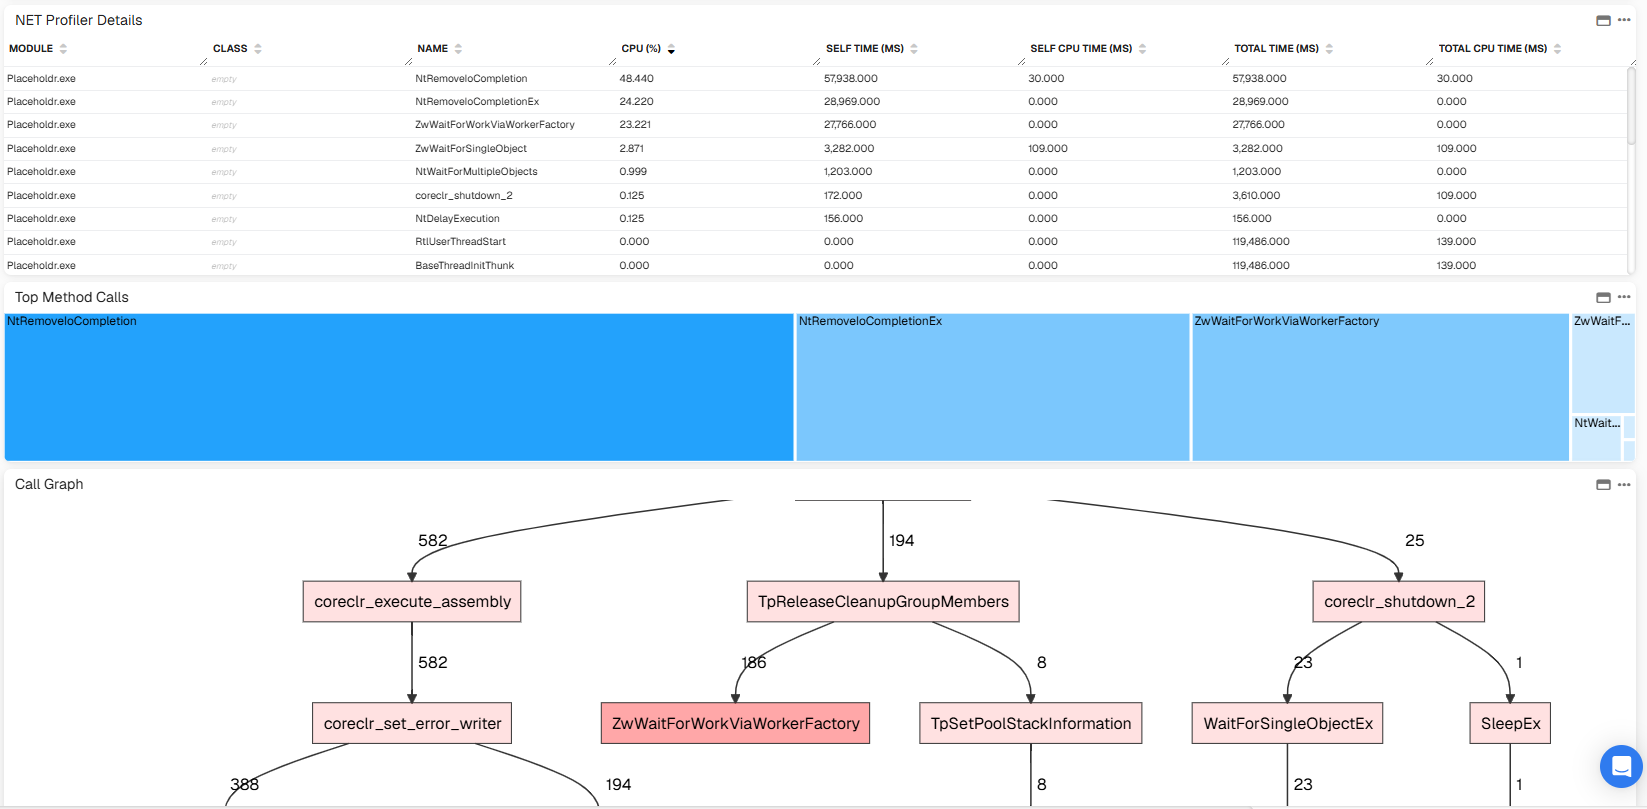
When the GermainUX Code Profiler or other supported instrumentation is deployed, transaction and performance evidence can be correlated with the relevant application code. The depth of code visibility depends on the application technology and instrumentation configuration.
This allows engineering teams to identify the code, call or dependency contributing to a slow or failed user operation instead of stopping at the observation that the desktop application was unresponsive.
💻 Windows Operating System Monitoring
In addition to application monitoring, GermainUX can monitor the availability and performance of Windows servers and operating systems.
Windows Management Instrumentation and other configured data sources can provide metrics such as:
|
Metric |
|---|
|
Server and OS availability |
|
Windows service availability |
|
CPU and memory utilization |
|
Disk capacity and I/O |
|
Network activity |
|
Process availability |
|
Windows events |
|
Customer-specific metrics |
This provides visibility from the user interaction down to the Windows infrastructure supporting the application. Infrastructure data can be correlated with application degradation to determine whether resource constraints or operating-system conditions contributed to the user’s experience.

🧠 AI-Assisted Analysis
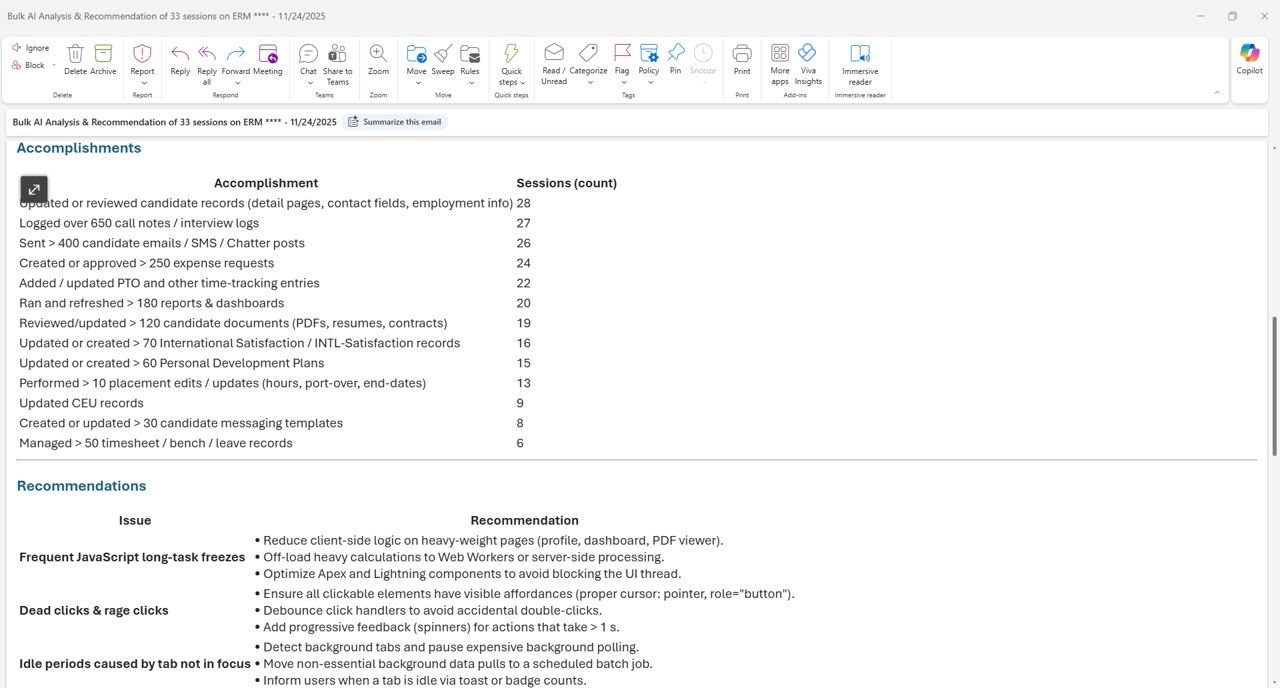
AI Explore allows teams to ask natural-language questions about user experience, adoption, productivity, workflows, application behavior and technology issues. It is available across preconfigured and custom KPIs and can analyze relationships across multiple KPIs.
GermainUX can also assist teams by:
|
Capability |
Details |
|---|---|
|
Detect anomalies |
Detecting anomalies and outliers |
|
Identify friction |
Identifying friction across user behavior, workflows and technology. |
|
Summarize sessions |
Summarizing individual or multiple user sessions |
|
Categorize issues |
Categorizing errors, freezes and crashes |
|
Identify affected entities |
Identifying the users, applications and processes most affected |
|
Recommend actions |
Recommending areas for further investigation or corrective action |
AI-generated findings should support—not replace—appropriate operational and technical review.
🔔 Alerts, Proactive Detection and Automated Remediation
GermainUX can turn Windows application monitoring and analysis into action through:
|
Action |
Details |
|---|---|
|
Real-time alerts |
Real-time alerts: Notify the appropriate teams when an issue or SLA violation occurs. More details |
|
Synthetic monitoring |
Synthetic monitoring: Execute critical application workflows proactively to detect issues before they affect real users. More details. |
|
Anomaly detection |
Anomaly detection: Identify unusual behavior, errors, performance changes, and resource conditions. More details. |
|
Guided investigation |
Guided investigation: Provide direct access to relevant analysis, Session Replay, and AI Explore |
|
Automated remediation |
Automated remediation: Execute approved recovery workflows when automation is considered safe. More details. |
Examples can include restarting a failed Windows service, initiating a recovery workflow or performing another predefined corrective action under controlled conditions.
📈 Dashboards, KPIs and Reports
GermainUX provides preconfigured and configurable dashboards, KPIs and reports for Windows application experience and technology health.
Examples include:
|
Dashboard |
Details |
|---|---|
|
User experience |
User experience: User interactions, session volume, session duration, and repeated actions |
|
Adoption and productivity |
Adoption and productivity: Feature usage, workflow completion, and time lost |
|
Application health |
Application health: Availability, startup, shutdown, freezes, crashes, errors, and exceptions |
|
Performance |
Performance: Application response time, operation duration, and transaction performance |
|
Windows environment |
Windows environment: Process, service, CPU, memory, disk, network, and Windows event measures |
Custom KPIs and analytics can also be created according to the application, workflow and operational requirements of the organization.
Scheduled reports can summarize the most important experience, productivity and technology issues and provide links to the evidence required for further investigation.
🛡️ Security and Privacy
Security and privacy controls help restrict access to sensitive information captured from Windows applications and support organizational compliance requirements.
Depending on the deployment, sensitive content can be masked, anonymized or excluded from collection. Collection and access policies should be configured according to the application’s data, user population, organizational permissions and applicable privacy requirements.
📦 Supported Windows Applications and Deployment
GermainUX Windows Session Replay is designed for native Windows applications, including applications developed using .NET, C# and C++. The precise monitoring depth depends on the application technology, operating-system environment, security controls and GermainUX components deployed.
Monitoring can cover both locally installed desktop applications and Windows applications whose supporting services or dependencies run elsewhere, provided the required instrumentation and data access are configured.
Deployment and configuration
|
For your Windows Application environment |
|---|
|
Review the Windows Application Monitoring Deployment Overview. |
|
Deploy Real User Monitoring, Session Replay, customer-journey analysis, heatmaps, errors, and performance monitoring (GermainUX RUM Windows). |
|
Configure business-process monitoring e.g detection of drop-off, loss of productivity, etc. |
|
Configure Error Monitoring for Windows Application. |
|
Configure User Feedback for Windows Application. |
|
Deploy various other automation (via GermainUX Engine) when Windows Application APIs, integrations, logs, synthetic monitoring, reports, or automation are required. |
|
Deploy the GermainUX RPA Bot Recorder to create synthetic user scenarios. |
|
Review the available Windows Application Monitoring KPIs. |
Component requirements and feature availability depend on the desired monitoring depth, .NET permissions, browser-extension deployment, enabled Windows Appliction APIs, and connected-system architecture.
📦 Additional Resources
-
Deploy Monitoring or automation for Windows application.
-
Configure Monitoring or automation for Windows application
-
AI Insights & Recommendations
-
More Analytics Features
-
More Automation Features
ℹ️ Get Help
The Germain Team can help you set this up. Contact GermainUX Support.
Component: Engine, JS Profiler, Mobile App, RPA Bot Recorder, RUM Windows, Agent
Feature Availability: 2026.2