
Configure Monitoring for Node.js
Configure GermainUX Node.js monitoring to control application telemetry, HTTP monitoring, asynchronous correlation, errors, warnings, Promise behavior, transactions, resource monitoring, privacy, analytics, alerts, dashboards, and automation.
This guide assumes the @germainapm/nodejs-monitoring package is already installed and initialized.
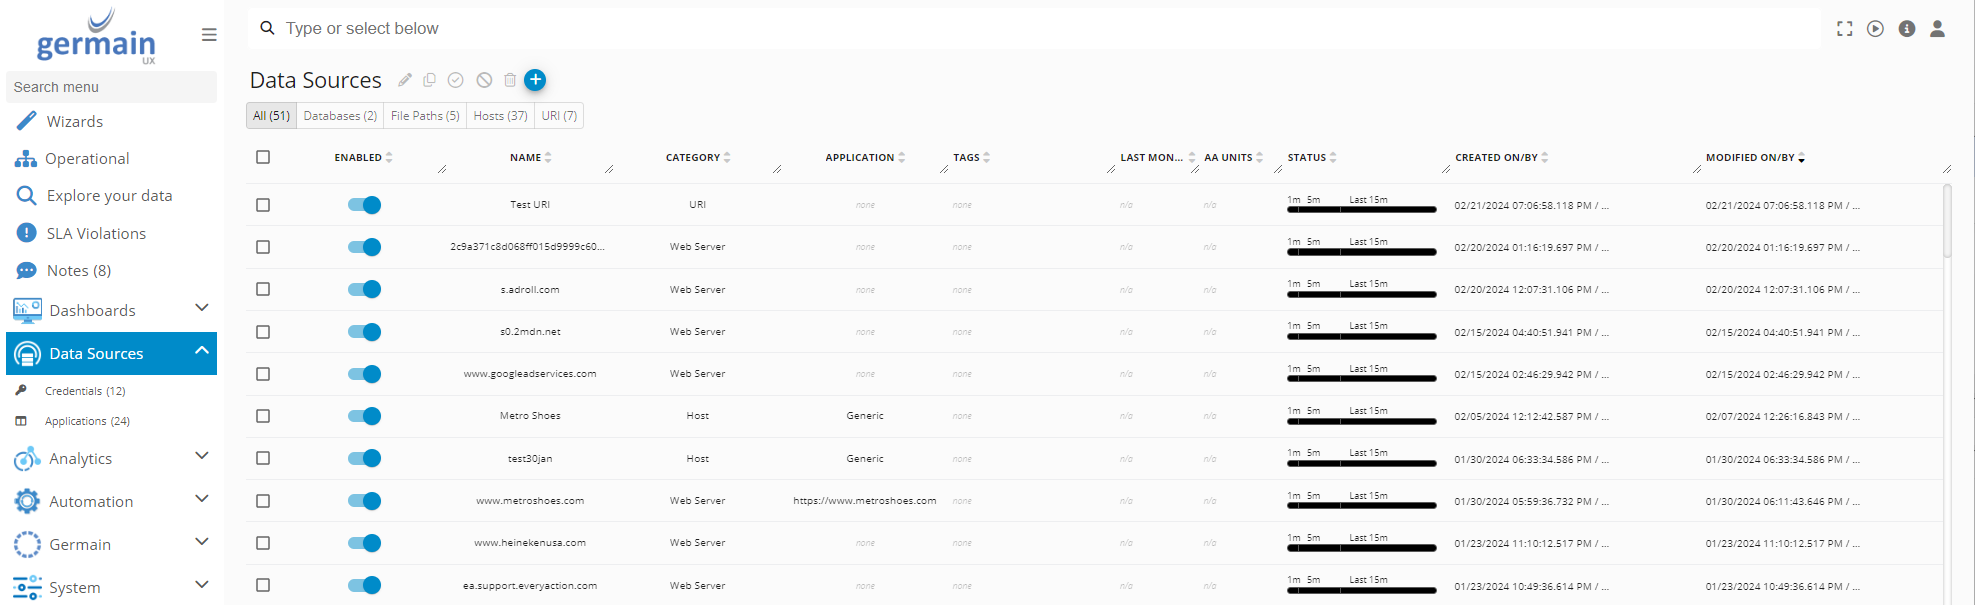
⚙️ Configure the Node.js Data Source
Enable and configure the Node.js data source that GermainUX will monitor.
Depending on the environment, the data source can identify information such as:
-
File path
-
Host
-
URI
-
Application endpoint
-
Monitored runtime
Enable only the Node.js data sources that GermainUX should collect or analyze data from.
🏷️ Configure the Application
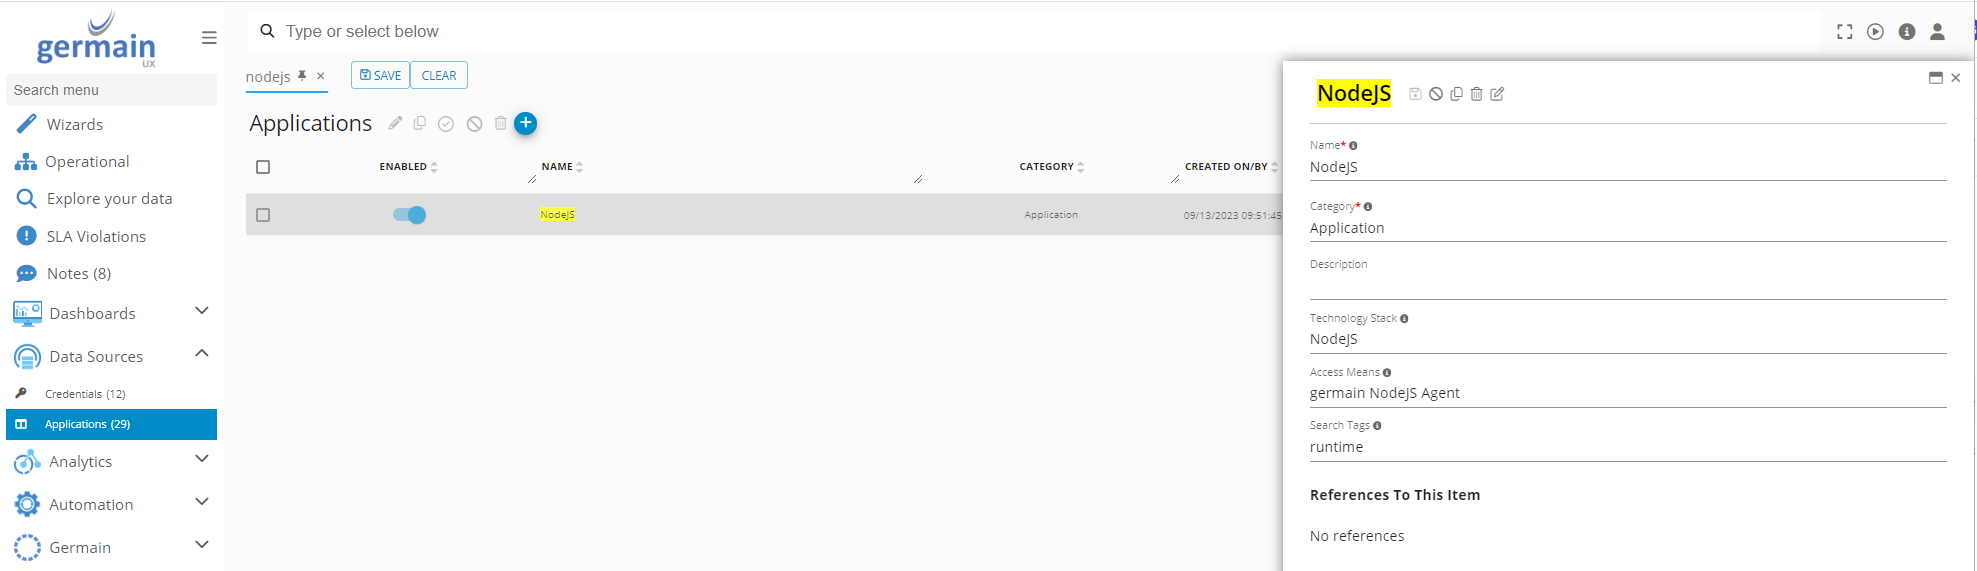
Configure the Node.js application in GermainUX so collected telemetry is associated with the correct application.
Use consistent application naming across:
-
Production
-
Staging
-
Development
-
Application components
-
Services
Application identity can also be configured programmatically:
const config = GermainAPM.getDefaultConfiguration(
    'https://GERMAIN_APM_SERVER/',
    'APP_NAME'
);
Application and component can also be specified separately:
config.defaults.application = {
    name: 'APP_NAME',
    component: 'APP_COMPONENT'
};
⏱️ Configure Monitoring Frequency
Some Node.js monitoring components execute periodically.
The default frequency is 60 seconds.
Configure it using:
config.monitoring.frequencySeconds = 60;
Choose a frequency appropriate for the required visibility and monitoring overhead.
🔗 Configure Asynchronous Correlation
By default, GermainUX correlates incoming HTTP requests with asynchronous outgoing HTTP requests.
This supports tracing such as:
Incoming HTTP Request → Node.js Processing → Outgoing HTTP Request → Downstream Service
Disable asynchronous correlation when required:
config.monitoring.asyncCorrelation = false;
Correlation introduces a small performance overhead, so enable it where transaction tracing is valuable.
📤 Configure Data Distribution
GermainUX periodically sends collected telemetry to the GermainUX Server.
Configure the maximum interval between transmissions using:
config.datapoints.maxFlushTimeSeconds = 60;
The data transport configuration also supports controls for:
-
Sending or discarding telemetry
-
Compression
-
Maximum datapoints retained in memory
-
Maximum flush interval
Available settings include:
config.datapoints.sendData
config.datapoints.compress
config.datapoints.maxNumInMemory
config.datapoints.maxFlushTimeSeconds
Compression is enabled by default.
🌐 Configure Incoming HTTP Monitoring
Incoming HTTP monitoring is enabled by default.
Control it using:
config.monitoring.httpIncoming.enabled = true;
A custom session extractor can also be configured when the application needs application-specific session correlation.
This is useful when an incoming request contains a session identifier that GermainUX should associate with downstream activity.
🌍 Configure Outgoing HTTP Monitoring
Outgoing HTTP monitoring is enabled by default.
Control it using:
config.monitoring.httpOutgoing.enabled = true;
Outgoing HTTP telemetry can be correlated with the incoming transaction to provide visibility into downstream service calls.
🚨 Configure Unhandled Exception Monitoring
Unhandled exception monitoring is enabled by default.
Configuration supports:
-
Enable / disable monitoring
-
Whether the Node.js process exits after an error
-
Application callback when an error occurs
Available configuration includes:
config.monitoring.unhandledExceptions.enabled
config.monitoring.unhandledExceptions.exitOnError
config.monitoring.unhandledExceptions.callbackOnError
Review exitOnError carefully because changing it can affect normal Node.js error-handling behavior.
⚠️ Configure Node.js Warning Monitoring
Node.js warning monitoring is enabled by default.
Warnings generated by the Node.js process can be collected and analyzed by GermainUX.
Control this capability using:
config.monitoring.warning = true;
Warnings can be used in:
-
KPIs
-
Dashboards
-
Reports
-
Alerts
-
Trend analysis
🔁 Configure Unhandled Promise Rejection Monitoring
Unhandled Promise rejection monitoring is enabled by default.
Control it using:
config.monitoring.unhandledPromiseRejection = true;
This allows GermainUX to identify asynchronous errors that are not properly handled by the application.
🔄 Configure Multiple Promise Resolve / Rejection Monitoring
GermainUX also monitors when a Promise is resolved or rejected multiple times.
This monitoring is enabled by default.
Disable it using:
config.monitoring.multiplePromiseResolves = false;
🔄 Configure Event Loop Latency Monitoring
Event-loop latency monitoring is enabled by default.
Disable it using:
config.monitoring.eventLoopLatency = false;
High event-loop latency can indicate blocking or resource-intensive application processing.
⚡ Configure Startup Monitoring
GermainUX automatically monitors Node.js startup duration.
By default, startup duration is measured between the Node.js process startup and GermainUX initialization.
Disable automatic startup monitoring using:
config.monitoring.startup = false;
For applications with a more complex initialization process, explicitly indicate when startup has completed:
GermainAPM.collectStartup();
This allows startup duration to reflect the point at which the application is actually ready.
🛑 Configure Exit Monitoring
Node.js process-exit monitoring is enabled by default.
Disable it using:
config.monitoring.exit = false;
Exit monitoring provides useful context when analyzing unexpected application termination or availability issues.
⏱️ Configure Custom Transaction Monitoring
Use custom transactions to monitor important business or application operations.
Start a transaction:
GermainAPM.startTransaction(
    'UNIQUE_TRANSACTION_NAME',
    'AdditionalInformation'
);
End the transaction:
GermainAPM.endTransaction(
    'UNIQUE_TRANSACTION_NAME'
);
Examples of useful transaction names include:
-
ProcessOrder -
CustomerLookup -
GenerateInvoice -
PaymentRequest -
SubmitClaim
Custom transactions can then be analyzed for duration, failure, correlation, and application impact.
💻 Configure Node.js Process Monitoring
By default, GermainUX monitors the Node.js process for:
-
CPU
-
Memory usage
-
Heap size
-
Heap usage
Disable process-resource monitoring using:
config.monitoring.pid = false;
🖥️ Configure OS Resource Monitoring
GermainUX monitors CPU and memory usage of the server hosting the Node.js application.
Disable it using:
config.monitoring.os = false;
💾 Configure Disk Monitoring
GermainUX monitors disk usage of the server hosting the Node.js application.
Disable it using:
config.monitoring.disk = false;
👤 Configure Default Context
Default context can be added to collected datapoints.
Supported default dimensions include:
config.defaults.user
config.defaults.system
config.defaults.application
config.defaults.pid
Use default dimensions when telemetry should consistently be associated with a particular:
-
User
-
System
-
Application
-
Application component
-
Process
Avoid attaching sensitive or unnecessary identifying information.
📝 Configure GermainUX Logging
Logging is enabled at info level and above by default.
Configure logging using:
config.logging.level = 'debug';
config.logging.filename = 'GermainAPM_custom.log';
config.logging.maxFiles = 20;
config.logging.maxSize = 20000000;
Available logging levels are:
-
error -
warn -
info -
verbose -
debug
Default behavior includes rolling log files.
Use verbose and debug logging selectively in production.
🔐 Configure Data Privacy & Exclusions
By default, captured telemetry is sent to GermainUX.
Use field exclusions when data must be protected for security or privacy reasons.
GermainUX supports:
Mask
Replace characters while optionally preserving length and whitespace.
Anonymize
Hash the original value so it can still be correlated without retaining the original value.
Exclude
Remove the captured value.
Example:
config.exclusions = [{
    fieldName: 'sessionId',
    factType: '',
    type: 'MASK',
    name: 'SessionId Anonymization',
    pattern: '',
    preserveLength: true,
    preserveWhitespace: true,
    enabled: true
}, {
    fieldName: 'requestBody',
    factType: 'NodeJS:Outbound',
    type: 'ANONYMIZE',
    name: 'Request Body Exclusion',
    pattern: '',
    preserveLength: true,
    preserveWhitespace: false,
    enabled: true
}];
Review sensitive fields such as:
-
Session identifiers
-
Request bodies
-
Authentication information
-
Tokens
-
User information
-
Personal information
-
Application-specific confidential data
before production deployment.
📈 Configure KPIs
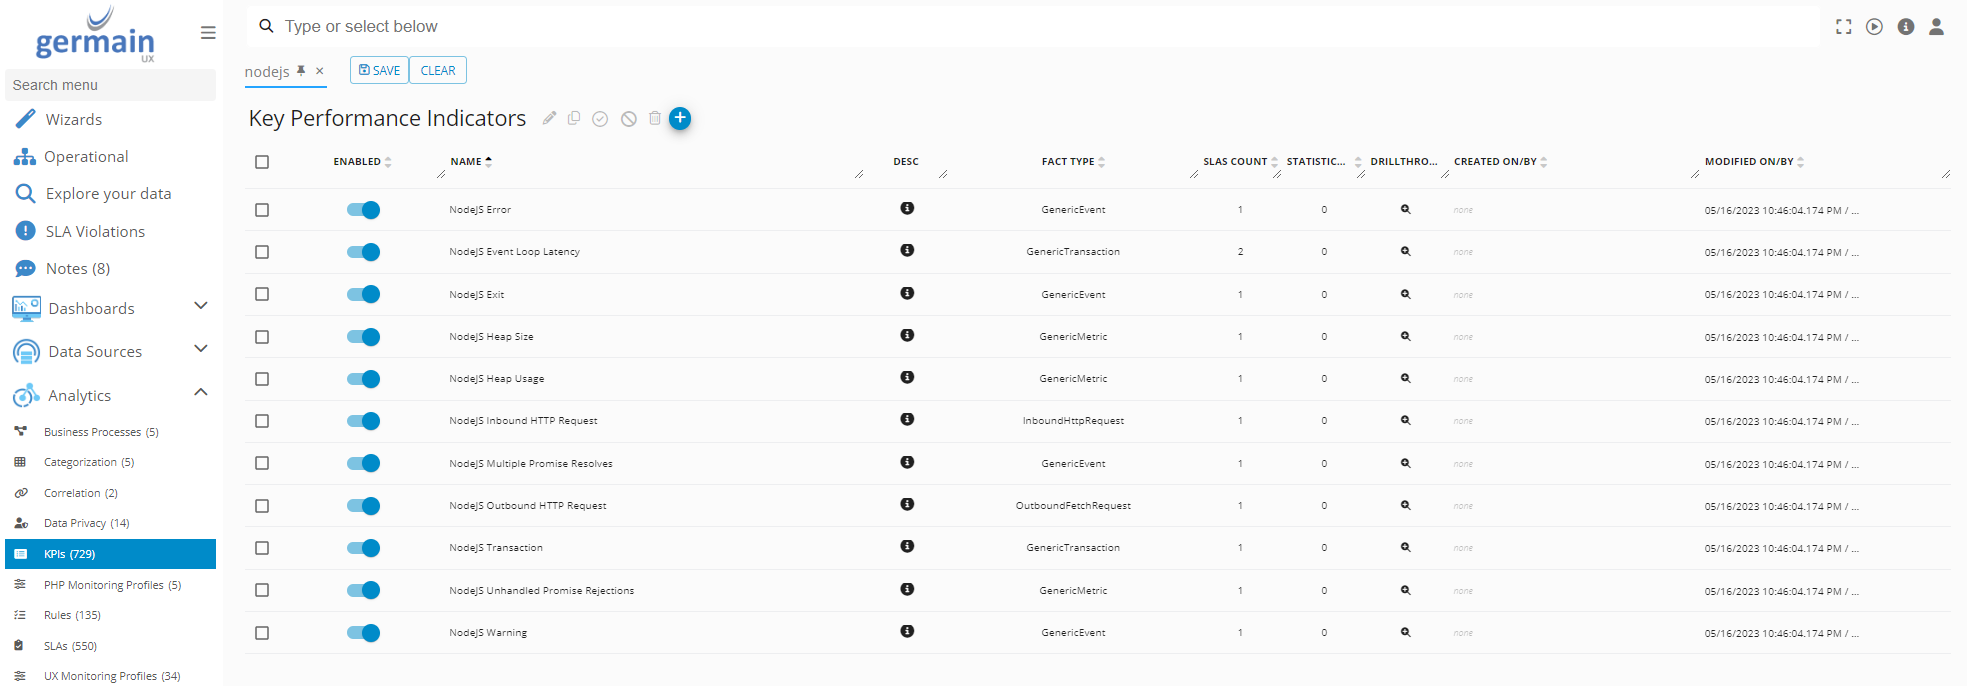
GermainUX provides preconfigured Node.js KPIs and supports custom KPIs.
Examples include:
-
NodeJS Unhandled Promise Rejections
-
NodeJS Warning
-
HTTP response time
-
Transaction duration
-
Event-loop latency
-
CPU usage
-
Memory usage
-
Heap usage
-
Application exits
Enable the KPIs relevant to the application and create custom KPIs where required.
📏 Configure SLAs
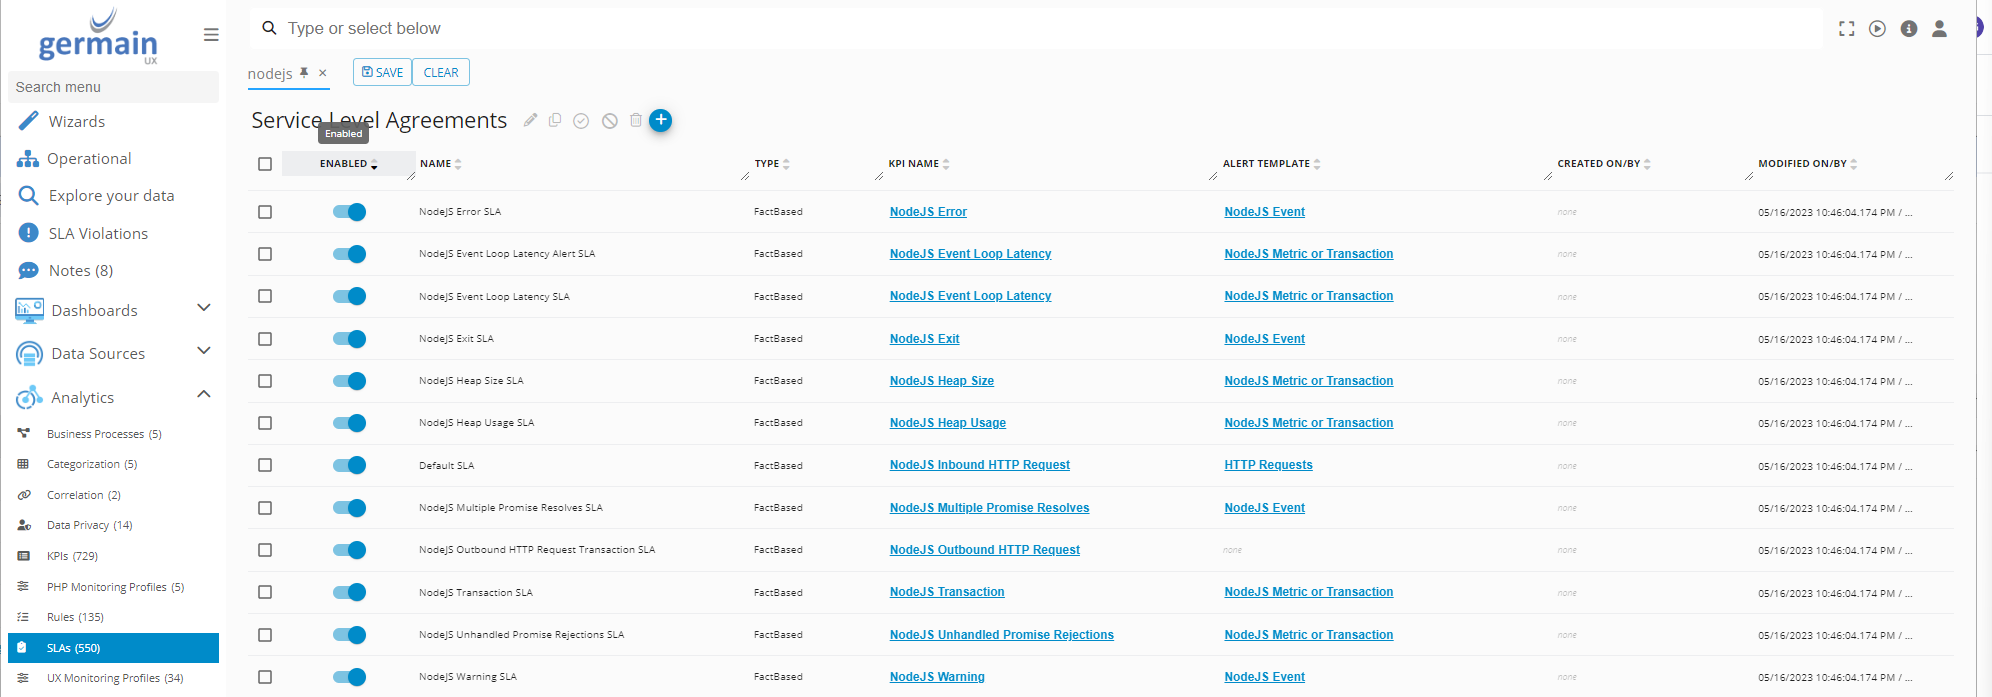
Define SLAs for Node.js KPIs requiring threshold-based monitoring.
For example:
HTTP Response Time > Threshold
Event Loop Latency > Threshold
Unhandled Promise Rejections > 0
CPU Usage > Threshold
Transaction Duration > Threshold
SLAs should reflect expected application behavior rather than using the same thresholds for every Node.js service.
🗂️ Configure Categorization
Configure categorization rules to group Node.js telemetry into meaningful operational categories.
Categorization can be used for:
-
Errors
-
Warnings
-
Transactions
-
Application components
-
Services
-
Failure types
This helps consolidate similar events and simplify dashboards, reports, and alerts.
🔗 Configure Correlation
In addition to built-in asynchronous HTTP correlation, configure GermainUX correlation where Node.js telemetry should be associated with other monitored technologies.
Examples:
Browser → Node.js → API
MarkoJS → Node.js → MySQL
Node.js → MuleSoft → Downstream Service
Correlation allows teams to move across application layers during troubleshooting.
🔐 Configure Analytics Data Privacy
In addition to the Node.js collector-side exclusion rules, configure GermainUX privacy controls where collected telemetry needs additional handling within analytics.
Privacy policies should remain consistent across Node.js and any correlated frontend, API, or database monitoring.
🔔 Configure Alerts
Create alerts for Node.js conditions requiring operational attention.
Examples include:
-
Unhandled exception
-
Unhandled Promise rejection
-
Node.js warning
-
Unexpected process exit
-
Slow HTTP request
-
Slow transaction
-
High event-loop latency
-
CPU or memory threshold exceeded
Configure appropriate:
-
Conditions
-
Thresholds
-
Time windows
-
Recipients
-
Escalation behavior
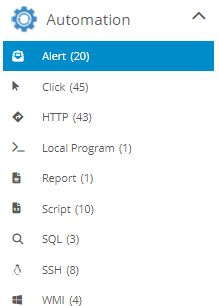
⚙️ Configure Automation
Node.js conditions can trigger GermainUX automation.
For example:
Node.js Condition → KPI → SLA → Alert / Action
Automation can include:
-
Notifications
-
Reports
-
Scripts
-
HTTP actions
-
Incident workflows
-
Other configured operational actions
-
Remediation actions where appropriate
📊 Configure Dashboards
Use an existing Node.js dashboard or create a custom dashboard.
Dashboards can present:
-
Application health
-
Errors and warnings
-
HTTP performance
-
Transaction performance
-
Event-loop latency
-
Promise-related problems
-
CPU and memory
-
Heap utilization
-
OS resources
-
Disk utilization
-
SLA status
Combine Node.js telemetry with frontend, API, database, and infrastructure data where useful.
📄 Configure Automated Reports
Enable an existing report or create a Node.js-specific automated report.
Reports can summarize:
-
Availability
-
Errors
-
Application performance
-
Transaction performance
-
Resource utilization
-
SLA violations
-
Trends over time
Configure the appropriate schedule and recipients for each operational or management audience.
🧪 Validate the Configuration
After changing Node.js configuration, execute representative application activity and verify:
-
Application and data source association
-
Incoming HTTP monitoring
-
Outgoing HTTP monitoring
-
Async correlation
-
Unhandled exceptions
-
Node.js warnings
-
Promise rejections
-
Event-loop latency
-
Startup and exit events
-
Custom transactions
-
Process CPU and memory
-
Heap telemetry
-
OS resources
-
Disk usage
-
Privacy and exclusion rules
-
KPIs
-
SLA evaluation
-
Categorization
-
Correlation
-
Alerts and automation
-
Dashboards and reports
Also verify that monitoring introduces acceptable overhead for the application.
ℹ️ Advanced Configuration
GermainAPMConfiguration exposes additional controls for Node.js monitoring.
The main configuration areas include:
-
servicesUrl -
monitoring -
logging -
datapoints -
defaults -
exclusions
The monitoring configuration includes controls for:
-
Monitoring frequency
-
Asynchronous correlation
-
Unhandled exceptions
-
Incoming HTTP
-
Outgoing HTTP
-
Startup
-
Process resources
-
OS resources
-
Disk
-
Node.js warnings
-
Unhandled Promise rejections
-
Event-loop latency
-
Process exit
-
Multiple Promise resolutions
Use the default automatic configuration where possible and customize only the capabilities required by the application.
type GermainAPMConfiguration = {
    /** Germain UX environment URL (e.g. http://localhost:8080). */
    servicesUrl: string;
    /** Config to enable/disable/customize what is monitored */
    monitoring: {
        /** How often periodic monitoring should be collected. Default: 60 */
        frequencySeconds: number;
        /** Whether to enable correlation of data across async callbacks. Default: true */
        asyncCorrelation: boolean;
        /** Unhandled Exception monitoring */
        unhandledExceptions: {
            /** Enable monitoring. Default: true */
            enabled: boolean;
            /** Whether to exit the Node process on error. Default: true */
            exitOnError: boolean;
            /** Callback to be fired when an error occurs. */
            callbackOnError?: (error: Error) => void;
        },
        /** Incoming HTTP monitoring */
        httpIncoming: {
            /** Enable monitoring. Default: true */
            enabled: boolean;
            /** Function to extract a sessionId from an incoming request */
            sessionExtractor?: (request: IncomingMessage) => string;
        },
        /** Outgoing HTTP monitoring */
        httpOutgoing: {
            /** Enable monitoring. Default: true */
            enabled: boolean;
            /** Function to extract a sessionId from an incoming request */
            sessionExtractor?: (response: ClientRequest) => string;
        },
        /** Node Startup time monitoring. Default: true */
        startup: true,
        /** Node Process monitoring. Default: true */
        pid: boolean;
        /** OS monitoring (CPU, Memory). Default: true */
        os: boolean;
        /** Disk monitoring. Default: true */
        disk: boolean;
        /** Node Warning monitoring. Default: true */
        warning: boolean;
        /** Unhandled Promise Rejection count monitoring. Default: true */
        unhandledPromiseRejection: boolean;
        /** Event Loop Latency monitoring. Default: true */
        eventLoopLatency: boolean;
        /** Exit monitoring - when Node shuts down. Default: true */
        exit: boolean;
        /** Multiple Promise Resolve monitoring. Default: true */
        multiplePromiseResolves: boolean;
    },
    /** Logging configuration */
    logging: {
        /** Level of logging to enable. Default: 'info' */
        level: 'error' | 'warn' | 'info' | 'verbose' | 'debug',
        /** Filename to log to. Default: 'GermainAPM.log' */
        filename: string;
        /** Max number of rolling files to keep. Default: 10 */
        maxFiles: number;
        /** Max size of a single rolling log file. Default: 10Mb */
        maxSize: number;
    },
    /** Data sending settings */
    datapoints: {
        /** Whether to send data to the server or just discard. This is a debug setting as should always be set true. Default: true */
        sendData: boolean;
        /** Whether outgoing data should be compressed to reduce network overhead. Default: true */
        compress: boolean;
        /** Max number of datapoints to keep in-memory before sending to the server. Default: 250 */
        maxNumInMemory: number;
        /** Max time to wait between sending data to server. Default: 60 */
        maxFlushTimeSeconds: number;
    },
    /** Default data to be added to datapoints */
    defaults: {
        /** Default user */
        user?: UserDimension;
        /** Default system */
        system?: SystemDimension;
        /** Default application */
        application?: ApplicationDimension;
        /** Default pid */
        pid?: string;
    }
    /** Exclusions to be applied to collected datapoints */
    exclusions: FieldExclusionConfig[]
}
ℹ️ Get More Information
Magento environments can vary significantly depending on storefront customization, extensions, integrations, infrastructure, and security requirements.
The GermainUX team can help configure the appropriate monitoring scope, privacy controls, analytics, alerts, and automation for your Magento environment.
Please contact us for any help.
Component: Engine, JS Profiler, RPA Bot Recorder, RUM JS
Feature Availability: 2017.1 or later