2 ways to edit a Template
-
Germain Workspace > Left Menu > Analytics> SLA > Select a SLA > Edit Template link.
-
Germain Workspace > Left Menu > System> Templates.
SLA-driven Template Editing
-
Germain Workspace > Left Menu > Automation > Report
-
Select View
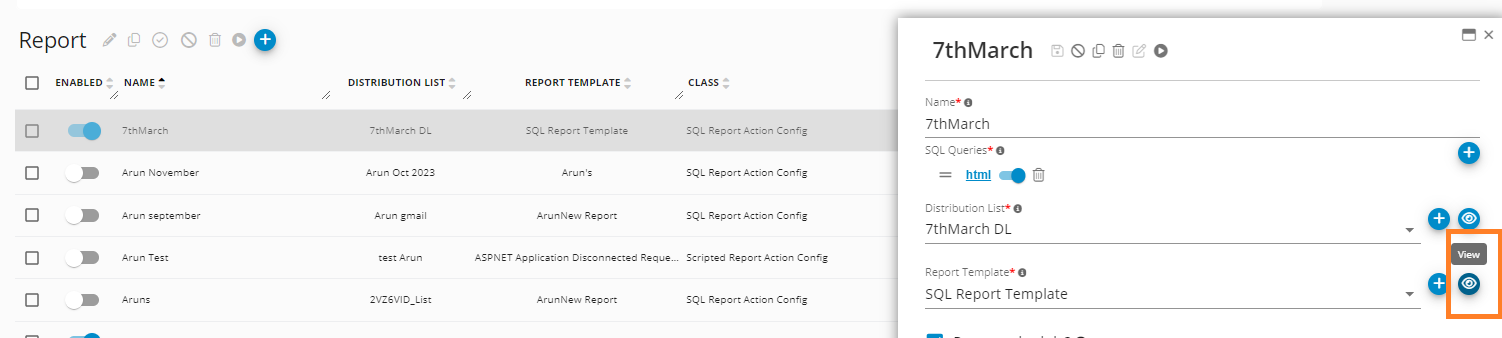
View Report - Germain UX
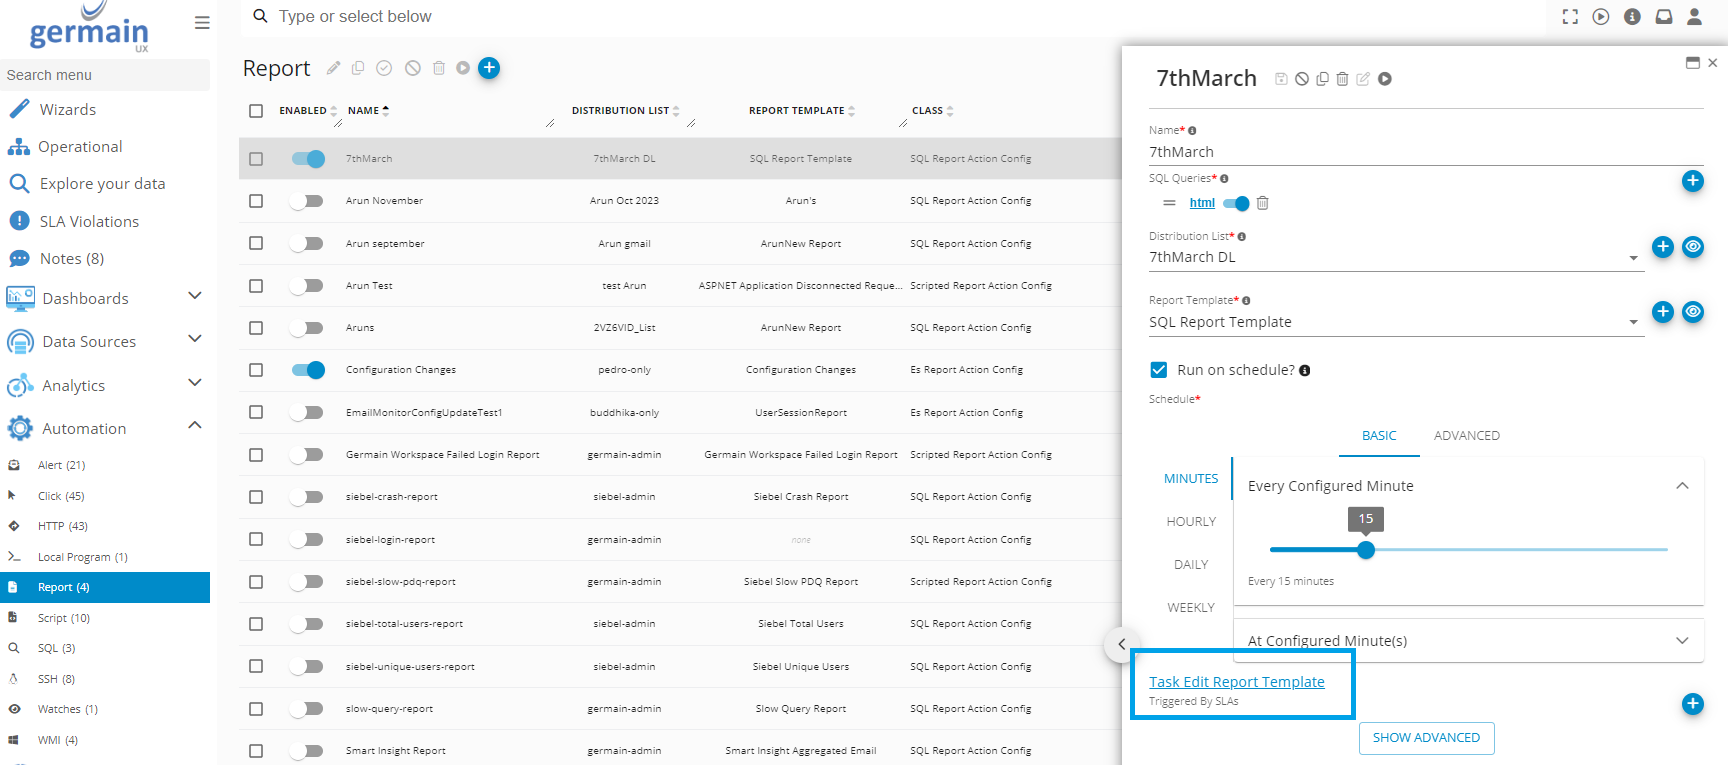
SQL-driven Template Editing
To edit a template that is SQL-driven
-
Germain Workspace > Left Menu > Automation > Report
-
Select Edit Template
-
Follow other steps (…)
-
Click View Template and edit it.
Charts and Graphs
In addition to tabular displays, reports can also utilize charts and graphs to visualize data.
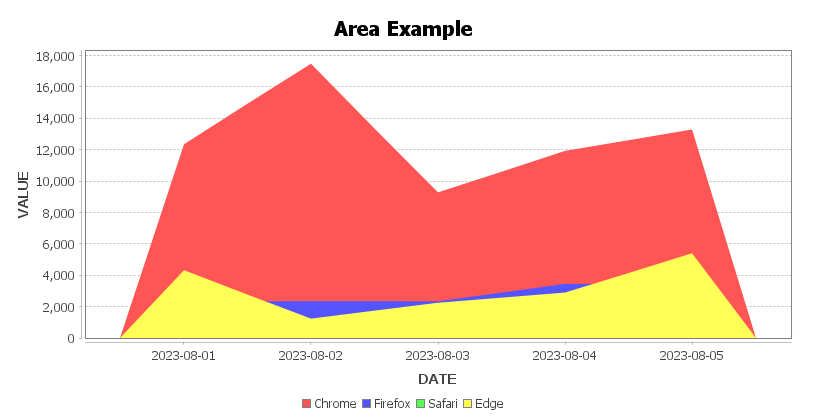
Area Chart
Given the following sample data set against which the report is configured to run:
|
|
8/1/2023 |
8/2/2023 |
8/3/2023 |
8/4/2023 |
8/5/2023 |
|
area1 |
4000 |
1700 |
2000 |
3500 |
5500 |
|
area2 |
2000 |
2000 |
2000 |
3000 |
3000 |
|
area3 |
12000 |
17000 |
9000 |
12000 |
13000 |
To render the result as an area chart, use the following expression inside the report template:
<!DOCTYPE html>
<head>
    <title>My Report</title>
</head>
<body>

${charts.area("Area Example", context.at(0), "DATE", "VALUE", "NAME").inline(800, 400)}

</body>
</html>
The resulting area chart using the “DATE” and “VALUE” fields on the horizontal and vertical axes, as well as the “NAME” field to differentiate between the different series to display:
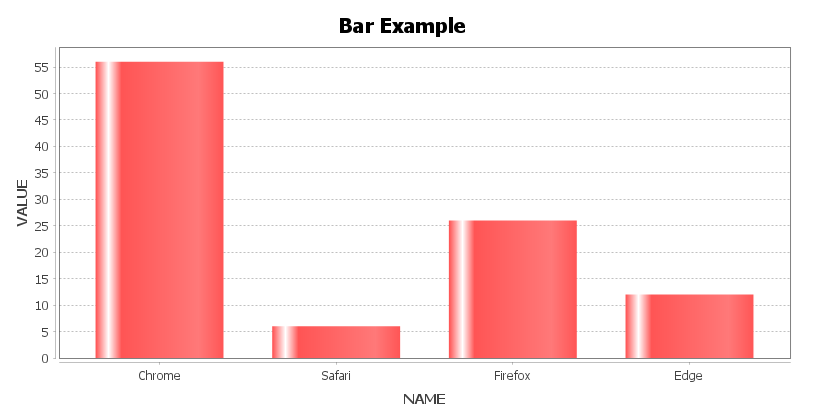
Bar Chart
Using this data set:
|
NAME |
Chrome |
Safari |
FireFox |
Edge |
|
VALUE |
55 |
5 |
25 |
12 |
The following expression inside the template can be used to render a bar chart:
<!DOCTYPE html>
<head>
    <title>My Report</title>
</head>
<body>

${charts.bar("Bar Example", context.at(0), "NAME", "VALUE").inline(800, 400)}

</body>
</html>
The resulting graph used the “NAME” and “VALUE” columns and renders at 800 by 400 pixels:
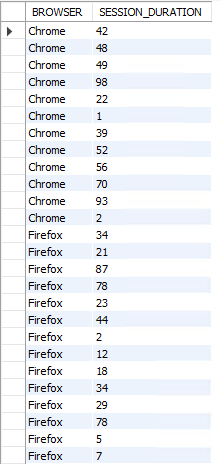
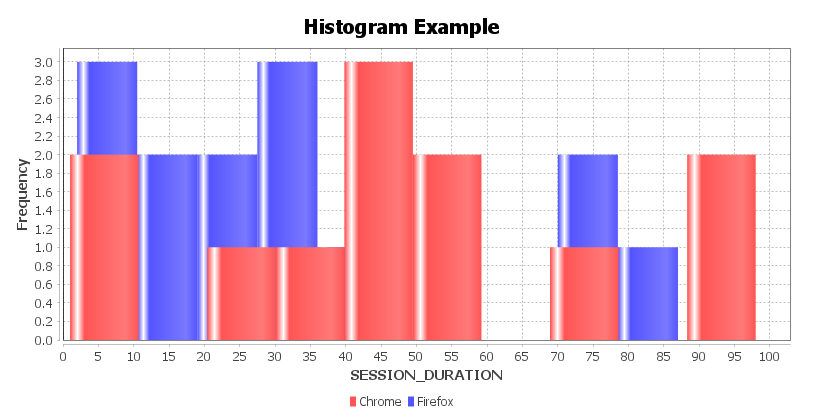
Histogram
The following expression renders the result as a histogram using a bucket size of 10:
<!DOCTYPE html>
<head>
    <title>My Report</title>
</head>
<body>

${charts.histogram("Histogram Example", context.at(0), 10, "SESSION_DURATION", "BROWSER").inline(800, 400)}

</body>
</html>
Pie Chart
Given a report that queries the following sample data set:
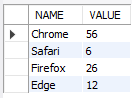
To render the result as a pie chart, use the following expression inside the report template:
<!DOCTYPE html>
<head>
<title>My Report</title>
</head>
<body>
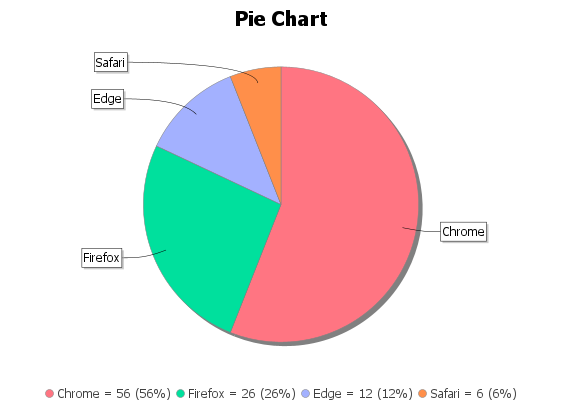
${charts.pie("Pie Chart", context.at(0), "NAME", "VALUE").inline(800, 400)}
</body>
</html>
This directs the report to render the a pie chart using the “NAME” and “VALUE” columns. The chart will be included as an inline attachment with a resolution of 800 by 400 pixels:
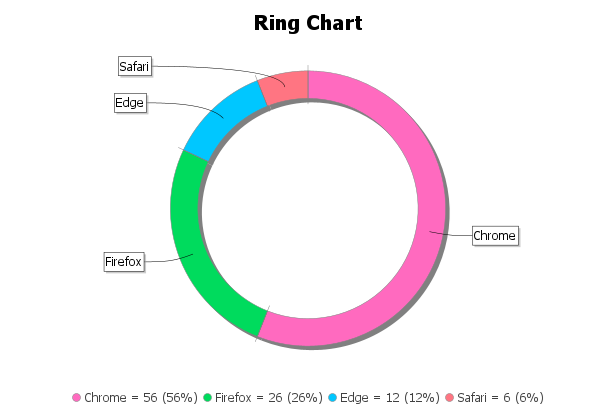
Ring Chart
Using the same example data set as for the pie chart above, the following expression inside the template can be used to render a ring chart:
<!DOCTYPE html>
<head>
    <title>My Report</title>
</head>
<body>

${charts.ring("Ring Chart", context.at(0), "NAME", "VALUE").inline(800, 400)}

</body>
</html>
The resulting graph used the “NAME” and “VALUE” columns and renders at 800 by 400 pixels:
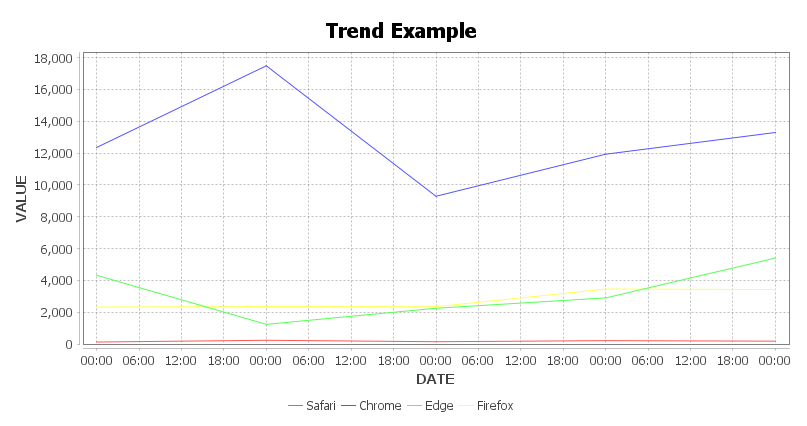
Trend Chart
Using the same data set as for the area chart example above, the following creates a trend chart inside the report template:
<!DOCTYPE html>
<head>
    <title>My Report</title>
</head>
<body>

${charts.trend("Trend Example", context.at(0), "day", "DATE", "VALUE", "NAME").inline(800, 400)}

</body>
</html>
Notice that this will fill in any gaps in the timeline:
Link/URL
You can easily add links/URLs to automatically point users to Germain UX workspace to quickly be able to manage insights.
To do so, use the ${links} shortcut variable available our template editor.
-
Example: Linking to a Dashboard with a predefined time range
<a href="${links.predefinedTimeRange("Last 7 days", "AUTO").dashboard("My Dashboard")}">
  Click here
</a>
-
Example: Linking to a Drillthrough for a specific KPI and time range
<a href="${links.timeRange("2024-03-09T00:00:00Z", "2024-03-10T00:00:00Z").drillthrough("CPU Usage")}">
  Click here
</a>
-
Example: Linking to an RCA screen for a specific data point
<a href="${links.rca("CPU Usage", "65ef2a134e72ab2d1c000060")}">
  Click here
</a>
Note: You need to follow the order that you see when you go to the drillthrough, i.e.,
#PredefinedTimeRange(Today,AUTO)/Filter(Color,%3D%3D,RED,%7B%7D)/Drillthrough(User%20Click)
.predefinedTimeRange(...)
.filter(...)
.drillthrough(...)
Tables
Germain UX provides utility functions to quickly generate tables based on report results.
Examples
-
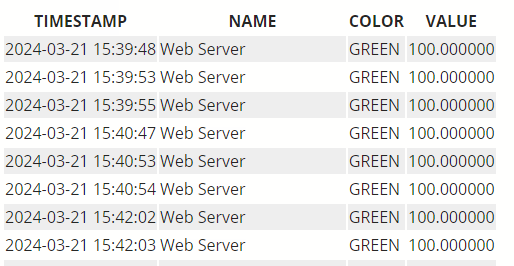
Simple table - each column title matches value in the report result set:
${
    tables.result(context.at(0))
        .columns("TIMESTAMP", "NAME", "COLOR", "VALUE")
}
-
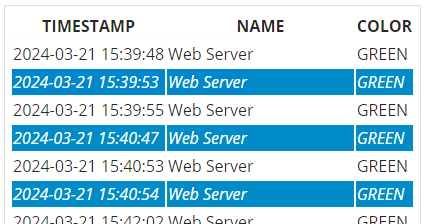
Customize style attributes
${
    tables.result(context.at(0))
        .tableStyle("padding: 5px; border: 1px solid #ddd;")
        .oddRowStyle("background-color: rgb(0, 139, 201); color: #fff; font-style: italic;")
        .evenRowStyle("background-color: #fff; font-style: bold;")
        .columns("TIMESTAMP", "NAME", "COLOR")
}
-
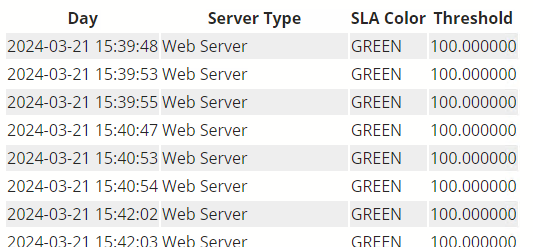
Custom column labels - each column specifies the name of the value in the result set and a custom table header:
${
    tables.result(context.at(0))
        .textColumn("TIMESTAMP", "Day")
        .textColumn("NAME", "Server Type")
        .textColumn("COLOR", "SLA Color")
        .textColumn("VALUE", "Threshold")
}
-
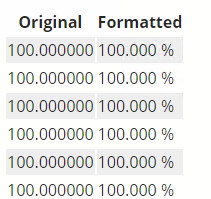
Formatting for numbers - in this case, limit to fractional part to 3 digits and append percent-sign:
${
    tables.result(context.at(0))
        .textColumn("VALUE", "Original")
        .numberColumn("VALUE", "Formatted", "%.3f %%")
}
-
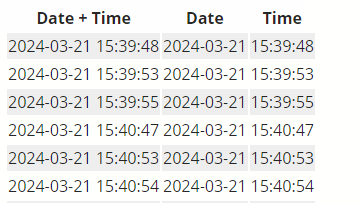
Formatting for date / time values
${
    tables.result(context.at(0))
        .dateTimeColumn("TIMESTAMP", "Date + Time")
        .dateColumn("TIMESTAMP", "Date")
        .timeColumn("TIMESTAMP", "Time")
}
-
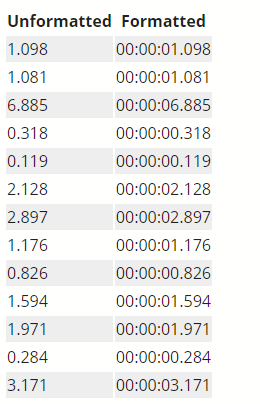
Formatting for duration values
${
    tables.result(context.at(0))
        .textColumn("duration", "Unformatted")
        .durationColumn("duration", "Formatted")
}
-
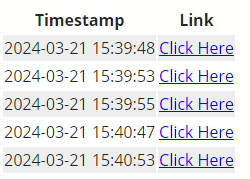
Drillthrough link column with custom time range:
${
    tables.result(context.at(0))
        .dateTimeColumn("TIMESTAMP", "Timestamp")
        .linkColumn(tables
            .link(links.drillthrough("My KPI"))
            .timeRange("TIMESTAMP", 0, 60000),
        "Link")
}
-
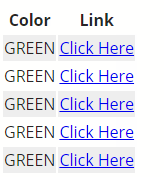
Drillthrough link column with custom filter:
${
    tables.result(context.at(0))
        .textColumn("COLOR", "Color")
        .linkColumn(tables
            .link(links.predefinedTimeRange("Last 7 days", "AUTO").drillthrough("My KPI"))
            .filter("color", "==", "COLOR"),
        "Link")
}
CTA/Call-to-action
A call-to-action (CTA) in a Germain Alert, such as SQL execution, script execution, SSH command execution, or local program execution, can be performed by clicking on a link. An unlimited number of links can be added to an alert, which can be customized, allowing you to create your own alerts.
Use cases
-
Start/Stop/Restart an Application/Service/Server/Database
-
Send data to a ticket system to create a ticket
-
Enter data into a DB
-
Generate a report (More details on report).
Arguments
Here 4 arguments to configure in order to setup a CTA:
-
Required:
|
id |
This is the name of the action you want to run |
-
Optional: All are strings, but will be separate variables for the Action to consume.
|
server |
A string variable to store the server's identity or hostname
|
|
database |
A string variable to store the way to identity or connect to the DB
|
|
application |
A string variable to store identifying information about an application or service
|
-
Action Link example:
|
Example of a Service Restart Action Link |
|
|
HTML
|
|
|
Variable Name |
Description |
|
${workspaceUrl} |
is an automatic variable with the URL of your Germain Server. No Need to change it. |
|
This is the name of the service. |
|
|
${context.fact.system.hostname!} |
The is the hostname |
In this case it would execute the Action “restartservice” (“id”) and pass in two arguments (“server” and “app”).
The <#if> is there to protect against unexpectedly missing data. If any of the following were missing, it would not try to create a link. By not trying to create a link with missing data, it avoids errors that could prevent the alert from being sent out:
-
context.fact
-
context.fact.system
-
context.fact.system.hostname
Context Data
The context data consists of the following root data objects.
-
customerName (String)
-
environmentName (String)
-
alertType (String)
-
alertGroup (String)
-
context (Object)
-
firstOccurred (Date)
-
occurrences (Integer)
The details of each of these data objects are provided in the following paragraphs. The 'context' differs from all other context data objects in that its structure and contents depend on the 'alertType.' Each 'alertType' can have its own context data types, but for a given 'alertType,' the context data will always maintain the same structure. In the subsequent paragraphs, we will define the contents of the context data object for each of the current 'alertTypes.'
-
alertType: SLA
For SLA alerts, the context objects have the following structure:
-
fact (Object)
Can be one of the following types (See the Fact Type Definitions)
Note: For statistical SLA alerts the fact object is not available.
-
AVAILABILITY (Object)
-
EVENT (Object)
-
METRIC (Object)
-
NETWORK_LATENCY (Object)
-
TRANSACTION (Object)
-
UX_EVENT (Object)
-
UX_METRIC (Object)
-
UX_TRANSACTION (Object)
Fact Definitions
More details on Germain UX’s Data Model and Fact.