
☁️ Amazon EC2 Observability
👀 Overview
GermainUX monitors the availability, performance, and capacity of Amazon EC2 instances and their attached EBS volumes.
Telemetry can be collected from:
|
Source |
|---|
|
Amazon CloudWatch |
|
EC2 status checks |
|
EBS volume metrics |
|
Operating-system commands and metrics |
|
Processes and services |
|
Application and system logs |
|
Application endpoints |
|
Synthetic transactions |
This provides a combined view of AWS infrastructure, operating-system health, application availability, and user or business impact.
🏗️ Monitoring Architecture
The GermainUX Engine connects to configured AWS services and monitored resources. Depending on the required visibility, it can:
|
Action |
|---|
|
Retrieve EC2 and EBS metrics exposed through CloudWatch. |
|
Monitor Linux hosts through SSH. |
|
Monitor Windows hosts through approved Windows management interfaces. |
|
Read accessible application and system logs. |
|
Test application endpoints and business transactions. |
|
Execute approved diagnostic or corrective actions. |
The Engine requires network access to GermainUX, the appropriate AWS endpoints, and any EC2 resources monitored directly.
📋 Prerequisites
Before configuring EC2 monitoring:
-
Deploy and register a GermainUX Engine.
-
Identify the AWS accounts, regions, instances, and volumes to monitor.
-
Create an AWS identity with the minimum required read permissions.
-
Configure approved credentials in GermainUX.
-
Confirm that the Engine can reach the required AWS endpoints.
-
Install and configure the CloudWatch Agent if guest operating-system metrics are required through CloudWatch.
-
Configure SSH or Windows access if direct operating-system monitoring is required.
-
Synchronize clocks across the monitored systems.
Do not use an AWS account root user or broadly privileged identity for monitoring.
💽 EC2 Instance Monitoring
GermainUX can collect available CloudWatch metrics such as:
|
Measurement |
Description |
|---|---|
|
CPU utilization |
Percentage of allocated compute capacity in use |
|
Network input and output |
Bytes received and transmitted |
|
Network packets |
Packets received and transmitted |
|
Disk read and write operations |
Instance-store disk operations, where available |
|
Disk read and write bytes |
Instance-store data transfer, where available |
|
Instance status check |
Combined instance health |
|
System status check |
Health of the AWS infrastructure supporting the instance |
|
Attached EBS status check |
Reachability of attached EBS volumes, when available |
|
CPU credit balance |
Remaining CPU credits for burstable instances |
|
CPU credit usage |
CPU credits consumed |
|
CPU surplus credits |
Surplus credit activity for applicable unlimited-mode instances |
Metrics depend on the instance type, operating system, AWS configuration, and CloudWatch data available for the resource.
Standard EC2 CloudWatch metrics do not include guest memory or filesystem utilization. Collect those measurements using the CloudWatch Agent or direct operating-system monitoring.
🗄️ EBS Volume Monitoring
GermainUX can monitor available EBS metrics including:
|
Metric |
|---|
|
Read and write operations |
|
Read and write bytes |
|
Operation latency |
|
Queue length |
|
Idle time |
|
Throughput utilization |
|
IOPS utilization |
|
Burst balance |
|
Volume status checks |
🔋 EBS Burst Balance
EBS Burst Balance indicates the percentage of burst credits remaining for volume types that use a burst-credit model.
A sustained decline can indicate that the volume is consuming burst capacity faster than it recovers. When the balance is depleted, storage performance may be limited to the volume’s baseline capability.
Configure alerts before the balance reaches a critical level and correlate it with:
|
Correlate With |
|---|
|
IOPS |
|
Throughput |
|
Queue length |
|
Latency |
|
Application response time |
|
Database performance |
|
Business-transaction duration |
Burst Balance is not applicable to every EBS volume type. For example, gp3 volumes use provisioned performance rather than the gp2 burst-credit model.
🖥️ Operating-System Monitoring
For Linux or Windows running on EC2, GermainUX can monitor available guest-level measurements such as:
|
Measurement |
|---|
|
CPU and load |
|
Physical and virtual memory |
|
Swap or paging |
|
Filesystem utilization |
|
Disk activity |
|
Network interfaces |
|
Process availability |
|
Process CPU and memory |
|
Service state |
|
System uptime |
|
System and application logs |
Direct operating-system monitoring requires appropriate connectivity and a dedicated least-privilege account.
⚙️ Process and Service Monitoring
Configure GermainUX to monitor processes and services required by the application, including:
|
Process / Service |
|---|
|
Web and application servers |
|
Databases |
|
Integration services |
|
Message brokers |
|
Background workers |
|
Scheduled services |
|
Custom application processes |
Alerts can identify stopped processes, unexpected process counts, excessive resource consumption, or repeated restarts.
🔗 Application and Endpoint Monitoring
Infrastructure availability does not guarantee that the hosted application is usable. GermainUX can also monitor:
|
What |
|---|
|
HTTP and HTTPS endpoint availability |
|
Response time |
|
Status codes |
|
API transactions |
|
Authentication flows |
|
Database queries |
|
Application logs |
|
Browser user experience |
|
Business processes |
|
Synthetic user scenarios |
Correlating EC2 and EBS telemetry with application performance helps determine whether infrastructure conditions are affecting users or business transactions.
📄 Log Monitoring
The GermainUX Engine can monitor accessible logs for:
|
Log Type |
|---|
|
Application errors |
|
Service startup and shutdown |
|
Authentication failures |
|
Resource warnings |
|
Disk and filesystem problems |
|
Network errors |
|
Database failures |
|
Out-of-memory conditions |
|
Deployment events |
Logs can be read from accessible files or integrated sources. Configure parsing, categorization, privacy, and retention rules for each format.
Do not collect credentials, tokens, personal information, or other unnecessary sensitive data from logs.
🔧 Configure EC2 Monitoring
-
Go to Workspace > Settings > Wizards.
-
Select the Amazon EC2 or AWS monitoring configuration.
-
Select the GermainUX Engine.
-
Configure the approved AWS credentials.
-
Select the AWS account and region.
-
Select the instances and EBS volumes to monitor.
-
Choose the required metrics and collection frequency.
-
Add operating-system, process, log, or endpoint monitoring where required.
-
Configure KPIs, SLAs, alerts, and dashboards.
-
Save and enable the configuration.
-
Confirm that telemetry appears in GermainUX.
The available configuration fields may vary by GermainUX version and AWS monitoring scope.
🏷️ Resource Identification
Use consistent AWS and GermainUX attributes to identify resources, including:
|
Attribute |
|---|
|
AWS account |
|
Region |
|
Availability Zone |
|
Instance ID |
|
Instance name |
|
Instance type |
|
Volume ID |
|
Application |
|
Environment |
|
Business service |
|
Owner or support team |
AWS tags can provide operational context when available through the configured integration. Avoid relying only on hostnames, which may change when instances are replaced.
 Recommended Alerts
Configure alerts for conditions such as:
|
Condition |
|---|
|
EC2 instance unavailable |
|
Failed instance or system status check |
|
Sustained high CPU utilization |
|
Low CPU credit balance |
|
Unexpected network-traffic changes |
|
High EBS latency or queue length |
|
Low EBS Burst Balance |
|
High IOPS or throughput utilization |
|
Low filesystem capacity |
|
Memory pressure or excessive paging |
|
Required process or service stopped |
|
Application endpoint unavailable |
|
Repeated application or system errors |
|
Missing monitoring data |
Use sustained-duration and recurrence conditions to avoid alerts from brief, harmless spikes.
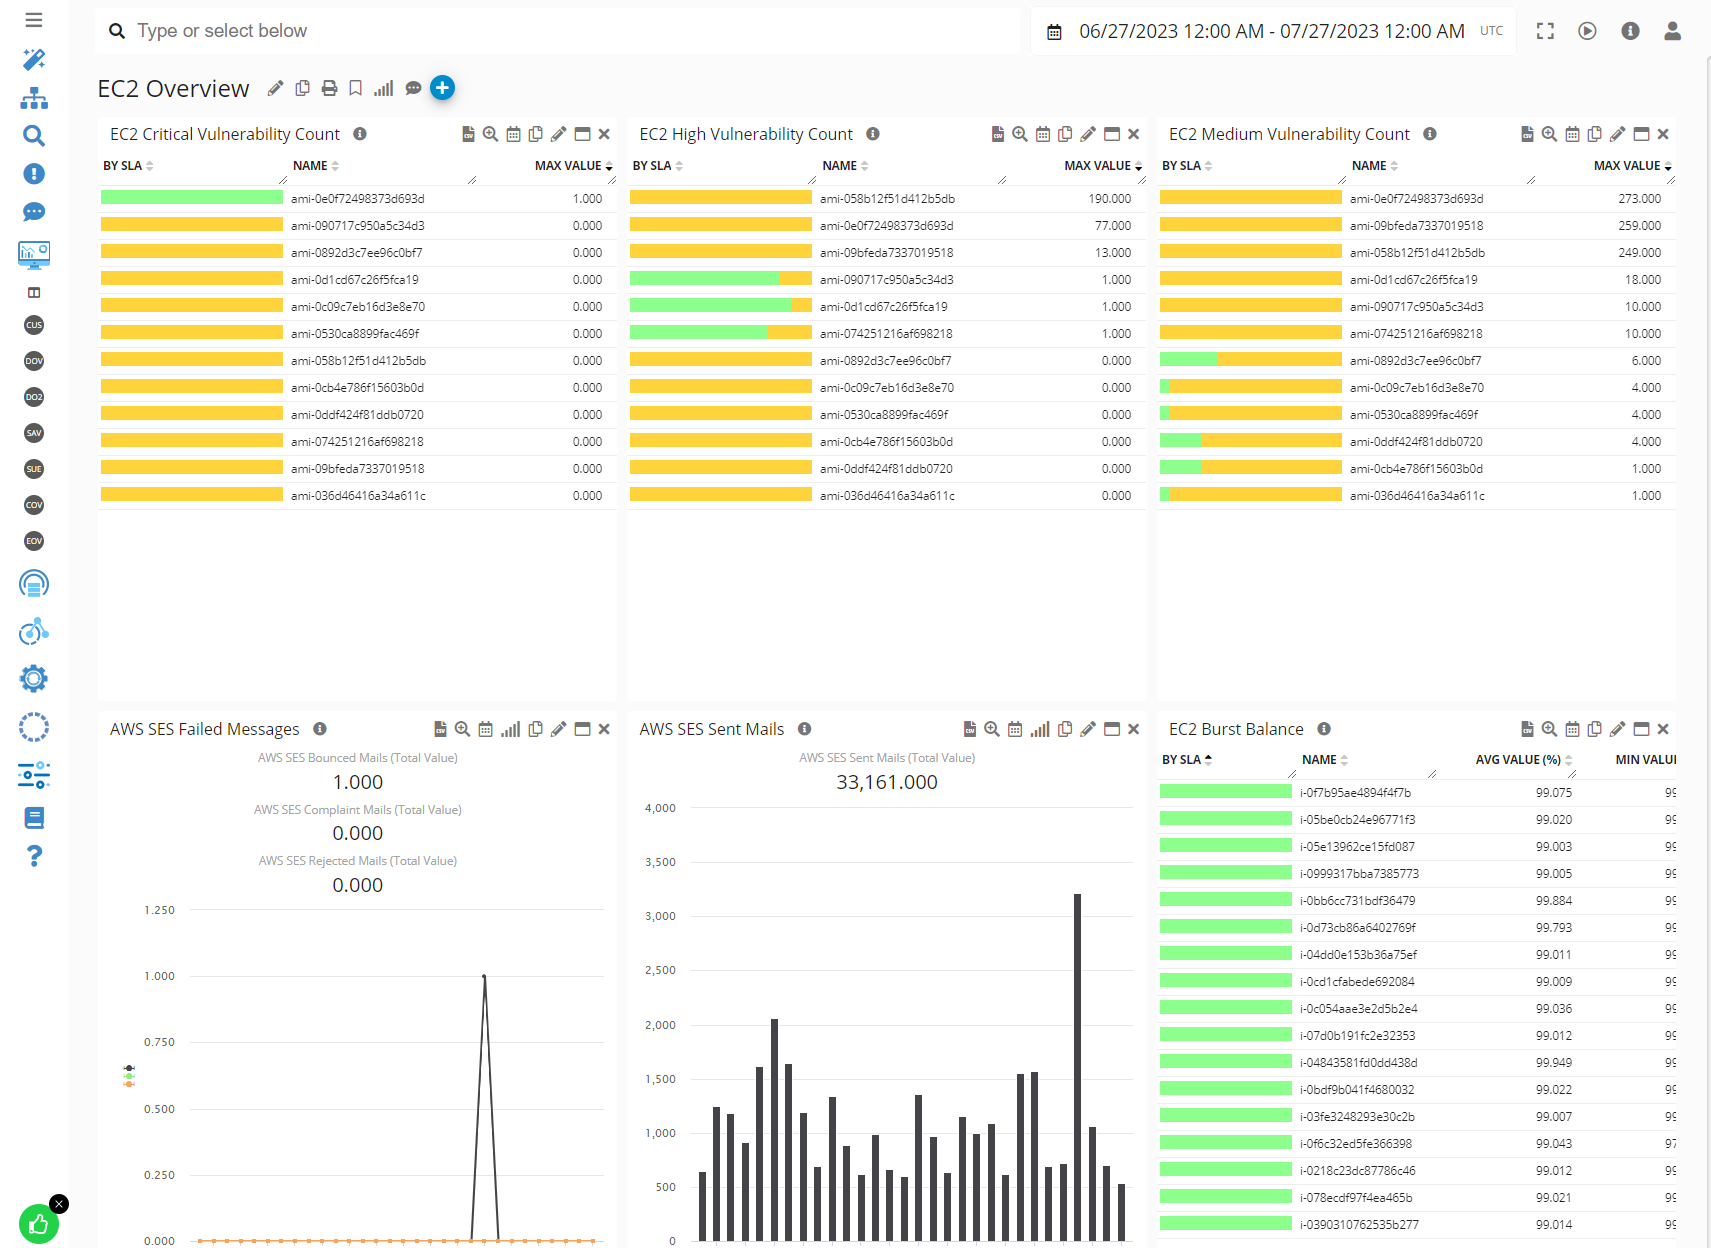
📊 Dashboards and Reports
EC2 dashboards can include:
|
Dashboard Item |
|---|
|
Instance availability |
|
Status-check failures |
|
CPU utilization |
|
CPU credit balance |
|
Network activity |
|
EBS IOPS and throughput |
|
EBS latency and queue length |
|
EBS Burst Balance |
|
Memory and filesystem utilization |
|
Process and service availability |
|
Application endpoint performance |
|
Log errors |
|
Related user or business-process impact |
Scheduled reports can summarize performance, availability, capacity, SLA violations, trends, and changes compared with the previous period.
🤖 Automation
When an issue is detected, GermainUX can initiate approved actions through the Engine, including:
|
Action |
|---|
|
Sending an alert |
|
Creating or updating a ticket |
|
Calling a webhook or HTTP endpoint |
|
Running an authorized diagnostic script |
|
Collecting additional evidence |
|
Restarting an approved service |
|
Validating recovery |
Actions that stop or start EC2 instances, detach volumes, modify infrastructure, or affect production services must be explicitly authorized and protected by appropriate safeguards.
🔒 Security
Apply the following controls:
|
Control |
|---|
|
Use a dedicated AWS identity. |
|
Grant only the required read permissions. |
|
Prefer temporary credentials or assigned roles where supported. |
|
Protect and rotate stored credentials. |
|
Restrict direct host access by network policy. |
|
Use dedicated least-privilege operating-system accounts. |
|
Encrypt connections. |
|
Audit automated actions. |
|
Avoid collecting unnecessary sensitive data. |
✅ Validation
After enabling monitoring:
-
Confirm that the Engine can access the configured AWS account and region.
-
Verify that the expected instances and volumes are discovered.
-
Compare selected values with CloudWatch.
-
Confirm that instance and volume identifiers are correct.
-
Verify operating-system and process telemetry, when configured.
-
Test an alert condition safely.
-
Confirm that alerts reach the appropriate recipients.
-
Verify that dashboards show the expected application and environment context.
ℹ️ Get Help
The Germain Team can help you set this up. Contact GermainUX Support.
Component: Engine, JS Profiler, Mobile App, RPA Bot Recorder, RUM JS
Feature Availability: 2022.1 or later