
📉 Drop-Off Analysis
A drop-off occurs when a user begins or meaningfully enters a page, feature, funnel or workflow but leaves before completing the intended action.
It represents interrupted intent—whether the user intended to purchase, register, explore content, complete a business process or use an application feature.
GermainUX automatically detects and analyzes drop-offs to help teams understand where users abandon, who is most affected, why abandonment occurs and what business outcome is lost.
💼 Business Outcomes
GermainUX Drop-Off Analysis helps organizations:
-
Identify the funnel stages, workflow steps and application features with the greatest abandonment.
-
Quantify conversion loss, poor adoption, disengagement and incomplete work.
-
Distinguish segments contributing the most drop-offs from segments with the highest individual risk.
-
Correlate abandonment with behavior, errors, performance, content and process friction.
-
Replay the sessions that contributed to a drop-off.
-
Prioritize improvements according to affected users and business impact.
-
Detect abnormal changes in drop-off behavior and alert the appropriate teams.
-
Validate whether UX, process or technology changes improve completion.
|
Outcome |
Description |
|---|---|
|
Identify Abandonment |
Locate funnel stages, workflow steps, and features with high abandonment. |
|
Quantify Impact |
Measure conversion loss, poor adoption, and incomplete work. |
|
Segment Analysis |
Distinguish between high-volume contributors and high-risk segments. |
|
Root Cause Correlation |
Link abandonment to behavior, errors, performance, and friction. |
|
Session Insights |
Replay sessions to see exactly what happened during a drop-off. |
|
Prioritize Improvements |
Rank fixes based on user impact and business value. |
|
Proactive Monitoring |
Detect anomalies and alert teams to behavioral changes. |
|
Validate Changes |
Confirm if UX or technical updates successfully improve completion. |
🎯 Define the Intended Outcome First
Not every page exit or unfinished session is a drop-off. A user may have completed the intended task, found the required information or chosen to continue through another channel.
Reliable drop-off analysis requires a defined or credibly inferred journey, including:
-
The entry or intent signal
-
The expected milestones
-
The successful completion event
-
The conditions that indicate abandonment
-
The time window within which completion is expected
-
Any alternative paths that should still count as success
For example, leaving a checkout before payment is a conversion drop-off. Leaving a confirmation page after payment is not.
🗂️ Types of Drop-Offs
|
Type |
Typical users |
Definition |
Example |
Primary insight |
|---|---|---|---|---|
|
Conversion Drop-Off |
Visitors and customers |
Abandon a revenue-related or acquisition goal |
Leaves checkout before payment |
Lost conversion or revenue leakage |
|
Adoption Drop-Off |
Employees and authenticated users |
Abandon a workflow or feature before completing the task |
CRM user exits before submitting a quote |
Poor adoption, workflow or UX friction |
|
Engagement Drop-Off |
Visitors and application users |
Stop progressing into deeper content or functionality |
Opens a dashboard but never views a report |
Limited engagement depth |
|
Exploration Drop-Off |
First-time or low-intent visitors |
Leave soon after arrival without meaningful progression |
Visits a landing page and exits after one interaction |
Weak relevance, first impression or audience fit |
These categories can overlap. A checkout abandonment is both a conversion drop-off and a journey interruption; the appropriate classification depends on the analytical objective.
💰 Conversion Drop-Offs
Conversion drop-offs occur when a visitor or customer abandons an action connected to revenue, acquisition or another commercial outcome.
Examples include:
-
Product viewed but not added to cart
-
Product added to cart but checkout not started
-
Checkout started but payment not completed
-
Registration or lead form abandoned
-
Trial or application process left incomplete
-
Sales conversation ending without the intended progression
Analysis can connect the drop-off with products, campaigns, errors, performance, payment methods, devices, customer segments and estimated business impact when those measures are available.
👥 Adoption Drop-Offs
Adoption drop-offs occur when employees, customers or authenticated users begin a feature or business workflow but do not complete it.
Examples include:
-
CRM user starts but does not submit a quote
-
Employee abandons an ERP transaction
-
User repeatedly opens but does not complete a feature
-
Customer begins a self-service workflow and creates a support case instead
-
User returns to an older workflow or application after attempting a new one
These insights help determine whether the cause is training, usability, workflow complexity, application performance or a technical failure.
🔍 Engagement and Exploration Drop-Offs
Engagement and exploration analysis measures how deeply users progress into content, features or journeys.
Potential signals include:
-
Landing-page exit without a meaningful action
-
Content viewed without progressing to the next expected step
-
Dashboard opened without interacting with reports
-
Search performed without opening a result
-
Repeated navigation followed by abandonment
-
Short or inactive sessions without journey progression
These signals should be interpreted carefully. Low engagement may reflect weak relevance or poor UX, but it may also mean the user found the required information quickly.
📊 Two Essential Metrics
GermainUX uses two complementary measures to explain drop-off concentration and risk.
📈 Drop-Off Share
Formula:
Drop-Off Share = Drop-offs in Segment ÷ Total Drop-offs in Analysis Scope
Drop-Off Share answers:
How much does this segment contribute to all observed drop-offs?
Use it to identify which cohort, performance range, page, device or other segment accounts for the largest portion of abandonment.
📉 Drop-Off Rate
Formula:
Drop-Off Rate = Drop-offs in Segment ÷ Eligible Sessions in Segment
Drop-Off Rate answers:
What is the probability that an eligible session in this segment will drop off?
Use it to compare risk across segments of different sizes.
“Eligible Sessions” should include only sessions that entered the relevant journey or had a reasonable opportunity to complete the intended action.
🧪 Example
Assume the analysis contains:
-
56 eligible sessions in one segment
-
16 drop-offs in that segment
-
26 drop-offs across the complete analysis scope
The results are:
-
Drop-Off Share:
16 ÷ 26 = 61.5% -
Drop-Off Rate:
16 ÷ 56 = 28.6%
Interpretation:
-
Share of 61.5%: This segment produces most of the observed drop-offs.
-
Rate of 28.6%: Slightly more than one in four eligible sessions in this segment drops off.
A large segment may have a high share but a moderate rate. A small segment may have a low share but an exceptionally high rate. Teams need both measures to distinguish overall impact from individual risk.
🧮 Additional Metrics
Depending on the journey and configured data, analysis can also include:
-
Eligible sessions and users
-
Journey starts and completions
-
Completion and conversion rate
-
Drop-off count and trend
-
Time spent before abandonment
-
Last completed milestone
-
Repeat attempts
-
Lost productivity
-
Cart, order or revenue value
-
Error and performance conditions
-
Return or recovery after drop-off
🤖 Automated Drop-Off Detection
GermainUX can continuously monitor configured journeys and detect when eligible users fail to reach the expected completion event.
Automated analysis can:
-
Identify the stage where abandonment occurs
-
Compare the current rate with a baseline or previous period
-
Detect spikes, regressions and outliers
-
Rank affected pages, products, teams or user segments
-
Correlate drop-offs with related KPIs
-
Surface representative Session Replays
-
Generate alerts, summaries and recommendations
The detection logic can be tailored to the application, journey and business definition of success.
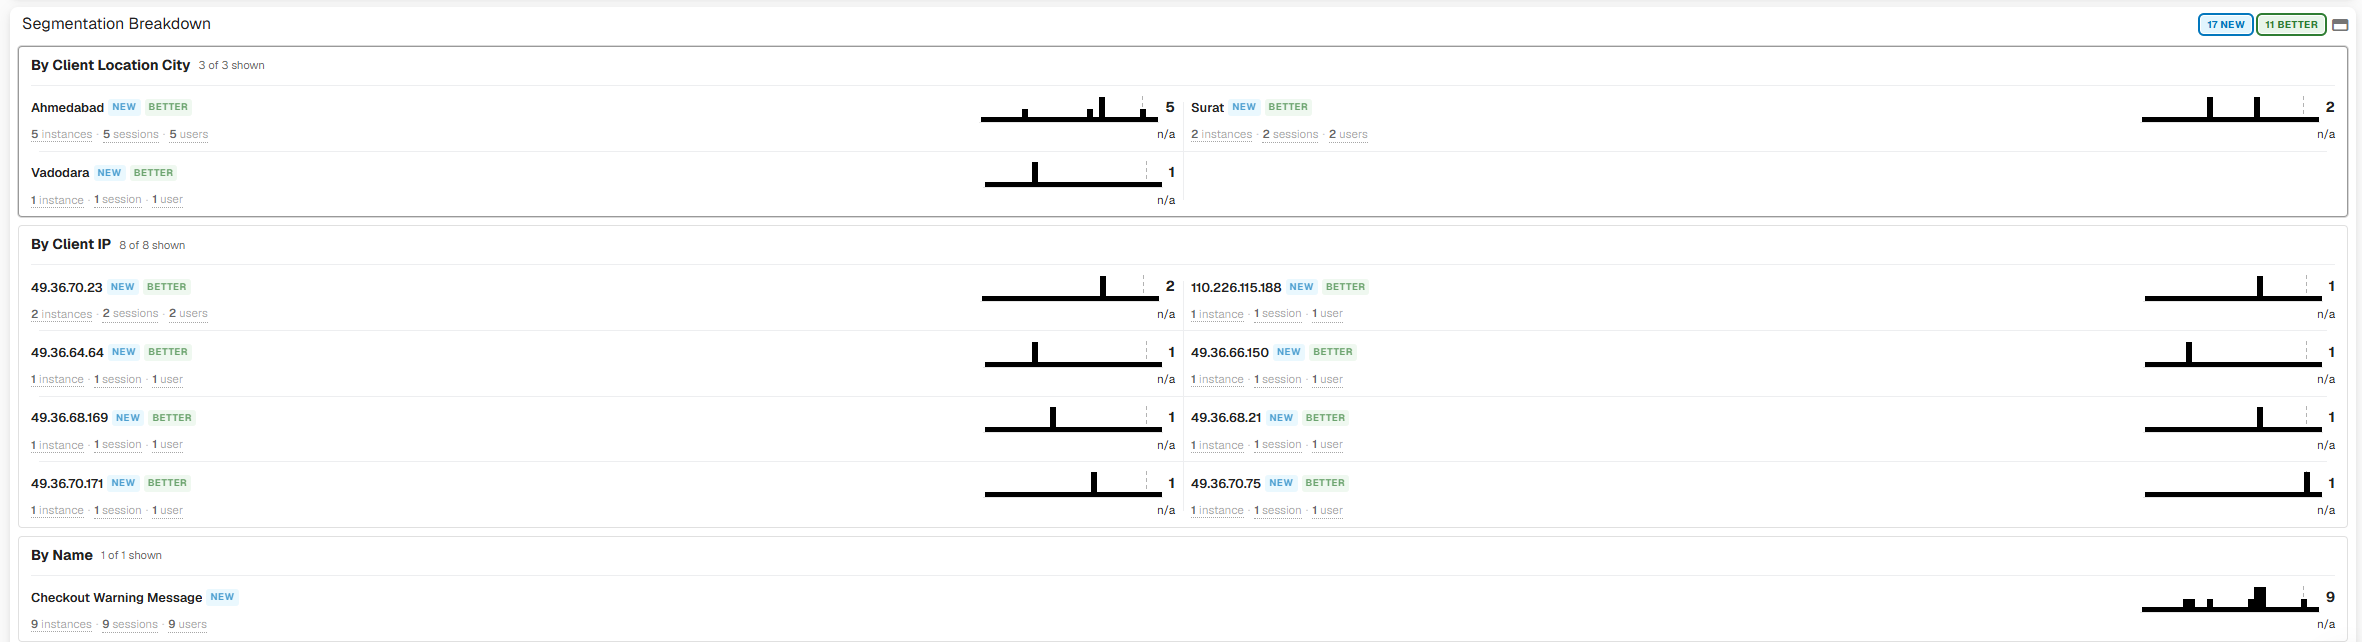
Segmentation and Leading Factors
Drop-off analysis becomes actionable when abandonment is broken down by relevant dimensions.
Examples include:
|
Segment |
Examples |
|
User |
New or returning, role, team, customer type or account |
|
Journey |
Entry point, milestone, workflow, funnel or campaign |
|
Experience |
Page, screen, feature, content or product |
|
Technology |
Device, browser, operating system, version or environment |
|
Geography |
Country, region or location, when configured |
|
Performance |
Fast, typical or slow response-time range |
|
Errors |
Error category, visible failure or affected component |
|
Transaction |
Product, order value, payment method or another business attribute |
Leading Factors help identify where drop-off behavior is degraded, unusually high, newly appearing or materially different from other segments.
💡 Understand Why Users Drop Off
A drop-off metric identifies the symptom. GermainUX correlates it with evidence that helps explain the cause.
🖱️ Behavioral Friction
-
Rage clicks, dead clicks or repeated interactions
-
Confusing navigation
-
No-result searches
-
Content or calls to action receiving little engagement
-
Repeated attempts followed by abandonment
⚙️ Workflow Friction
-
Excessive or unclear steps
-
Long waits and manual approvals
-
Missing information or dependencies
-
Failed handoffs between systems or teams
-
Automation that did not execute
💻 Technology Friction
-
User-facing errors
-
Slow pages or application operations
-
Browser freezes
-
Failed APIs or integrations
-
Payment, authentication or data failures
-
Application or infrastructure availability problems
🏢 Experience and Business Conditions
-
Unexpected fees or policies
-
Product unavailable or out of stock
-
Irrelevant landing-page content
-
Insufficient payment or delivery options
-
Poor chatbot or support interaction
-
Campaign-to-landing-page mismatch
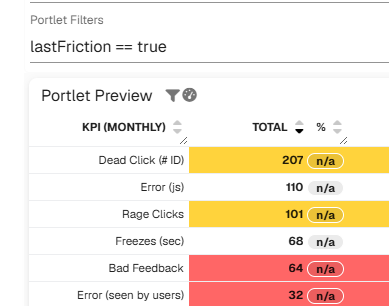
Check the LastFriction measure for any Conversion-relaated KPIs, the AI Explore feature and the Dashboard (specific to any eCommerce-related frictions and KPIs).
🎥 Session Replay
GermainUX Session Replay lets teams inspect what users experienced before abandoning.
Replay can show:
-
The user’s path and apparent objective
-
The last successfully completed milestone
-
Clicks, input, searches and navigation
-
Errors, delays and failed requests
-
Signs of confusion or frustration
-
What the user attempted immediately before leaving
Teams can start with the segments contributing the most impact, then replay representative sessions instead of selecting recordings at random. More details on Replay.
🗺️ Focused Flow and Journey Analysis
Focused Flow visualizes progression and drop-off across configured journey milestones. It helps teams understand:
-
The number of users reaching each stage
-
Completion and abandonment between stages
-
Friction associated with each transition
-
Differences across segments
-
The business impact of each drop-off point
Users can drill from the flow into the affected population, related evidence and individual sessions. More details on Journey Analysis.
🧠 AI-Assisted Analysis
AI Explore can help teams ask questions about the available drop-off evidence, including:
-
Why did this segment abandon more frequently?
-
Which related KPIs changed at the same time?
-
Which users, products or workflows are most affected?
-
What patterns appear across the relevant sessions?
-
Which probable causes should be investigated first?
-
What corrective actions may reduce abandonment?
AI-generated findings should be validated against the underlying metrics, journey definition and Session Replay.
🔔 Alerts, Reports and Action
GermainUX can turn drop-off analysis into action through:
-
Real-time alerts when drop-off rates exceed configured thresholds
-
Anomaly detection for unexpected spikes or regressions
-
Scheduled conversion, adoption or productivity reports
-
Links to affected segments and Session Replay
-
Dynamic investigation actions
-
Approved follow-up or remediation workflows
Alerts should account for both rate and volume so teams do not overreact to very small segments or overlook high-impact abandonment in large populations.
✅ Validate Improvement
After a UX, workflow, content or technology change is deployed, GermainUX can verify whether:
-
Drop-Off Rate decreased
-
Drop-Off Share shifted away from the affected segment
-
Journey completion improved
-
Conversion, adoption or engagement increased
-
Errors and delays declined
-
Users completed the process faster
-
The improvement persisted across devices, versions and segments
📦 Additional Resources
-
Conversion Insights
-
AI Insights & Recommendations
-
More Analytics Features
-
More Automation Features
-
Management Features.
ℹ️ Get Help
The Germain Team can help you set this up. Contact GermainUX Support.
Service: Analytics
Feature Availability: 2025.2 or later