
📊 Adoption Insights
GermainUX helps organizations improve the adoption of CRM, ERP, and other business applications by showing how employees actually use them, where they struggle, which features or workflows are being avoided, and why expected processes are not being completed.
It connects user behavior, business workflows, application performance, errors, and Session Replay to answer critical adoption questions:
|
Question |
|---|
|
Which application features are being used—and which are not? |
|
Are users following the intended business processes? |
|
Where do users abandon, delay, or repeat their work? |
|
Which screens, actions, errors, or performance issues create friction? |
|
Which users, teams, locations, roles, or application versions are affected? |
|
How much employee time is being lost? |
|
What should be corrected, simplified, automated, or reinforced through training? |
By identifying the issues that prevent users from working successfully, GermainUX helps organizations increase application adoption, improve productivity, reduce frustration, and obtain more value from their technology investments.
📊 Check the Adoption Tab for Real-Time Insights
For an immediate view of application adoption, open the Adoption tab in the GermainUX Operational Dashboard.
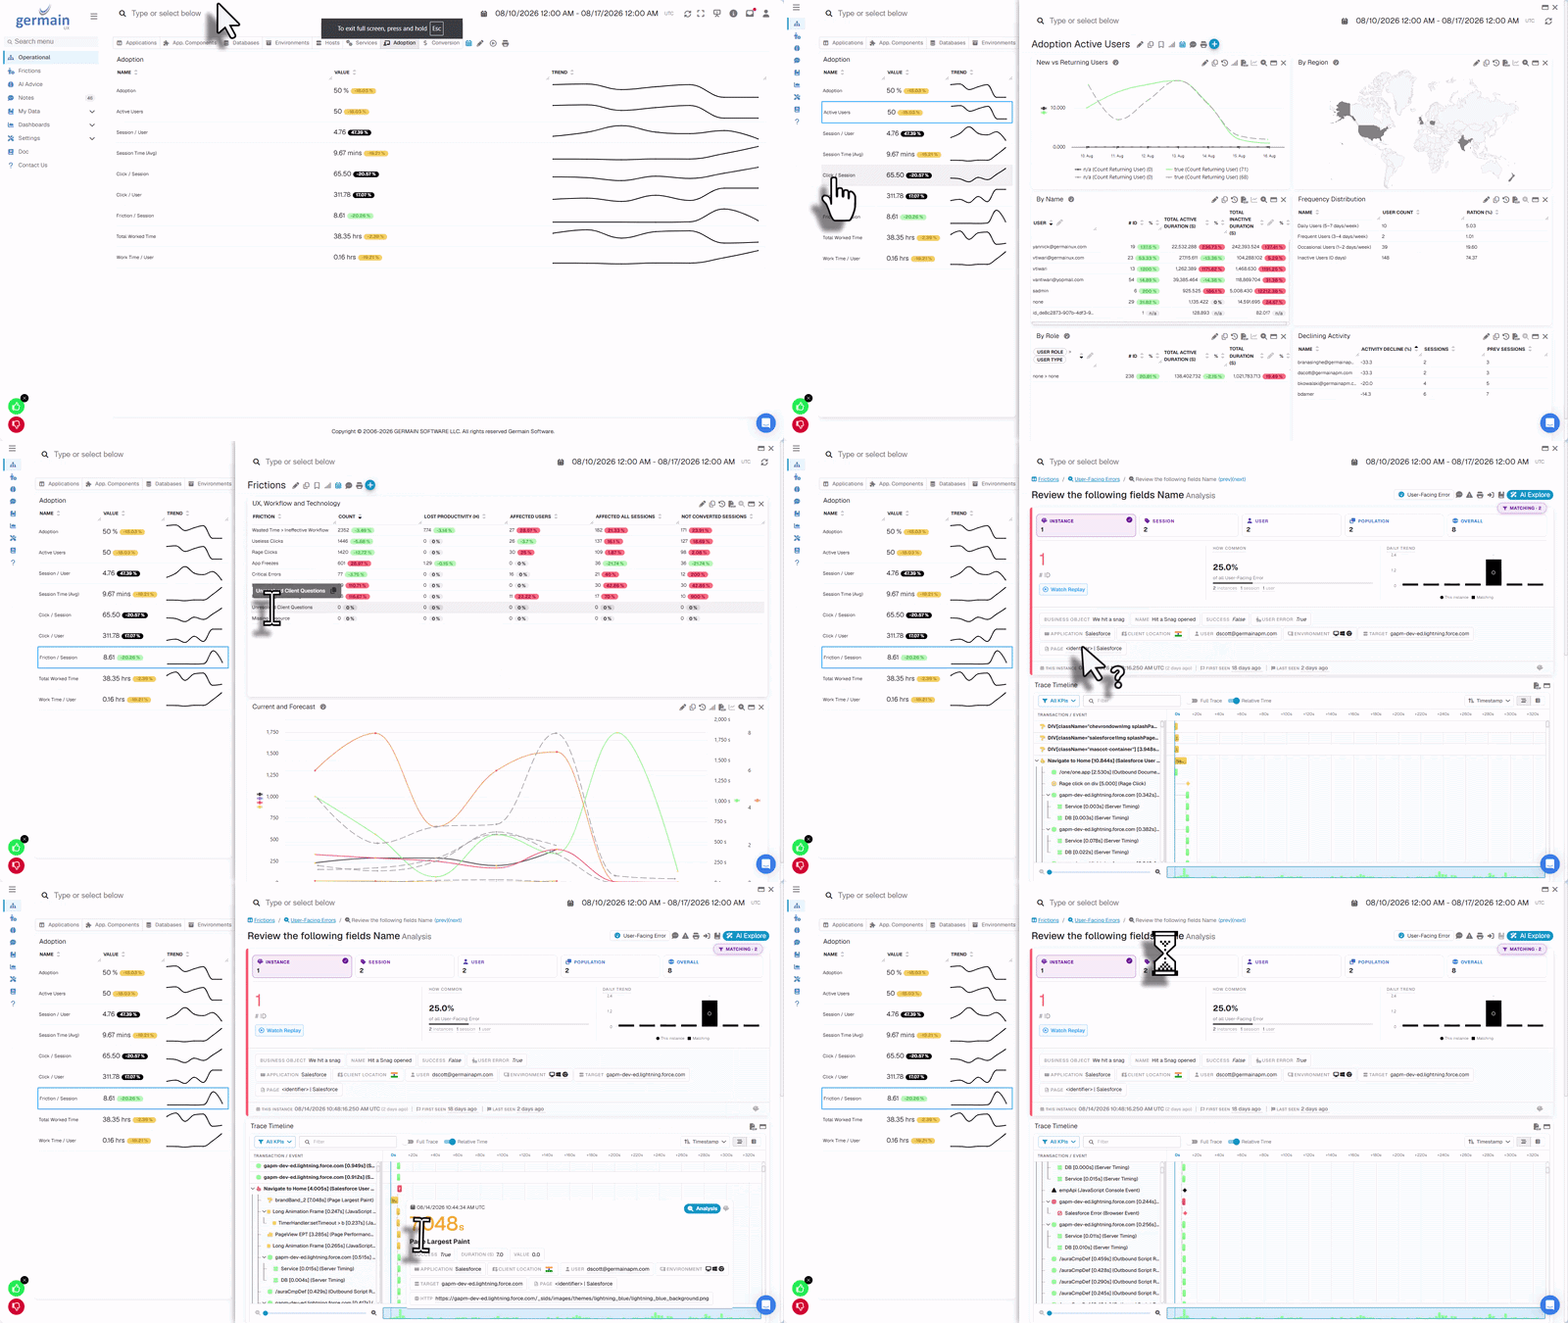
The Adoption tab continuously brings together the most important adoption signals so you can quickly see:
-
How many users are actively using the application
-
Which features, screens, and workflows are being used
-
Where users abandon or struggle with expected processes
-
Which adoption frictions are affecting users
-
Which users, teams, roles, or other populations are most affected
-
Whether errors or application performance are interfering with adoption
-
How much time users spend completing their work
-
Whether adoption is improving or declining over time
When something requires further investigation, drill into the underlying KPI to identify the affected population and understand why:
Adoption → Friction → Affected Population → Analysis → Session Replay → Likely Contributing Factors
Use the Adoption tab for real-time operational insights, then drill into GermainUX Analytics when you need to understand the underlying cause.
🔎 Adoption Analysis
The GermainUX Analysis Dashboard helps teams move from an adoption symptom to an evidence-backed root cause.
For example, if users are not adopting a CRM feature, Analysis can help determine:
|
Question |
|---|
|
Whether usage is declining or has always been low |
|
Which users or teams are not using the feature |
|
Which screens or workflow steps are affected |
|
Whether users are abandoning the process |
|
Whether errors or validation messages are preventing completion |
|
Whether application slowness is discouraging usage |
|
Whether the issue began after a release or configuration change |
|
How much user time and productivity are being lost |
Analysis combines:
|
Component |
|---|
|
Comparisons with recent and historical baselines |
|
Adoption trends 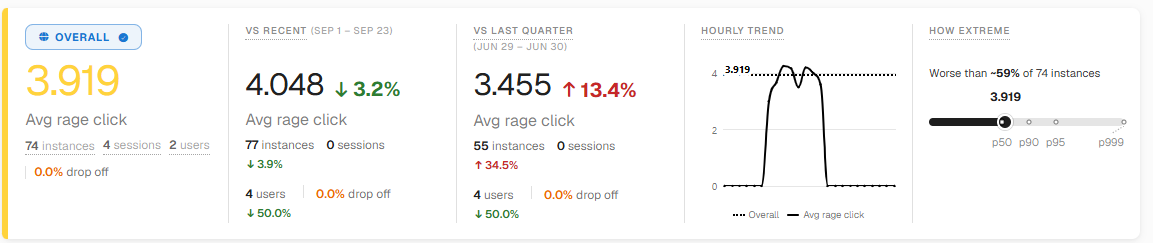
|
|
Related KPIs 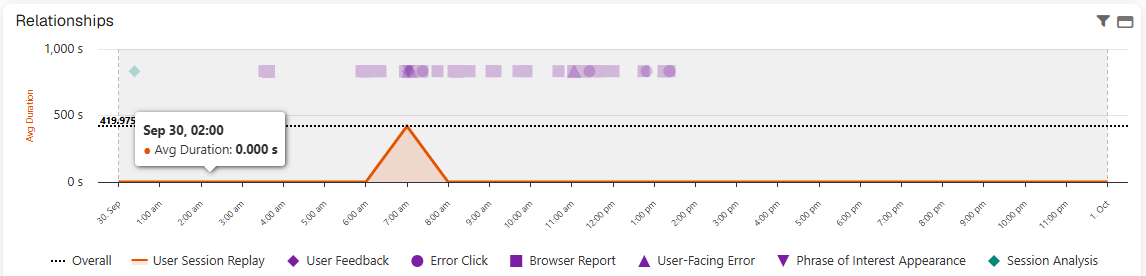
|
|
Correlations |
|
Leading Factors and segmentation 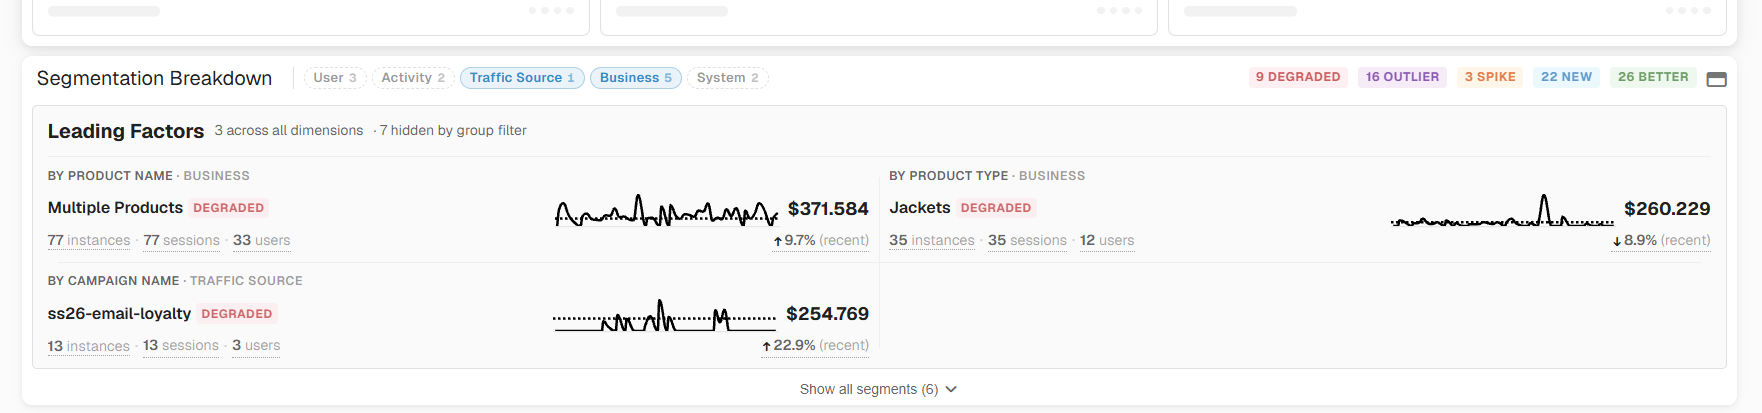
|
|
Individual user actions |
|
Technical traces 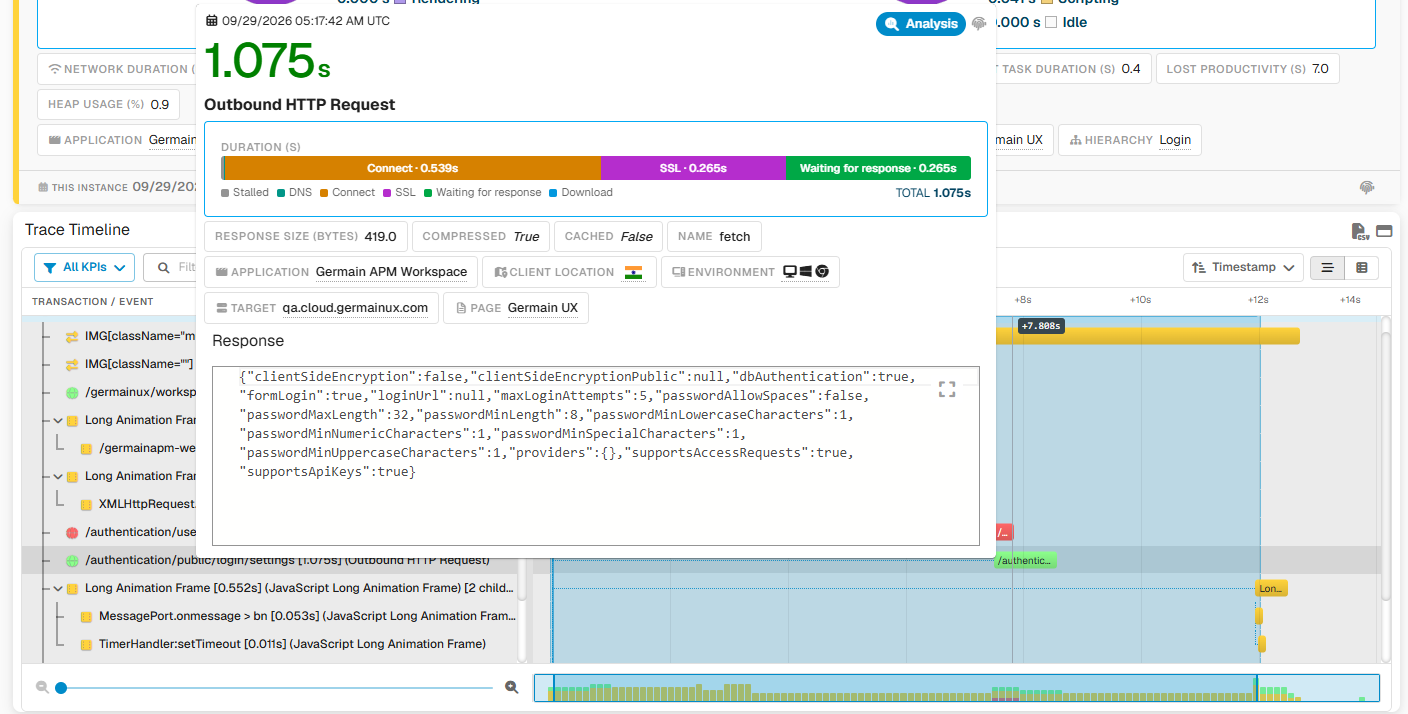
|
|
Session Replay |
|
AI-assisted explanations and recommendations |
This allows product owners, business-process owners, UX teams, support teams, and developers to investigate adoption issues together using the same evidence.
👣 Behavioral and Journey Insights
GermainUX analyzes how users navigate applications and complete their work.
The Focused Flow portlet identifies the most common paths users take through an application or workflow. It shows which journeys lead to successful completion and which lead to abandonment, delays, repeated actions, or other friction.
Use behavioral analysis to identify:
|
Insight |
|---|
|
The paths users take instead of the intended workflow 
|
|
Steps that users repeatedly revisit |
|
Screens where users hesitate or abandon 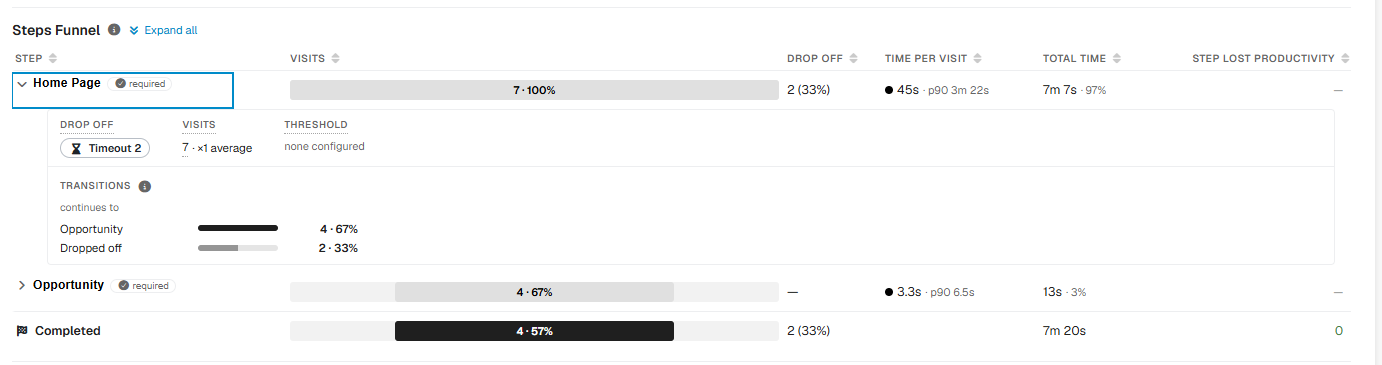
|
|
Actions performed immediately before a drop-off |
|
Errors and performance problems encountered during the journey or right before drop-off 
|
|
Differences between successful and unsuccessful users |
|
Workarounds used when the intended process is difficult |
|
Features that are difficult to discover or understand |
This helps teams determine whether poor adoption is caused by usability, training, workflow design, application configuration, or technology performance.
💡 Example
If users abandon a CRM opportunity-creation process, Focused Flow can show:
-
The steps completed before abandonment
-
The screen where users most frequently stop
-
The errors, validation messages, or delays encountered
-
Alternative paths users take
-
The users and teams most affected
-
The sessions available for replay
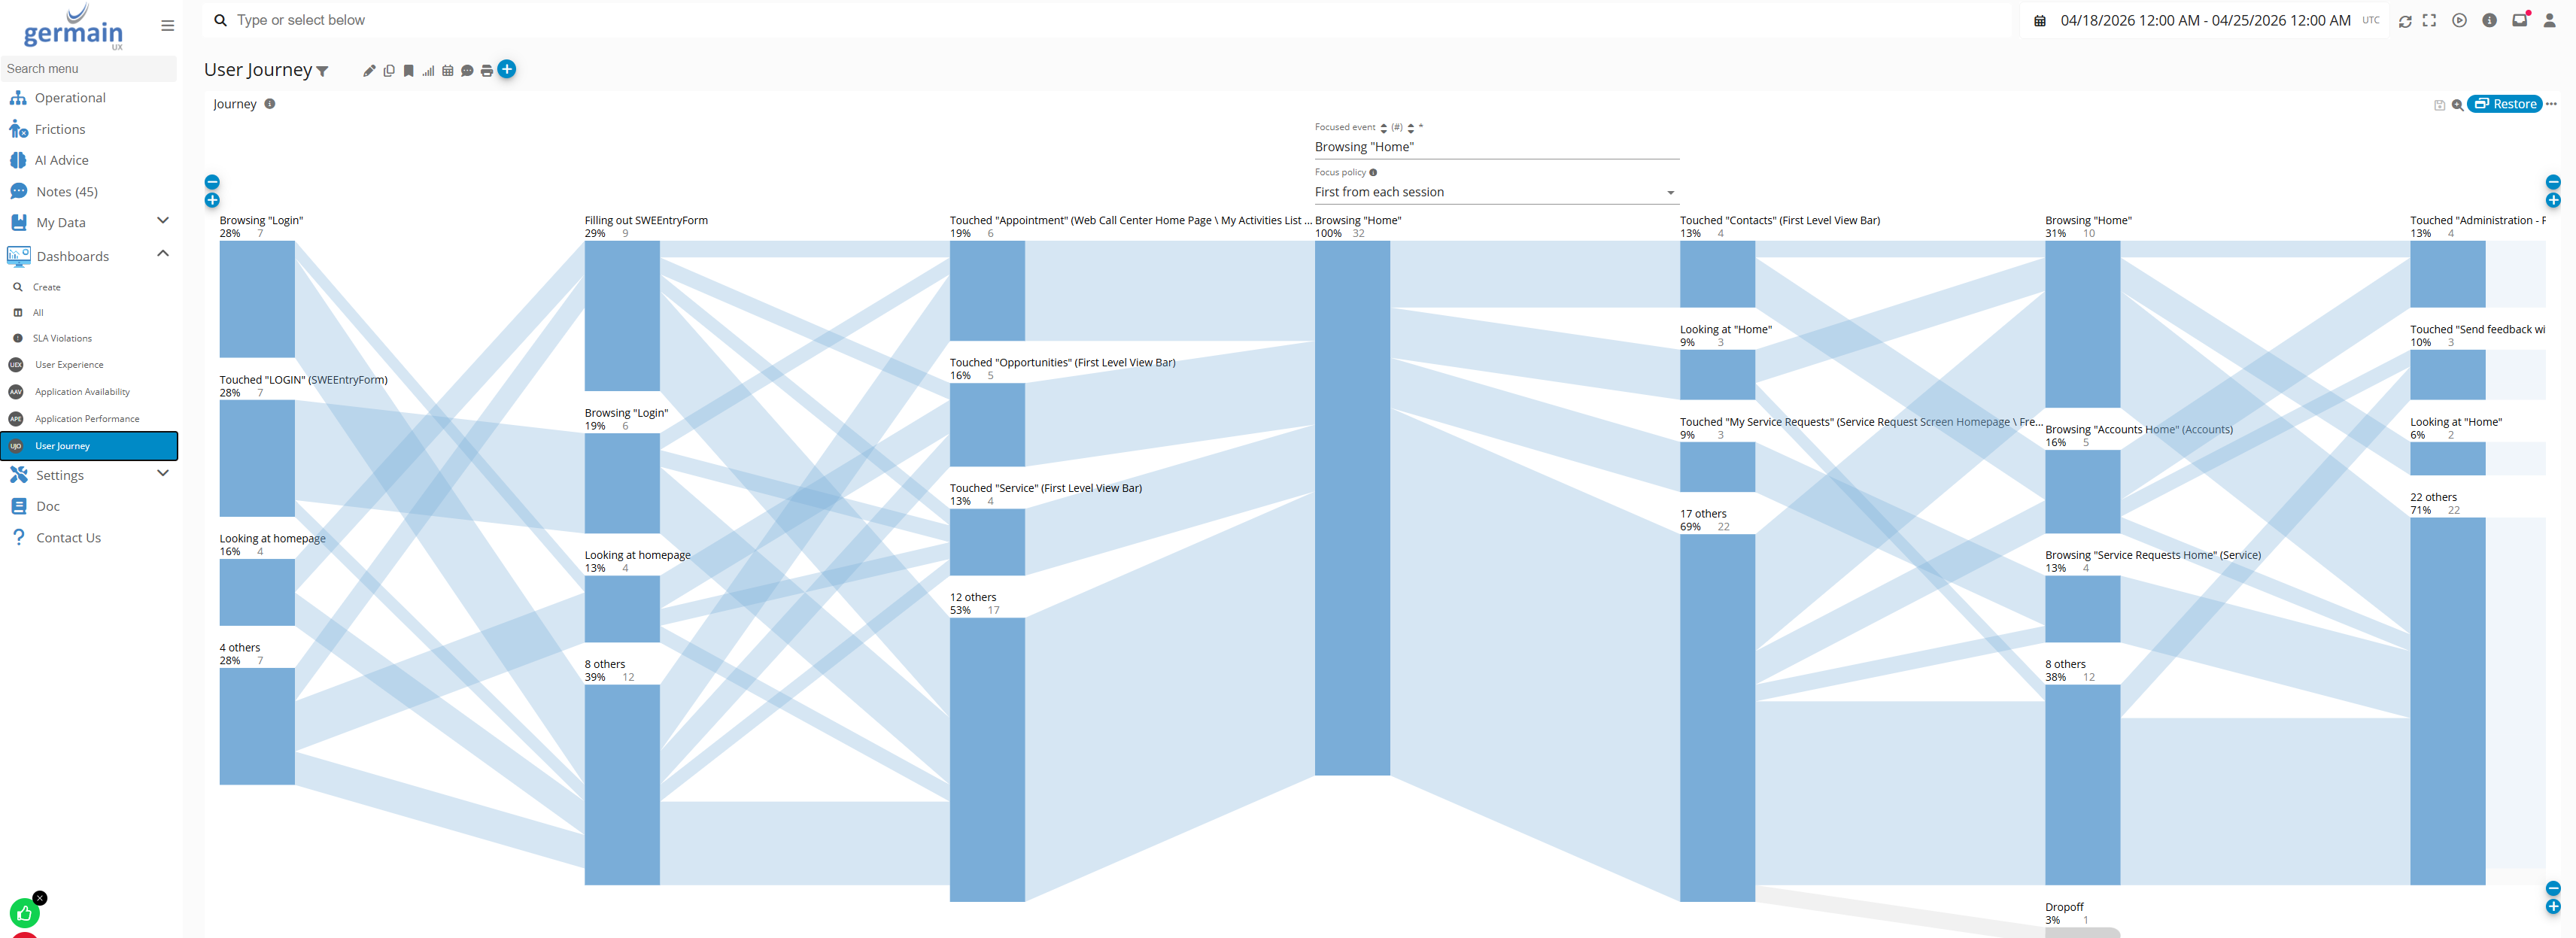
See Behavior Analysis and Focused Flow.
⚙️ Feature-Usage Analysis
GermainUX measures how frequently application features, pages, screens, and actions are used.
Feature-usage analysis helps answer questions such as:
|
Question |
|---|
|
Are users adopting a newly released feature? |
|
Which features are rarely or never used? |
|
Which users or teams have adopted the feature? |
|
How frequently do users return to it? |
|
Are users completing the intended action after opening the feature? |
|
Did adoption improve after training or a UX change? |
|
Are technical issues preventing the feature from being used successfully? |
Usage can be compared across periods and segmented by user, team, role, application version, location, or other collected attributes.
This helps organizations distinguish between:
|
Possible Cause |
|---|
|
A discoverability problem |
|
A usability problem |
|
A training problem |
|
A process problem |
|
A permissions or configuration problem |
|
A technology-performance problem |
⌛ User and Process Time Mining
GermainUX measures how long users take to complete tasks and business processes in applications such as CRM, ERP, customer-service, and other internal systems.
A process can be broken down into configurable stages to show:
|
Metric |
|---|
|
Total completion time |
|
Time spent at each step 
|
|
Waiting and idle time |
|
Repeated or unnecessary actions |
|
Workflow overruns |
|
Abandoned processes |
|
Differences across users, teams, or application versions |
|
Lost employee productivity |
📋 Examples
GermainUX can measure:
-
The time required to open and close a service request
-
The time required to create or update a CRM opportunity
-
The time required to generate a quote
-
The time required to complete an employee onboarding process
-
The time required to enter or approve an order
-
The time required to complete a multi-step internal workflow
This helps organizations identify where application friction or inefficient processes consume employee time.
To enable real-time process-time analysis, configure a Business Process. GermainUX will then monitor the process and generate the corresponding insights.
📉 Drop-Off Analysis
Drop-Off Analysis identifies the workflow stages where users fail to continue or complete an intended process.
The Focused Flow portlet shows:
|
Metric |
|---|
|
How many users reached each milestone |
|
How many continued to the next step |
|
Where users abandoned |
|
Which actions occurred before abandonment |
|
Which frictions affected unsuccessful journeys |
|
Which users, teams, or application versions experience the most drop-offs |
For application adoption, a drop-off may indicate that users:
|
Possible Reason |
|---|
|
Cannot find the next action |
|
Do not understand what is required |
|
Encounter a validation message |
|
Experience an application error |
|
Wait too long for the application to respond |
|
Use an alternative workaround |
|
Leave the process incomplete |
Teams can open the affected sessions to verify what happened and determine whether the solution requires a UX improvement, application correction, workflow redesign, automation, or additional user guidance.
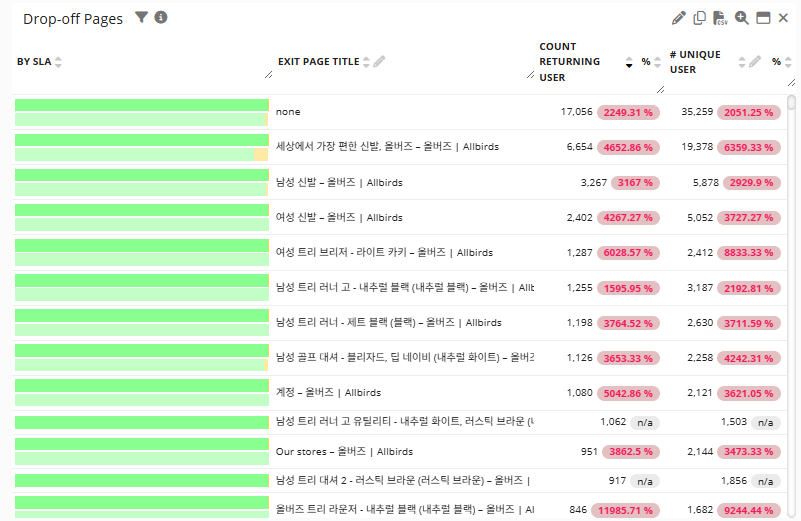
See Drop-Off Analysis and Focused Flow.
🔁 Session Replay, Heatmaps, and AI Insights
Session Replay shows exactly how users interact with an application and what they experience while completing—or attempting to complete—their work.
Use Session Replay to understand adoption issues such as:
|
Issue |
|---|
|
Difficulty finding a feature |
|
Confusing navigation |
|
Repeated clicks or actions |
|
Rage clicks |
|
User-facing errors |
|
Validation messages |
|
Searches with no results |
|
Slow or unresponsive screens |
|
Workflow abandonment |
|
Reliance on inefficient workarounds |
Heatmaps aggregate user behavior to show where users click, focus their attention, or encounter friction across many sessions.
AI capabilities can summarize the most significant adoption issues within one session or across multiple sessions. They can help identify recurring behavioral patterns, explain likely causes, and recommend potential improvements.
This allows teams to understand both:
|
Perspective |
|---|
|
What is happening at scale, through metrics, flows, and heatmaps |
|
Why it is happening, through Session Replay, technical evidence, and AI-assisted analysis |
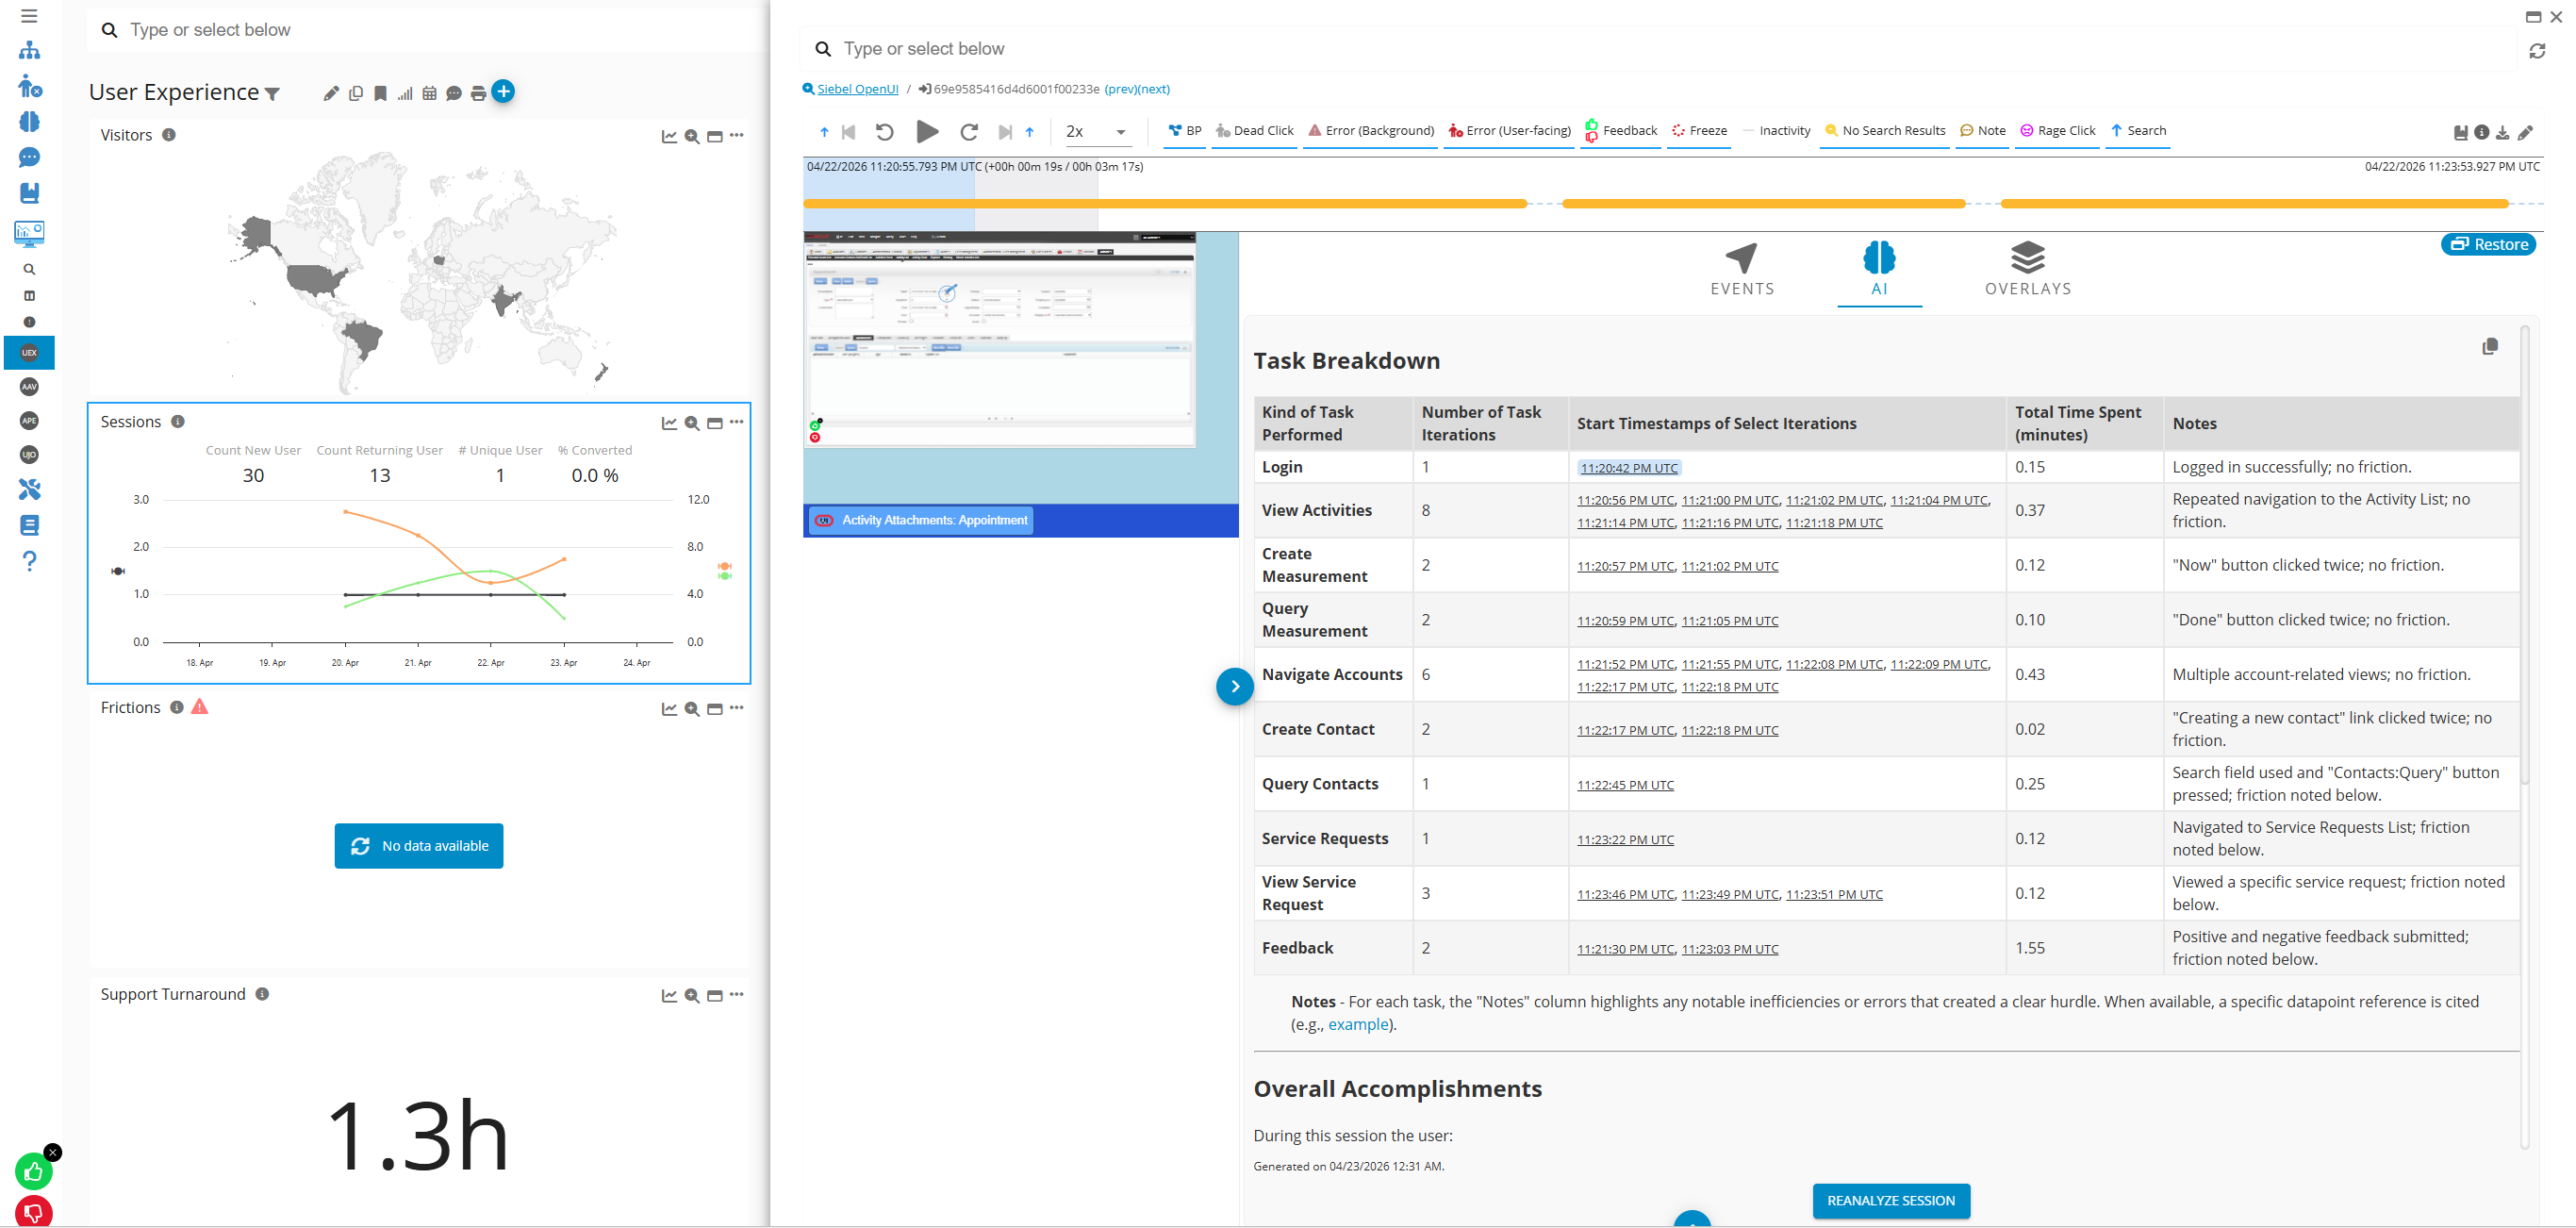
See User Session Replay and Heatmaps.
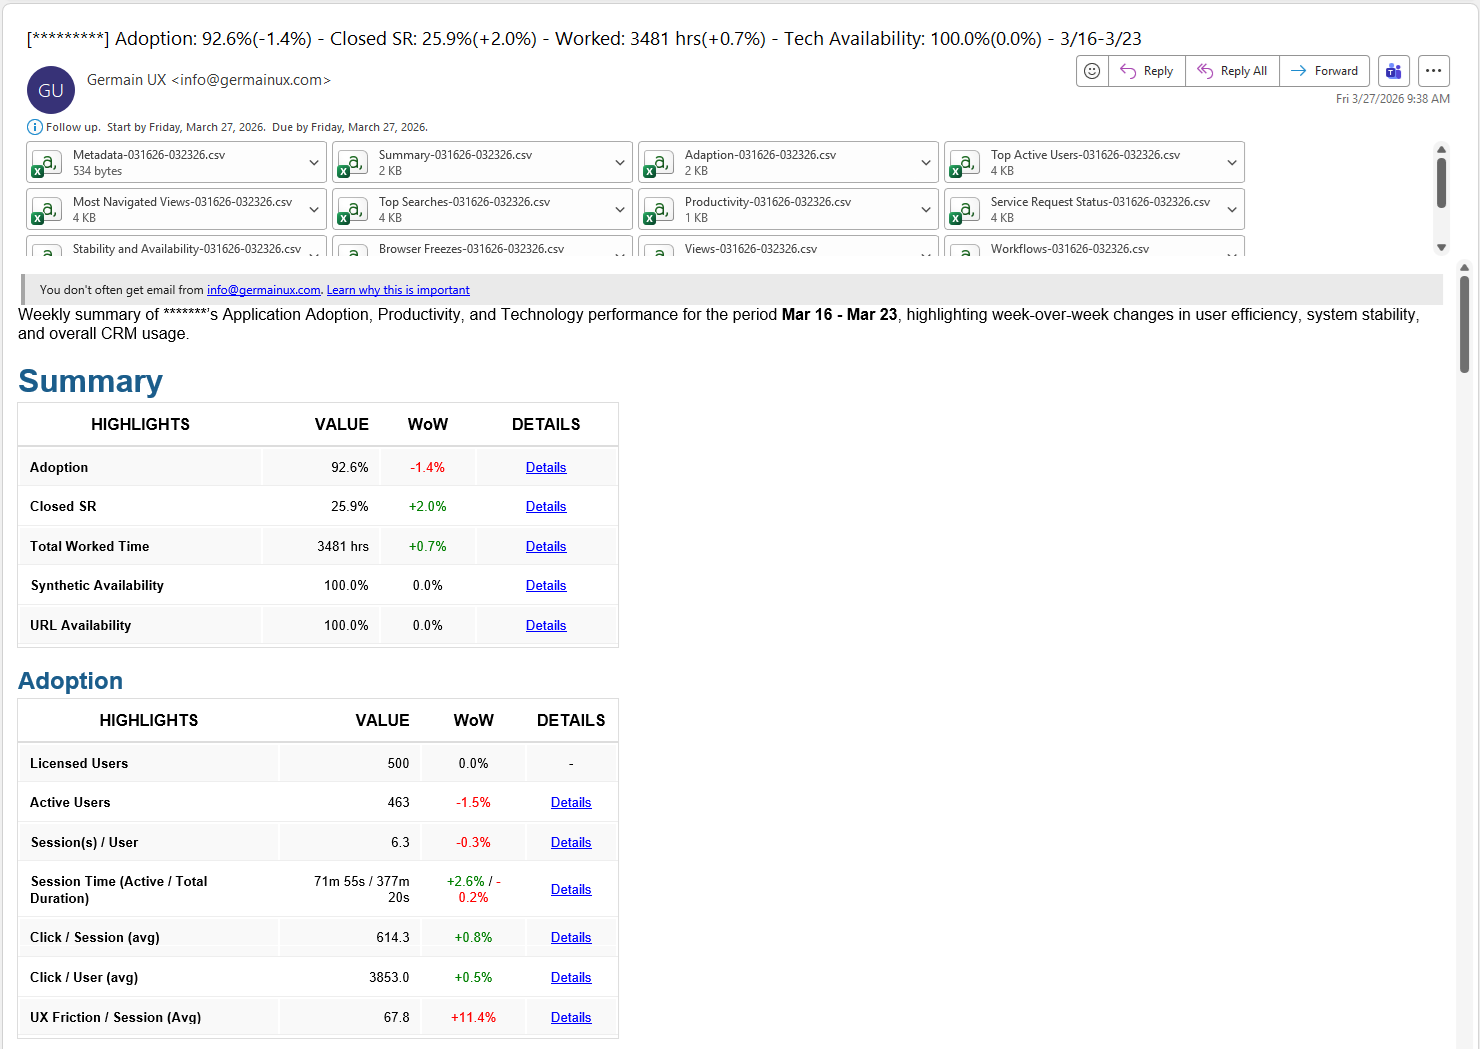
📅 Automated Adoption Reports
Adoption Reports can be automatically generated and delivered daily, weekly, monthly, quarterly, or according to another configured schedule.
Reports can include:
|
Report Item |
|---|
|
Adoption trends |
|
Feature usage |
|
Workflow completion and drop-offs |
|
User and process times |
|
Frictions affecting users |
|
Affected populations |
|
Lost productivity |
|
Supporting evidence |
|
Recommendations |
|
Quantified impact |
Reports are configurable and can be tailored to different audiences, including:
|
Audience |
|---|
|
Application owners |
|
Product teams |
|
Business-process owners |
|
UX teams |
|
Support and operations teams |
|
Department managers |
|
Executive stakeholders |
🔁 From Adoption Issue to Resolution
GermainUX provides a continuous workflow for improving application adoption:
-
Measure adoption across users, features, and business processes.
-
Identify friction affecting usage or process completion.
-
Determine who is affected through segmentation and Leading Factors.
-
Understand why using Analysis, traces, Session Replay, and AI.
-
Quantify the impact on users, workflows, and productivity.
-
Prioritize corrective actions based on reach and business impact.
-
Validate the improvement by comparing adoption before and after the change.
By combining behavioral analytics, workflow analysis, technical monitoring, Session Replay, and AI-assisted recommendations, GermainUX helps organizations increase adoption and ensure that users can complete their work successfully and efficiently.
📦 Additional Resources
-
User Session Monitoring, Replay and Heatmaps.
-
Journey Insights
-
Work Time Insights
-
Sentiment Insights
-
Story Beat Insights
-
Behavior Insights
-
AI Insights & Recommendations
-
More Analytics Features
-
More Automation Features
-
Management Features.
ℹ️ Get Help
The Germain Team can help you set this up. Contact GermainUX Support.
Component: Mobile App, Rum Ext, RUM JS, RUM Windows
Feature Availability: 2014.1 or later