
💥 Browser Crash Monitoring
GermainUX RUM Extension monitors supported browser crash events and creates a KPI fact when a browser, tab, GPU process, or extension crashes, or when the browser forces a reload.
Browser Crash Monitoring helps teams identify unstable browser experiences, determine which users and applications were affected, and correlate crashes with activity recorded before the interruption.
✨ Benefits
Browser Crash Monitoring helps organizations:
|
Benefit |
|---|
|
Detect supported browser and tab crashes in real time. |
|
Identify affected users, applications, pages, and browser versions. |
|
Distinguish browser crashes from JavaScript errors or browser freezes. |
|
Analyze crash frequency and trends. |
|
Identify crashes concentrated within a specific application version, browser, device, or workflow. |
|
Review available user and technical activity preceding the crash. |
|
Notify interested GermainUX users when a crash is detected. |
|
Prioritize issues according to affected users and business impact. |
⚙️ Preconfigured monitoring
Browser Crash Monitoring is available through the GermainUX RUM Extension.
GermainUX supports the following crash-event categories when they are exposed by the browser:
|
Crash type |
Description |
|---|---|
|
Full Crash |
The browser terminates unexpectedly |
|
Tab Crash |
A browser tab crashes, such as Chrome’s Aw, Snap! condition |
|
GPU Crash |
The browser’s graphics-processing component crashes |
|
Extension Crash |
A monitored browser extension crashes |
|
Forced Reload |
The browser reloads a page because of a mobile, memory, or similar browser condition |
The precise event details depend on what the browser and extension-management APIs make available.
📁 What GermainUX records
A browser crash event can include available context such as:
|
Context item |
|---|
|
Crash type |
|
Event timestamp |
|
Application |
|
Page or URL |
|
Environment |
|
Browser and browser version |
|
Operating system |
|
User or session identifier, when authorized |
|
Extension identifier, when relevant |
|
Related user-session activity |
|
Available technical events preceding the crash |
Not every crash provides the same information. A sudden browser or operating-system termination can prevent the browser from transmitting its final state.
 Browser crash versus other browser issues
Browser Crash Monitoring should not be used as a general category for every browser-side failure.
|
Condition |
GermainUX monitoring |
|---|---|
|
Browser, tab, GPU, or extension terminates |
Browser Crash Monitoring |
|
Page becomes temporarily unresponsive |
JavaScript Long Task or Browser Freeze Monitoring |
|
JavaScript code throws an exception |
JavaScript Console and Error Monitoring |
|
A promise fails without being handled |
Unhandled Promise Rejection Monitoring |
|
An HTTP request fails |
Network Requests Monitoring |
|
A user clicks an ineffective element |
Dead or Error Click Monitoring |
|
Page memory increases abnormally |
JavaScript and Page Memory Monitoring |
Analyzing these KPIs together helps determine whether a crash was preceded by high memory consumption, long-running JavaScript, application errors, or another observable condition.
🚀 Enable Browser Crash Monitoring
Browser Crash Monitoring requires the GermainUX RUM Extension.
📋 Enable steps
-
Sign in to the GermainUX Workspace.
-
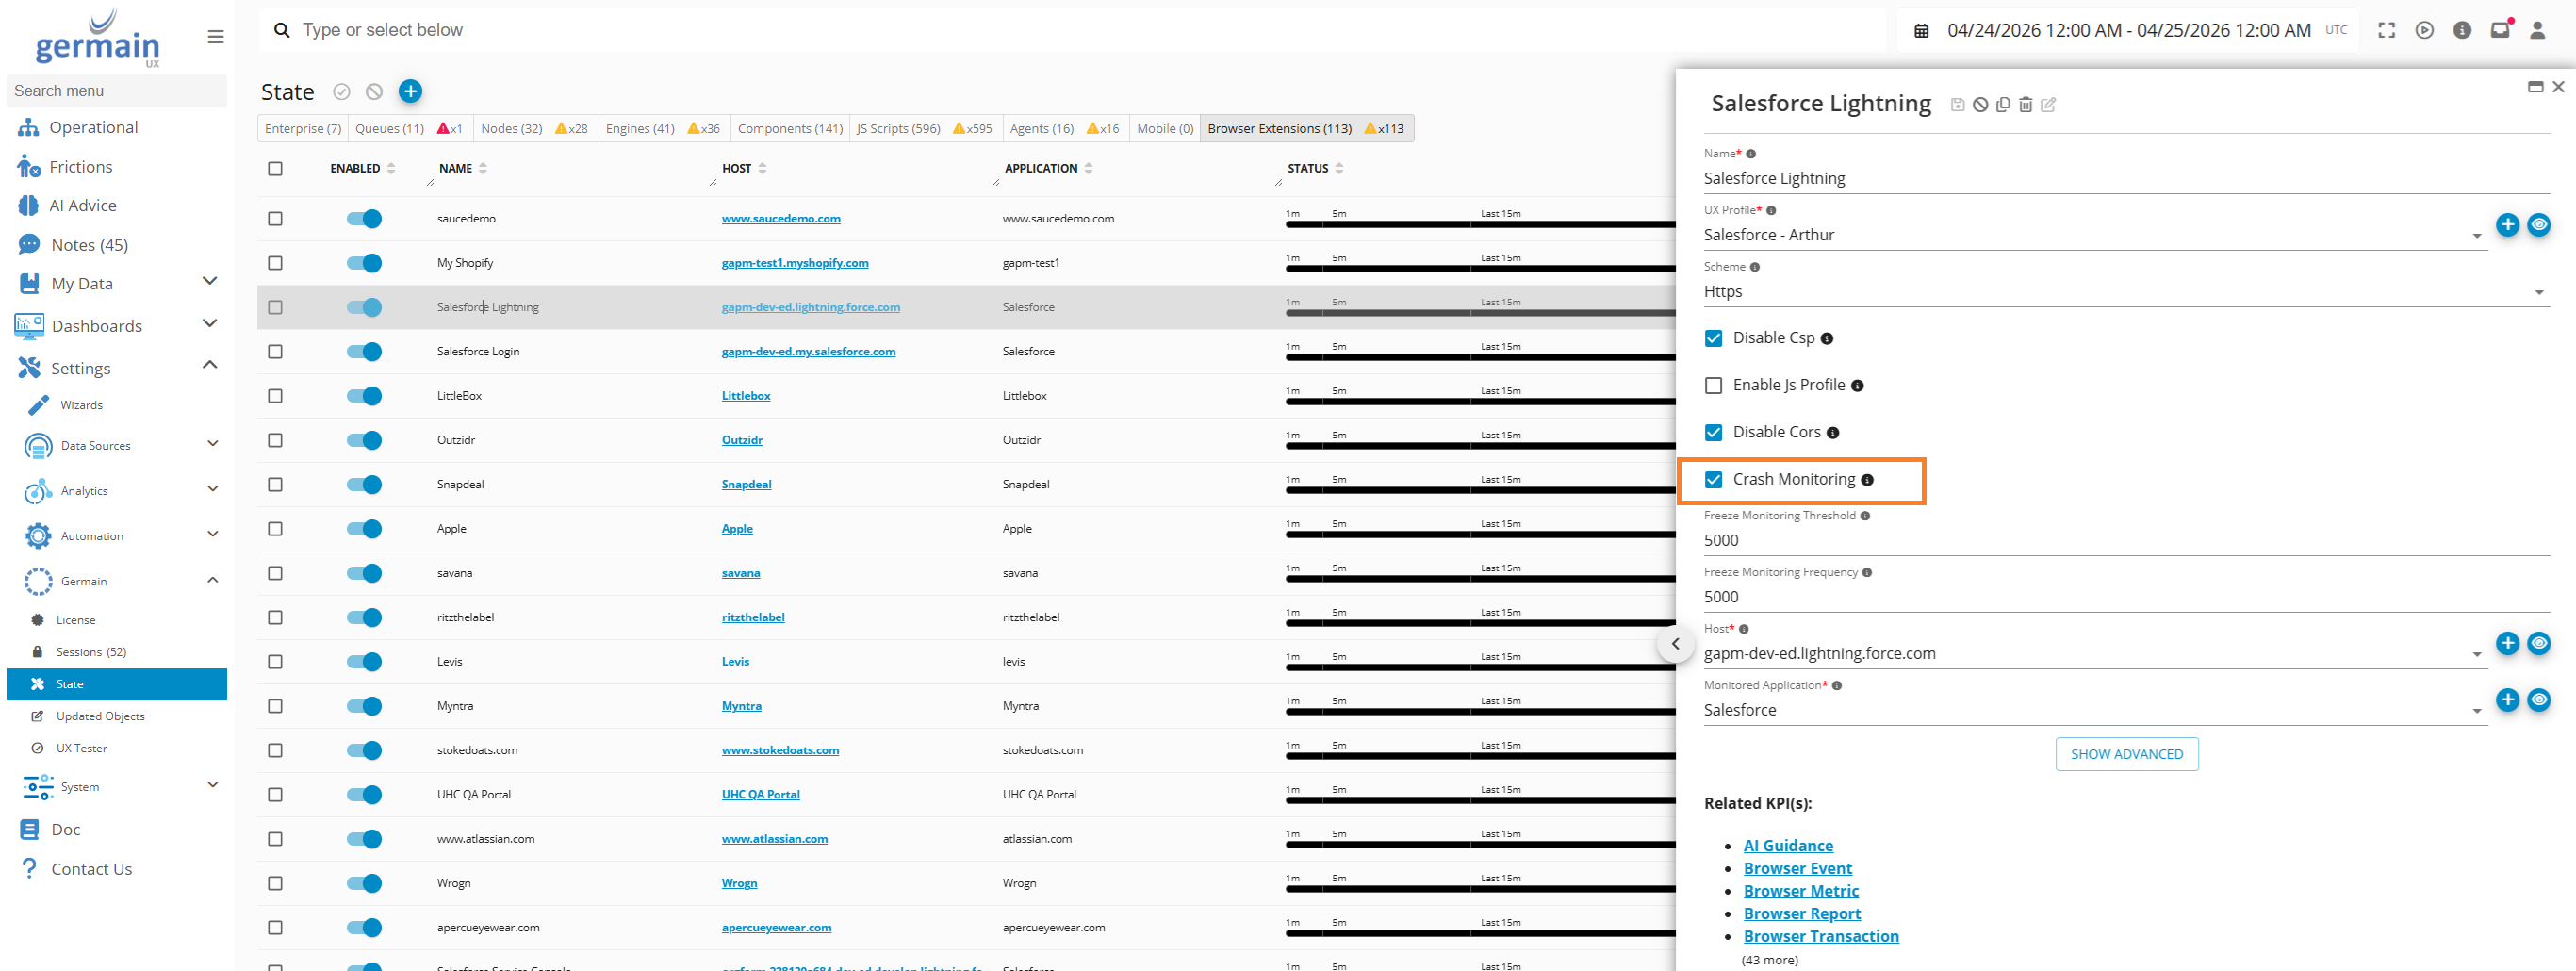
Go to Settings > Germain State > Browser Extensions.
-
Select the browser-extension application.
-
Locate Crash Monitoring.
-
Enable the setting.
-
Save the configuration.
-
Refresh or restart the extension when required.
-
Confirm that the updated configuration reaches the monitored browsers.
Workspace labels can vary by GermainUX version.
✅ Configure the threshold
GermainUX can create an insight when the number of detected browser crashes reaches the configured threshold.
The following example sets the threshold to one crash:
const settings = germainApm.getDefaultSettings();

settings.plugins.browsercrash.levelThreshold = 1;

germainApm.start(settings);
A value of 1 means that the first supported crash occurrence meets the configured threshold.
Customize this value only when the default behavior does not meet the organization’s requirements.
📊 KPIs and analysis
Use the browser crash KPI to analyze:
|
KPI |
|---|
|
Crash count |
|
Unique users affected |
|
Unique sessions affected |
|
Crash rate |
|
Crash type |
|
Browser and browser version |
|
Operating system |
|
Application and environment |
|
Page or URL |
|
Application version |
|
Time period |
Useful analytical questions include:
|
Question |
|---|
|
Which application or page experiences the most crashes? |
|
Did crashes increase after a release? |
|
Are crashes concentrated in one browser version? |
|
How many users and sessions were affected? |
|
Are GPU crashes limited to particular devices? |
|
Did memory usage, long tasks, or JavaScript errors increase before the crashes? |
|
Which workflows were interrupted? |
Review the available KPIs for Browser Monitoring.
🔗 Correlation with user activity
When compatible browser and session telemetry is available, GermainUX can correlate a crash with:
|
Correlated item |
|---|
|
The affected user session |
|
Page navigation |
|
User interactions |
|
JavaScript errors |
|
Unhandled promise rejections |
|
Browser memory |
|
JavaScript long tasks |
|
Network requests |
|
Application version |
|
Business-process milestones |
The activity captured before the crash can help identify contributing conditions. It does not necessarily prove that a particular event caused the crash.
Session Replay ends at the last activity successfully transmitted before the browser or tab stopped functioning. The crash itself cannot be visually recorded after the browser context has terminated.
🔔 Notifications
A browser crash insight can be used to:
|
Use |
|---|
|
Trigger an alert when an SLA is violated. |
|
Notify interested GermainUX users through a Watch. |
|
Appear in a dashboard or report. |
|
Initiate an approved diagnostic workflow. |
|
Create a ticket through an authorized integration. |
For example, a Watch can notify a support engineer whenever GermainUX detects a tab crash for a critical application.
A Watch applies a notification to the crash insight already detected by GermainUX; it does not create a new crash insight.
🚫 Limitations
Browser Crash Monitoring is subject to browser and extension API limitations.
GermainUX may be unable to detect or fully describe:
|
Limitation |
|---|
|
A computer losing power |
|
An operating-system crash |
|
A browser process terminated by the operating system |
|
A browser removed before the event is transmitted |
|
A network loss that prevents the crash event from reaching GermainUX |
|
Crashes not exposed through the browser’s extension APIs |
|
Crashes occurring outside the authorized monitored browser |
|
Application failures that do not cause the browser or tab to crash |
A missing crash event does not prove that the browser remained operational.
🔒 Security and privacy
Browser crash facts generally contain technical metadata, but related sessions can include user and business information.
Before production deployment:
-
Confirm which applications and users may be monitored.
-
Mask or exclude sensitive Session Replay content.
-
Restrict access to individual user and crash details.
-
Avoid collecting unnecessary URLs or identifiers.
-
Configure retention and deletion requirements.
-
Ensure that centrally deployed extensions follow organizational policy.
-
Inform monitored users when required by the organization’s compliance program.
🏳️ Validation
Browser crashes should not normally be forced on production users. Validate the configuration in a controlled test environment.
-
Install and the RUM Extension in a supported test browser.
-
Confirm that the browser-extension application appears in GermainUX.
-
Enable Crash Monitoring.
-
Confirm that the extension receives the updated configuration.
-
Reproduce a supported test crash using an approved method.
-
Confirm that a Browser Crash fact appears in GermainUX.

-
Verify the crash type, browser, application, page, and timestamp.
-
Confirm that the event is associated with the appropriate session when possible.
-
Test the configured SLA, alert, or Watch.
-
Confirm that monitoring resumes after the browser or tab restarts.
🔧 Troubleshooting
If crash events are not collected:
-
Confirm that the GermainUX RUM Extension is installed and enabled.
-
Verify that Crash Monitoring is enabled for the application.
-
Confirm that the extension received its latest configuration.
-
Verify that the browser and version support the required extension APIs.
-
Confirm that the application URL matches the configured monitoring scope.
-
Verify that the browser can connect to GermainUX.
-
Check browser and extension policies.
-
Confirm that another extension or endpoint-security product is not blocking GermainUX.
-
Review available browser-extension and GermainUX logs.
-
Confirm that the tested condition is a supported browser crash rather than a JavaScript error or freeze.
📦 Deployment and configuration
|
For Browser Crash Monitoring |
|---|
|
Deploy the GermainUX RUM Extension. |
|
Create or select the browser-extension application and UX Monitoring Profile. |
|
Enable Crash Monitoring under Settings > Germain State > Browser Extensions. |
|
Use the preconfigured crash threshold or customize it when required. |
|
Review the available Browser Monitoring KPIs. |
|
Correlate crashes with Session Replay, memory, JavaScript, network, and long-task insights. |
|
Configure SLAs, alerts, Watches, dashboards, and reports when required. |
|
Validate crash detection safely in a controlled environment before production rollout. |
ℹ️ Get Help
The Germain Team can help you set this up. Contact GermainUX Support.
Component: JS Profiler, RUM JS, RUM Extension
Feature Availability: 2026.1 or later
Browser Support: only latest Chrome, Edge and Opera