
⚙️ Configuring GermainUX PHP Monitoring: Profiles, Components, and Performance Metrics
Configure GermainUX PHP monitoring to tailor profiling, transactions, sampling, network and SQL monitoring, integrations, correlation, analytics, privacy, alerts, automation, dashboards, and RCA.
This guide assumes PHP monitoring has already been deployed.
🚀 Access PHP Monitoring Configuration
Start from:
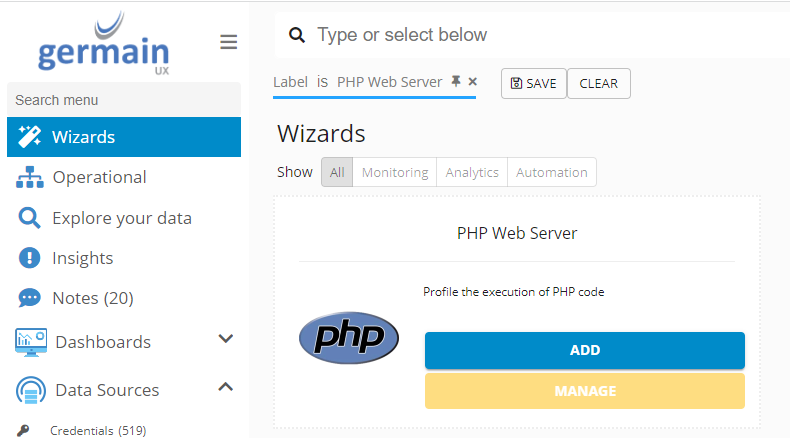
Germain Workspace → Left Menu → Settings → Wizards
Open the PHP monitoring configuration associated with the PHP environment.
Use the Wizard-generated configuration as the starting point rather than manually recreating the standard PHP configuration.
🏷️ Configure the Application
Verify that PHP telemetry is associated with the correct monitored application.
Use consistent names across:
-
Production
-
Staging
-
Development
-
Application components
-
PHP servers
Correct application association is essential for correlation across browser, PHP, API, database, and infrastructure telemetry.
🖥️ Configure the PHP Server
Verify that the correct PHP application server is associated with the monitoring configuration.
The server identifies where the monitored PHP application executes and where the relevant Engine, Agent, and server profile apply.
🔧 Configure the PHP Monitoring Profile
PHP monitoring profiles are configured through:
germain.apm.monitoringClient.phpMonitoringProfiles
The standard PHP configuration documented by GermainUX includes:
Basic Sampling
Use the appropriate PHP monitoring profile for the application and environment.
🎯 Configure Sampling
Configure PHP profiling sampling according to the visibility required and acceptable overhead.
Sampling determines how frequently or how broadly PHP execution is profiled.
Use deeper profiling selectively when troubleshooting performance issues and lighter sampling for continuous production monitoring where appropriate.
Validate overhead after changing the sampling configuration.
🧩 Configure Monitoring Components
PHP components are represented through:
germain.apm.monitoringConfig.components
Configure the monitoring components required for the environment.
Enable only the components needed for the selected monitoring scope.
🧱 Configure Component Templates
Component templates are represented through:
germain.apm.monitoringConfig.componentTemplates
Use component templates to maintain consistent configuration across similar PHP environments.
Different templates can be used when applications or environments require different monitoring behavior.
🖥️ Configure the PHP Server Profile
Server profiles are represented through:
germain.apm.monitoringConfig.serverProfiles
The standard profile documented for PHP is:
PHP Server
Verify that the PHP Server profile is applied to each PHP application server that should be monitored.
⚙️ Configure the PHP Agent
Verify the configuration in:
germainapm.php
including:
GERMAIN_SERVICES_URL
PROFILE_NAME
and other environment-specific settings.
The profile configured in the Agent must match the GermainUX PHP monitoring profile intended for the application.
⚙️ Configure PHP Code Profiling
Configure which PHP execution needs deeper profiling.
Code profiling can help identify:
-
Slow code
-
Expensive functions
-
Execution bottlenecks
-
Inefficient processing
-
PHP operations contributing to slow transactions
Use profiling selectively according to the troubleshooting objective.
⏱️ Configure PHP Transaction Monitoring
Configure meaningful PHP transactions for analysis.
Transactions can represent:
-
Application requests
-
Business operations
-
Backend processing
-
Service interactions
-
Critical workflows
Analyze each transaction with its associated:
-
PHP execution
-
Network requests
-
SQL
-
Integrations
-
User context where available
📨 Configure Network Request Monitoring
Configure monitoring for downstream network interactions initiated by PHP.
Examples include:
-
HTTP calls
-
REST APIs
-
External services
Analyze:
-
Response time
-
Latency
-
Destination
-
Related PHP transaction
Preserve parent transaction context so downstream latency can be attributed to the affected PHP transaction.
💾 Configure SQL Monitoring
Configure SQL monitoring for database interactions executed within PHP transactions.
Analyze:
-
SQL execution time
-
Slow SQL
-
Database interaction
-
Related PHP transaction
Where GermainUX database observability is also deployed, correlate the PHP SQL transaction with database-level telemetry.
🧩 Configure Integration Transactions
Configure monitoring for integration-level transactions.
Examples include:
-
External APIs
-
Message queues
-
Third-party services
-
Internal services
-
Other downstream systems
Maintain correlation between the PHP parent transaction and the integration activity.
🌐 Configure Browser-to-PHP Correlation
Where browser monitoring is deployed, configure correlation between user activity and PHP processing.
For example:
User → Browser → PHP Transaction
or:
User Action → PHP Transaction → SQL
or:
User Action → PHP Transaction → External API
This helps connect server-side PHP performance with the actual affected user experience.
🔗 Configure Stream Correlation Scenarios
PHP monitoring includes:
germain.apm.analytics.streamCorrelationScenarios
Configure stream correlation scenarios for relationships such as:
Browser Event → PHP Transaction
PHP Transaction → PHP Code
PHP Transaction → SQL
PHP Transaction → Network Request
PHP Transaction → Integration
A broader correlation path can be:
User → Browser → PHP → API / Service → Database
📈 Configure KPIs
PHP KPIs are represented through:
germain.apm.monitoringConfig.keyPerformanceIndicators
Configure KPIs for important PHP conditions.
Examples include:
-
PHP transaction duration
-
PHP execution time
-
Network-request duration
-
SQL duration
-
Integration duration
Use custom KPIs where the application's critical operations require additional monitoring.
📏 Configure SLAs
Create SLAs for PHP KPIs requiring threshold-based evaluation.
Examples:
PHP Transaction Duration > Threshold
PHP Execution Time > Threshold
Network Request Time > Threshold
SQL Execution Time > Threshold
Integration Duration > Threshold
Use thresholds appropriate to the individual application and operation.
🗂️ Configure Categorization
Categorize PHP telemetry into meaningful groups.
For example:
-
PHP Transaction
-
PHP Code
-
Network Request
-
SQL
-
API
-
Integration
-
Performance Issue
-
Application Component
Categorization simplifies analysis, dashboards, reporting, and alerting.
🔍 Configure Root Cause Analysis
Configure correlation and analytics so PHP conditions can be analyzed from symptom to contributing component.
Examples:
Slow User Action → PHP Transaction → Slow PHP Code
Slow Transaction → SQL → Database
Slow Transaction → Network Request → External API
Failed Transaction → Integration → Downstream Service
📊 Configure RCA Dashboards
PHP monitoring includes:
germain.apm.workspace.rcaDashboards
Configure RCA dashboards to present correlated PHP telemetry.
Useful content includes:
-
PHP transactions
-
Code execution
-
Network requests
-
SQL
-
Integration transactions
-
KPIs
-
SLAs
-
Related application context
Prefer correlated views rather than isolated technology metrics.
🔐 Configure Privacy & Exclusions
Review information captured by PHP monitoring.
Potentially sensitive information may occur in:
-
HTTP parameters
-
URLs
-
Form submissions
-
SQL
-
Session identifiers
-
User information
-
Authentication data
-
API requests
-
External-service payloads
Configure GermainUX privacy controls to:
-
Mask
-
Anonymize
-
Exclude
Collect only information required for the monitoring objective.
🔔 Configure Alerts
Configure alerts for PHP conditions requiring attention.
Examples include:
-
PHP transaction exceeds threshold
-
PHP execution becomes slow
-
SQL becomes slow
-
External API becomes slow
-
Integration failure
-
SLA violation
Configure:
-
Conditions
-
Thresholds
-
Time windows
-
Recipients
-
Escalation
⚙️ Configure Automation
PHP conditions can trigger GermainUX automation.
For example:
PHP Condition → KPI → SLA → Alert / Action
Actions can include:
-
Notifications
-
Reports
-
Scripts
-
HTTP actions
-
Operational workflows
-
Remediation actions where appropriate
📊 Configure Dashboards
Configure dashboards for PHP application monitoring.
Useful views include:
-
PHP transaction performance
-
Code execution
-
Network performance
-
SQL performance
-
Integration performance
-
Application trends
-
SLA status
-
RCA
Combine browser, PHP, database, and infrastructure telemetry where appropriate.
📄 Configure Reports
Configure automated reports for:
-
PHP transaction performance
-
PHP execution
-
SQL
-
Network requests
-
Integrations
-
SLA violations
-
Performance trends
Set the appropriate schedule and recipients.
🔧 Configure Engine & Node
Verify the GermainUX Engine responsible for PHP monitoring.
Where Engine configuration needs to be changed, use:
Germain Workspace → Left Menu → Wizards → Engine
Confirm:
-
Engine is running
-
Engine is assigned to the expected Node
-
Engine can communicate with GermainUX
-
Engine can access the required PHP environment
🔍 Verify in Germain State
Navigate to:
Germain Workspace → Germain → State
Verify the operational state of the Engine and monitoring environment.
Check that expected PHP monitoring activity is running and telemetry is being received.
🧪 Validate the Configuration
Execute representative PHP activity and verify:
-
Application association
-
Server association
-
PHP monitoring profile
-
Sampling
-
PHP Server profile
-
Agent configuration
-
PHP transactions
-
Code profiling
-
Network requests
-
SQL
-
Integrations
-
Browser correlation where deployed
-
KPIs
-
SLAs
-
Categorization
-
Stream correlation
-
RCA
-
Privacy
-
Alerts
-
Automation
-
Dashboards
-
Reports
Also verify that profiling and monitoring introduce acceptable overhead.
ℹ️ Advanced Configuration
The documented PHP monitoring configuration includes these major areas:
-
germain.apm.monitoringClient.phpMonitoringProfiles -
germain.apm.monitoringConfig.components -
germain.apm.monitoringConfig.componentTemplates -
germain.apm.monitoringConfig.serverProfiles -
germain.apm.monitoringConfig.keyPerformanceIndicators -
germain.apm.analytics.streamCorrelationScenarios -
germain.apm.workspace.rcaDashboards
Use these advanced configuration areas when the Wizard-generated defaults need to be customized.
ℹ️ Get More Information
PHP environments can vary significantly depending on storefront customization, extensions, integrations, infrastructure, and security requirements.
The GermainUX team can help configure the appropriate monitoring scope, privacy controls, analytics, alerts, and automation for your PHP environment.
Please contact us for any help.
Component: Engine, JS Profiler, RPA Bot Recorder, RUM JS
Feature Availability: 2017.1 or later