
⚙️ Configuring Monitoring for IBM WebSphere MQ with GermainUX
📊 Configure GermainUX to collect and analyze IBM WebSphere MQ queue health and performance metrics.
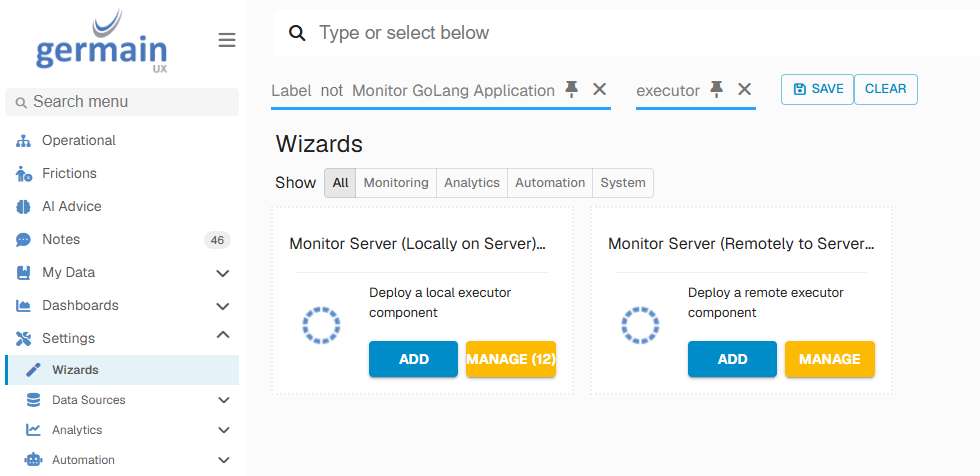
📂 1. Open the Monitor Server Wizard
Go to:
Germain Workspace > Left Menu > Setting > Wizards > Monitor Server
Create a new monitoring component.
💻 2. Select the Node and Engine
Select the GermainUX Node and Engine that will execute the MQ monitor.
Choose an Engine that:
|
Capability |
|---|
|
Can access the IBM WebSphere MQ environment |
|
Can establish the required SSH connection when using remote monitoring |
|
Has access to the required credentials |
|
Can communicate with GermainUX |
🔍 3. Select the WebSphere MQ Monitor
Select the applicable:
WebSphere MQ Monitor
Choose the appropriate monitoring configuration for your deployment.
GermainUX supports:
|
Monitor Type |
|---|
|
WebSphere MQ Monitor — Local |
|
WebSphere MQ Monitor — SSH |
🔗 4. Configure Local or Remote Monitoring
🏠 Local
Use the local monitor when the monitoring component has direct access to the IBM WebSphere MQ server.
Configure the required MQ server and monitoring information.
🛰️ SSH
Use the SSH monitor when the GermainUX Engine connects remotely to the IBM WebSphere MQ server.
Configure the required:
|
Item |
|---|
|
Server |
|
SSH connection |
|
Credentials |
|
MQ monitoring settings |
🔧 5. Configure the MQ Environment
Populate the remaining fields required by the WebSphere MQ Monitor.
Depending on the monitor configuration, identify the applicable:
|
Resource |
|---|
|
MQ server |
|
Queue manager |
|
Queue |
|
Environment |
|
Monitoring component |
Use descriptive names so the monitored MQ resources can be clearly identified in dashboards, alerts, and reports.
⏱️ 6. Configure Monitoring Frequency
Configure how frequently GermainUX should collect MQ metrics.
Choose a frequency appropriate for:
|
Consideration |
|---|
|
Queue criticality |
|
Message-processing rate |
|
Required detection time |
|
Environment |
|
Monitoring overhead |
Critical queues may require more frequent monitoring than low-volume or non-production queues.
📊 7. Configure Queue Depth Monitoring
Monitor:
WebSphere MQ Queue Depth
Queue Depth represents the number of messages currently waiting in the queue.
Use it to detect:
|
Condition |
|---|
|
Message backlog |
|
Queue congestion |
|
Unexpected increases |
|
Sustained queue growth |
⌛ 8. Configure Queue Time Monitoring
Monitor:
WebSphere MQ Queue Time
Use Queue Time to identify messages that are taking longer than expected to be processed.
Analyze Queue Time together with Queue Depth to distinguish normal workload increases from processing degradation.
⏰ 9. Configure Oldest Message Monitoring
Monitor:
WebSphere MQ Oldest Message
This KPI identifies the age of the oldest message waiting in the queue.
It can help identify:
|
Issue |
|---|
|
Stuck messages |
|
Consumer problems |
|
Processing delays |
|
Queues that are no longer draining normally |
📨 10. Configure MQ Event Monitoring — Optional
When WebSphere MQ server-log monitoring is configured, use:
WebSphere MQ Event
to analyze events detected in the MQ server logs.
Use log events together with Queue Depth, Queue Time, and Oldest Message to provide additional diagnostic context.
⚖️ 11. Configure SLAs
Configure thresholds appropriate for each queue.
Examples include:
⏱️ Queue Depth
Queue Depth > Expected Threshold
⌛ Queue Time
Queue Time > Expected Threshold
👴 Oldest Message
Oldest Message Age > Expected Threshold
Avoid applying identical thresholds to every queue.
Thresholds should reflect:
|
Factor |
|---|
|
Normal message volume |
|
Expected processing rate |
|
Queue purpose |
|
Business criticality |
|
Time sensitivity |
⚙️ 12. Configure Rules
Use GermainUX Rules to detect more meaningful combinations of MQ conditions.
Examples:
Queue Depth Increasing + Queue Time Increasing
Potential processing bottleneck.
Queue Depth Increasing + Oldest Message Increasing
Potential consumer or downstream issue.
Oldest Message Increasing Continuously
Potential stuck message.
Queue Backlog + Application Error
Potential application processing failure.
Queue Performance Degradation + Infrastructure Issue
Potential dependency or resource problem.
🔔 13. Configure Alerts and Watches
Configure notifications for MQ conditions requiring attention.
Examples:
Critical Queue Depth Above Threshold → Alert Integration Team
Oldest Message Above SLA → Notify Application Support
Queue Time Increasing → Notify MQ Operations
Sustained Queue Backlog → Trigger Diagnostic Workflow
GermainUX can trigger:
|
Action |
|---|
|
Alerts |
|
Watches |
|
Reports |
|
Approved diagnostics |
|
Approved automation |
📈 14. Configure Dashboards
IBM WebSphere MQ monitoring data is available under:
Monitoring > IT > Application > IBM > WebSphere MQ
Use dashboards to analyze:
|
Metric |
|---|
|
Queue Depth |
|
Queue Time |
|
Oldest Message |
|
MQ Events |
|
Historical trends |
|
SLA violations |
Analyze individual queues and compare behavior across monitored MQ resources.
🔗 15. Correlate MQ with Other Technologies
When GermainUX monitors related systems, correlate MQ activity with:
|
Technology |
|---|
|
Java applications |
|
Application servers |
|
Operating systems |
|
Databases |
|
APIs |
|
Network |
|
Logs |
For example:
Queue Backlog → Consumer Application Error
or:
Queue Time Increase → Downstream Database Slowdown
This can help identify the system responsible for the observed MQ condition.
✅ 16. Validate the Configuration
After configuration, verify:
-
MQ Monitor is enabled.
-
Selected Engine is online.
-
Local or SSH connectivity succeeds.
-
MQ environment is accessible.
-
Queue Depth is collected.
-
Queue Time is collected.
-
Oldest Message is collected.
-
MQ Events are available when configured.
-
Data appears in the WebSphere MQ dashboard.
-
SLAs evaluate correctly.
-
Alerts and Watches operate as expected.
 Troubleshooting
❌ No MQ Data
Verify:
|
Check |
|---|
|
Engine is online. |
|
MQ Monitor is enabled. |
|
Correct Engine is selected. |
|
MQ server is accessible. |
|
Monitoring credentials are valid. |
|
Monitoring account has sufficient permissions. |
⛔ SSH Monitor Cannot Connect
Verify:
|
Check |
|---|
|
MQ server hostname |
|
SSH port |
|
Firewall |
|
Network routing |
|
Username |
|
Authentication |
|
Monitoring permissions |
🔧 Local Monitor Does Not Collect Data
Verify:
|
Check |
|---|
|
Monitoring component is operational. |
|
MQ environment is accessible locally. |
|
Monitoring account has the required permissions. |
|
Correct MQ Monitor is configured. |
📉 Queue Metrics Are Missing
Verify:
|
Check |
|---|
|
Correct MQ environment is selected. |
|
Queue is accessible to the monitor. |
|
Monitoring component executes successfully. |
|
Required permissions are available. |
🔔 Data Appears but Alerts Do Not Trigger
Verify:
|
Check |
|---|
|
SLA is enabled. |
|
Correct KPI is selected. |
|
Threshold is appropriate. |
|
Rule conditions are satisfied. |
|
Watch or alert configuration is enabled. |
ℹ️ Get More Information
GermainUX can help determine which monitoring, analytics and automation capabilities are appropriate for your WebSphere environment.
Component: Engine, JS Profiler, Mobile App, RPA Bot Recorder, RUM JS
Feature Availability: 2015.4