
🚀 Deploy Monitoring for MuleSoft
Deploy GermainUX monitoring for MuleSoft by sending API and integration telemetry from MuleSoft to the GermainUX Data Ingestion APIs.
⚙️ Overview
This approach allows MuleSoft flows to send operational information such as request status, failures, response times, and other integration-specific telemetry to GermainUX for real-time analytics and alerting.
⚙️ Deployment Architecture
A typical deployment follows this flow:
Application → MuleSoft Flow → GermainUX Data Ingestion API → GermainUX Analytics / Alerts
MuleSoft continues to execute the integration workflow while relevant operational telemetry is transmitted to GermainUX.
1. Identify the MuleSoft APIs & Flows to Monitor
Determine which MuleSoft APIs or integration flows require monitoring.
Focus on integrations that are important to:
-
Application availability
-
Critical business workflows
-
Data exchange
-
Customer-facing transactions
-
Internal operational processes
For each flow, identify the telemetry that should be sent to GermainUX.
2. Determine the Telemetry to Send
Typical MuleSoft telemetry can include:
-
API name
-
Integration or flow name
-
Request status
-
Success / failure status
-
HTTP response code
-
Response time
-
Error details
-
Request volume
-
Throughput
-
Application-specific context
Send only the data required for the monitoring and analytics use case.
3. Obtain the GermainUX Data Ingestion Endpoint
Identify the GermainUX Data Ingestion API endpoint for your environment.
The MuleSoft runtime must be able to communicate with the GermainUX ingestion endpoint.
Use HTTPS for production communication.
4. Configure Authentication
Configure the authentication required by the GermainUX Data Ingestion API.
Store credentials securely within the MuleSoft environment using the approved secret or credential-management mechanism.
Do not hard-code production credentials directly into MuleSoft flows.
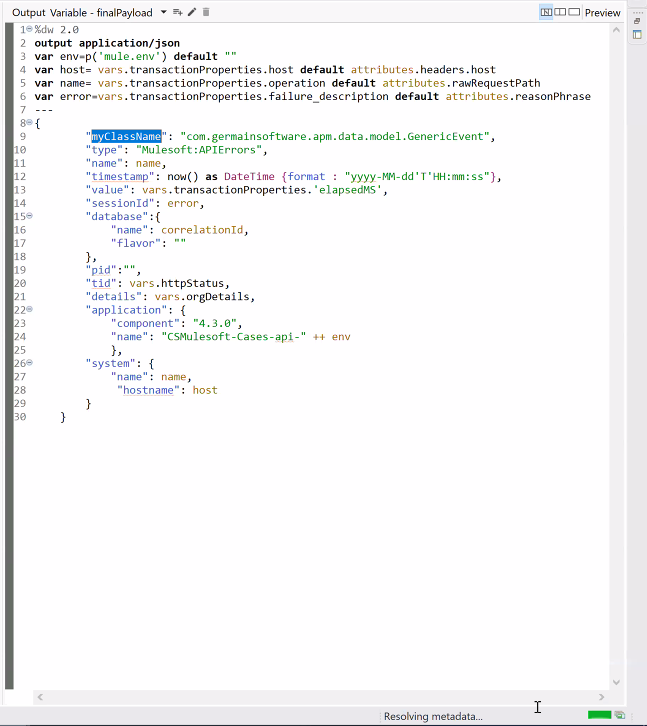
5. Add GermainUX Ingestion to the MuleSoft Flow
In MuleSoft Anypoint Studio, add the appropriate logic to send monitoring telemetry to GermainUX.
A typical flow can send telemetry after processing an API request or integration transaction.
For example:
Receive API Request → Execute Integration → Determine Status → Send Telemetry to GermainUX → Continue / Complete Flow
Send monitoring information for both successful and failed processing where operational visibility is required.
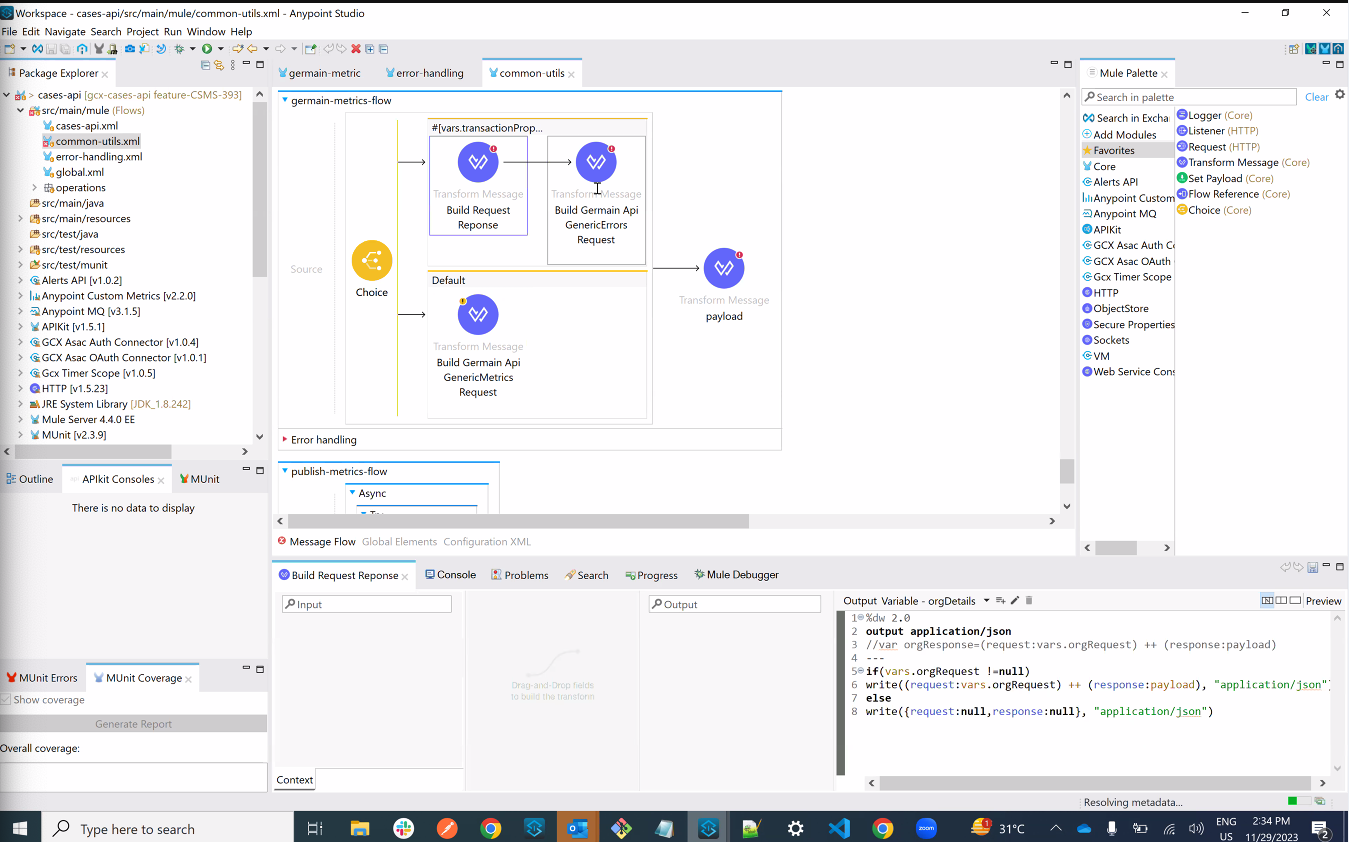
6. Capture Failure Information
Configure the MuleSoft flow to send relevant error information when processing fails.
Depending on the integration, this can include:
-
Error type
-
Error message
-
HTTP response code
-
Failed flow or operation
-
Response time
-
Downstream service
-
Application-specific context
Avoid sending sensitive payload content unless it is specifically required and approved.
7. Validate Data Ingestion
Execute representative MuleSoft transactions.
Test both:
-
Successful requests
-
Failed requests
Verify in GermainUX that:
-
Telemetry is received
-
Events are associated with the correct API or integration
-
Status values are correct
-
Response times are captured where configured
-
Error details are available when failures occur
-
Data appears in the expected analytics
8. Validate Production Behavior
Before broad production deployment, validate:
-
Connectivity to the GermainUX ingestion endpoint
-
Authentication
-
Failure handling
-
Retry behavior
-
Monitoring overhead
-
Data volume
-
Sensitive-data exclusions
The monitoring integration should not interfere with the primary MuleSoft business transaction.
🔐 Review Data Privacy
Review all telemetry sent from MuleSoft to GermainUX.
Do not send unnecessary:
-
Authentication credentials
-
Tokens
-
Personal information
-
Payment information
-
Sensitive business data
-
Full request or response payloads
Send only the operational context required for monitoring and troubleshooting.
📊 Next Steps
Once MuleSoft telemetry is successfully ingested into GermainUX:
-
Configure the monitored facts and dimensions.
-
Configure KPIs.
-
Create dashboards and reports.
-
Configure SLAs and alerts.
-
Configure automation where appropriate.
See Configure Monitoring for MuleSoft for configuration instructions.
ℹ️ Get More Information
The exact deployment depends on the MuleSoft APIs, flows, telemetry, security requirements, and GermainUX ingestion configuration used in your environment.
The GermainUX team can help determine the appropriate ingestion architecture and monitoring scope.
Please contact us for any help.
Component: Engine, JS Profiler, RPA Bot Recorder, RUM JS
Feature Availability: 2017.1 or later