
📡 Deploy Monitoring for Microsoft SQL Server
Deploy GermainUX monitoring for Microsoft SQL Server to monitor database availability, performance, queries, connections, storage, errors, and application-specific database conditions.
SQL Server monitoring is executed by the GermainUX Engine using a database connection to the monitored SQL Server instance.
🔑 1. Create a SQL Server Monitoring Account
Create or select a SQL Server database account for GermainUX monitoring.
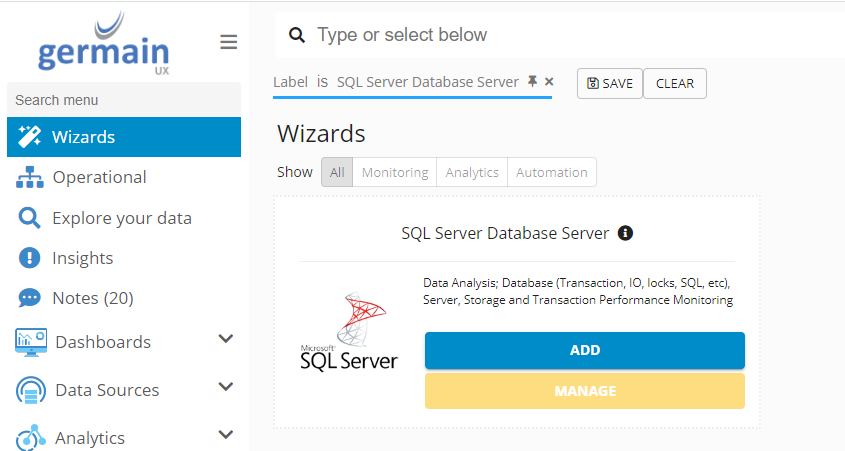
For basic monitoring of a SQL Server instance, GermainUX can use a regular database account with the appropriate connection permissions.
More comprehensive monitoring requires additional permissions to query SQL Server system views and performance information.
🔐 2. Grant SQL Server Monitoring Permissions
Grant the GermainUX monitoring account access to the SQL Server information required for monitoring.
The standard SQL Server monitoring configuration uses:
|
Table / View |
Permission |
|---|---|
|
|
SELECT |
|
|
SELECT |
The monitoring account also requires:
VIEW SERVER STATE
Example:
USE master;
GRANT SELECT ON sys.dm_os_performance_counters TO [germain-user];
GRANT SELECT ON sys.dm_exec_sessions TO [germain-user];
GRANT VIEW SERVER STATE TO [germain-user];
These permissions provide access to SQL Server system information used by GermainUX monitoring.
Additional permissions can be granted when GermainUX needs to monitor other SQL Server system views, tables, or application data.
Apply the minimum permissions appropriate for the monitoring requirements of your environment.
🔑 3. Add the Database Credentials
In Germain Workspace, configure the credentials used to connect to SQL Server.
Navigate to:
Left Menu → Settings -> Data Sources → Credentials
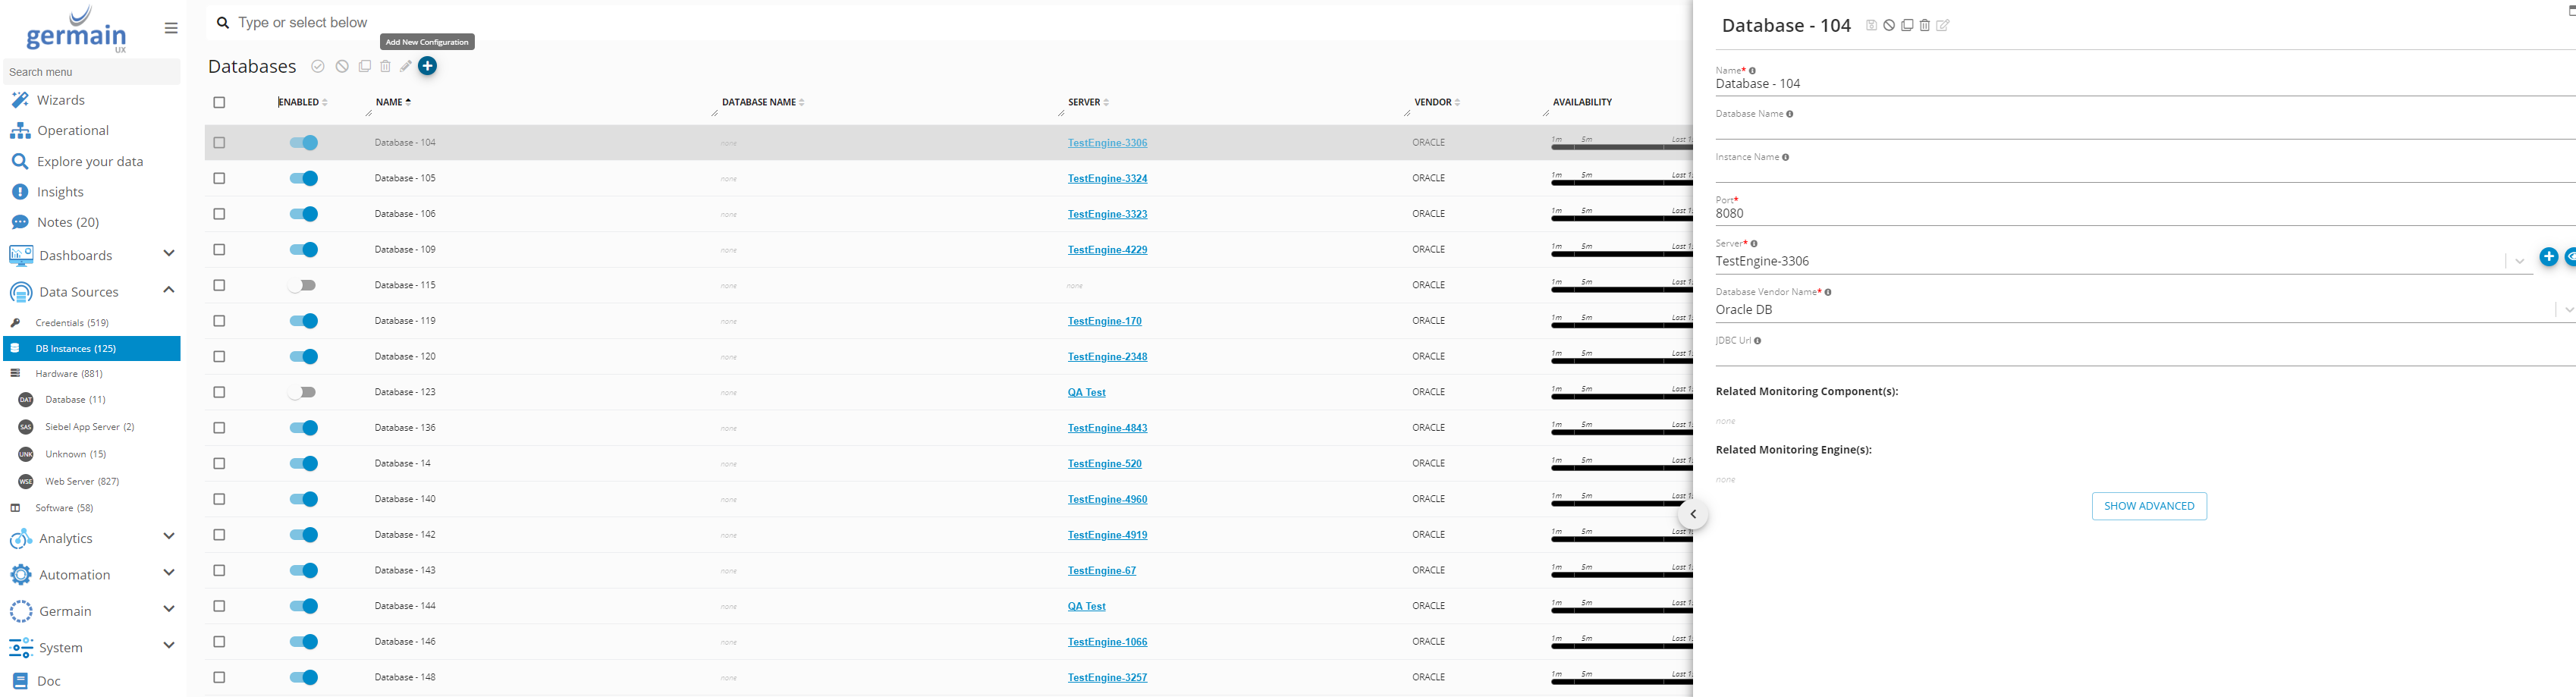
Add the SQL Server monitoring credentials.
These credentials will be referenced by the database data source used by the GermainUX Engine.
🗄️ 4. Add SQL Server as a Data Source
Navigate to:
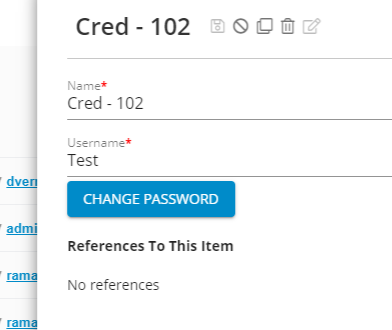
Germain Workspace → Left Menu → Data Sources → Database → Add New Configuration
Configure the connection to the SQL Server instance.
Enter the database connection information required for your environment and associate the appropriate credentials.
🔍 5. Validate Database Connectivity
Verify that the GermainUX Engine can connect to the SQL Server instance using the configured data source and credentials.
Confirm that the monitoring account can access the SQL Server system views required for the monitoring capabilities you intend to enable.
Resolve connectivity, authentication, or permission issues before configuring individual monitors.
⚙️ 6. Configure the Monitoring Node & Engine
SQL Server monitoring runs from a GermainUX Engine.
When deploying a monitor, select:
Monitoring Node
The GermainUX Node from which the Engine operates.
Engine
The GermainUX Engine that will execute the SQL Server monitor.
Ensure that the selected Engine has network connectivity to the SQL Server instance.
⏱️ 7. Configure the Monitoring Schedule
Define how frequently the SQL Server monitor should execute.
Choose a monitoring frequency appropriate for:
-
The SQL Server metric or condition being monitored
-
Operational requirements
-
Required detection speed
-
Database workload
-
Query cost
Higher-frequency monitoring should be used selectively for conditions requiring rapid detection.
✅ 8. Validate the Deployment
After deployment, verify that SQL Server monitoring is operational.
Confirm that:
-
GermainUX can connect to SQL Server
-
Credentials are valid
-
Required permissions are available
-
The selected Engine can execute the monitor
-
Monitoring executes according to schedule
-
SQL Server telemetry is received by GermainUX
Verify the deployed monitor in Germain State.
📊 Next Steps
Once the SQL Server connection and Engine monitoring are operational, configure the database metrics and conditions relevant to your environment.
For example:
-
Query performance
-
SQL Server performance counters
-
Database connections
-
Storage utilization
-
Backup status
-
Errors
-
Custom SQL queries
-
Application-specific database KPIs
-
SLAs and alerts
See Configure Monitoring for Microsoft SQL Server for instructions.
ℹ️ Get More Information
The database permissions required by GermainUX depend on the SQL Server information and application data you choose to monitor.
Additional tables, views, and custom SQL queries can be monitored when the appropriate permissions are granted to the GermainUX monitoring account.
Please contact us for any help.
Component: Engine, JS Profiler, RPA Bot Recorder, RUM JS
Feature Availability: 2017.1 or later