
🚀 Deploy Monitoring for Microsoft Power BI
Deploy GermainUX monitoring for Microsoft Power BI to capture user experience, Session Replay, application performance, errors, and user interactions.
GermainUX provides two primary deployment approaches for monitoring the Power BI browser experience:
-
RUM JS
-
RUM Browser Extension
Select the deployment method appropriate for your Power BI environment and access requirements.
⚙️ Monitoring Options
|
Power BI Access Point |
GermainUX Monitoring |
|---|---|
|
Browser / User Interface |
Real User Monitoring, Session Replay, user activity, errors, and performance via RUM JS |
|
Browser without direct JavaScript injection |
Real User Monitoring via RUM Browser Extension |
|
JavaScript |
Advanced JavaScript troubleshooting and profiling via JS Profiler |
|
Synthetic User Journeys |
Proactive workflow and availability monitoring via RPA Bot Recorder |
|
Supporting Systems |
Additional observability, analytics, and automation via Engine |
Option 1 — Deploy RUM JS
Use GermainUX RUM JS when JavaScript can be deployed within the web application used to access Power BI.
🚀 1. Start the RUM JS Wizard
From Germain Workspace, navigate to:
Left Menu → Wizards → Standard HTML
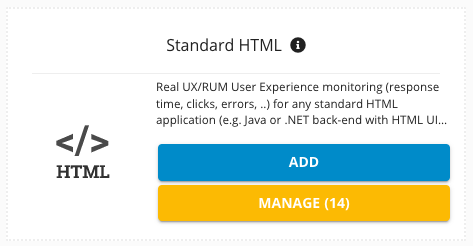
Use the Wizard to create the monitoring profile and generate the GermainUX RUM JS deployment instructions.
🏷️ 2. Configure the Application
Configure the Power BI application you want to monitor.
Define the appropriate:
-
Application Name
-
Application URL
-
UX Monitoring Profile
The monitoring profile identifies the Power BI application within GermainUX analytics, Session Replay, dashboards, reports, and alerts.
📦 3. Deploy RUM JS
Download or copy the RUM JS configuration generated by the Wizard.
Inject the GermainUX RUM JS scripts into the web application or template through which Power BI is accessed.
The deployment must allow the GermainUX JavaScript to execute within the user's browser and communicate with the GermainUX environment.
✅ 4. Validate RUM JS
Open the monitored Power BI application and perform a representative user journey.
For example:
Open Power BI → Open Dashboard → Load Report → Interact with Visualization
Verify in GermainUX that:
-
The user session is captured
-
User interactions are visible
-
Session Replay is available
-
Performance telemetry is received
-
Browser and JavaScript errors are captured
-
Network activity is monitored
-
The session is associated with the correct application
Option 2 — Deploy the RUM Browser Extension
Use the GermainUX RUM Browser Extension when monitoring through direct RUM JS injection is not appropriate or available.
The GermainUX browser extension supports monitored browser environments including Chrome, Edge, and Firefox.
🚀 1. Install the Browser Extension
Install the appropriate GermainUX RUM Browser Extension on the browsers used to access the monitored Power BI application.
⚙️ 2. Configure the GermainUX Instance
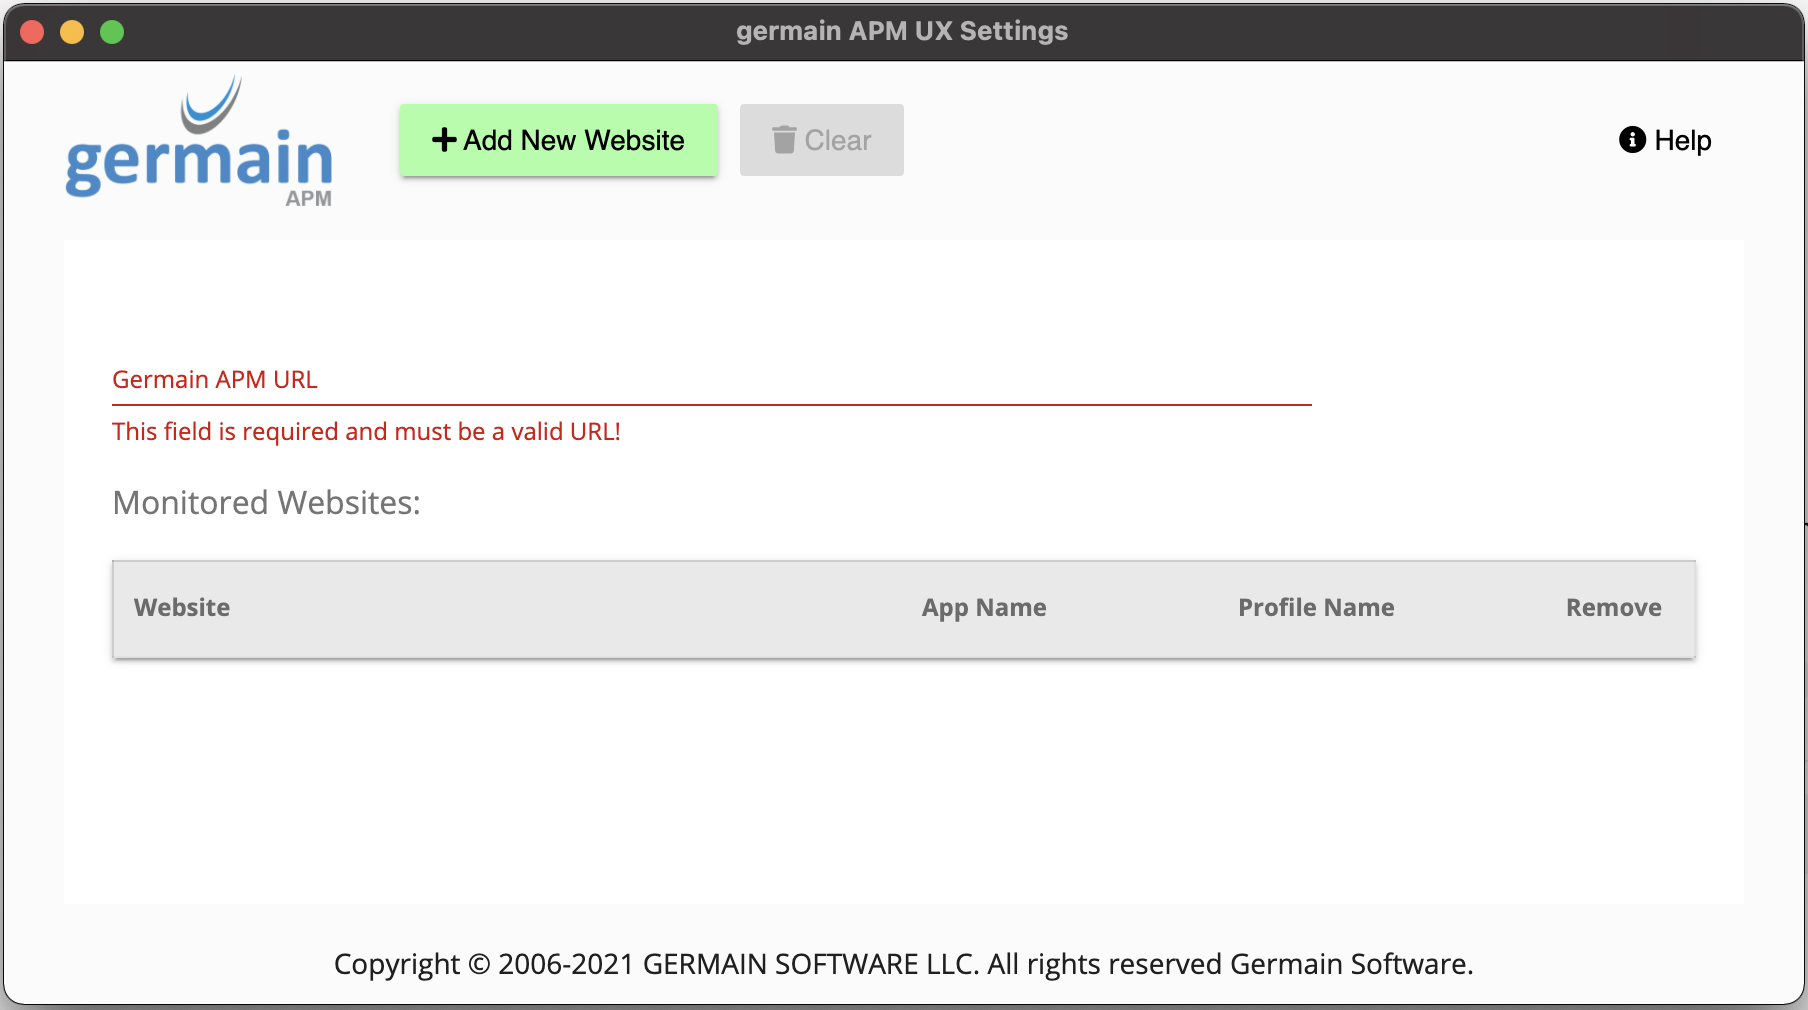
Open the extension configuration and specify:
Germain URL
Enter the base URL of your GermainUX environment.
This tells the browser extension where monitored telemetry should be sent.
🌐 3. Add the Power BI Website
Click:
Add New Website
Configure:
Website URL
The base URL of the website containing the Power BI application you want to monitor.
Application Name
The application name that will identify the Power BI application within GermainUX.
Profile Name
The corresponding UX Monitoring Profile configured in GermainUX.
The Profile Name in the browser extension must correspond to the monitoring profile configured in GermainUX.
🔄 4. Refresh Power BI
After configuring the extension, refresh the Power BI page.
The browser extension will begin monitoring the configured application.
✅ 5. Validate Browser Extension Monitoring
Perform a representative Power BI user journey.
For example:
Open Power BI → Navigate → Open Report → Interact with Dashboard
Verify that the expected user-experience telemetry is received by GermainUX and associated with the correct application and monitoring profile.
🚀 Enable Advanced JavaScript Analysis — Optional
Deploy the GermainUX JS Profiler when deeper browser-side performance diagnostics are required.
Use JavaScript profiling when Real User Monitoring identifies an issue requiring deeper analysis of JavaScript execution.
🤖 Configure Synthetic Monitoring — Optional
Use the GermainUX RPA Bot Recorder to proactively monitor critical Power BI user journeys.
For example:
Launch Power BI → Authenticate → Open Report → Execute Interaction → Validate Result
Synthetic monitoring can continuously validate availability, performance, and critical Power BI workflows.
🔐 Review Data Privacy
Before enabling production monitoring, review the information captured from Power BI users.
Configure appropriate privacy controls for:
-
User information
-
Authentication information
-
Business data
-
Report content
-
Dashboard content
-
Sensitive application information
Validate the appropriate masking and exclusion controls before enabling production monitoring.
📊 Next Steps
Once Power BI monitoring is deployed:
-
Configure the UX Monitoring Profile.
-
Configure privacy and exclusions.
-
Configure Power BI-specific monitoring rules.
-
Configure dashboards and reports.
-
Configure alerts and SLA thresholds.
-
Customize RCA and tracing where required.
-
Configure automation.
See Configure Monitoring for Microsoft Power BI for configuration instructions.
ℹ️ Get More Information
The appropriate deployment method depends on how Power BI is accessed and whether RUM JS can be deployed within the monitored web environment.
The GermainUX team can help determine and configure the appropriate deployment method for your Power BI environment.
ℹ️ Get More Information
Magento environments can vary significantly depending on storefront customization, extensions, integrations, infrastructure, and security requirements.
The GermainUX team can help configure the appropriate monitoring scope, privacy controls, analytics, alerts, and automation for your Magento environment.
Please contact us for any help.
Component: Engine, JS Profiler, RPA Bot Recorder, RUM JS
Feature Availability: 2017.1 or later