
📡 Deploy Network Monitoring
Deploy GermainUX network monitoring to detect connectivity and performance conditions affecting applications, servers, and users.
GermainUX provides two network-monitoring approaches:
|
Monitoring Scope |
GermainUX Component |
|---|---|
|
Server-to-Server / Infrastructure Network |
Engine |
|
Actual User Network Experience |
RUM JS or RUM Browser Extension |
Both approaches can be used together.
🖥️ Option 1 — Deploy Engine-Based Network Monitoring
Use the GermainUX Engine to monitor connectivity and network performance between a monitoring source and a target server.
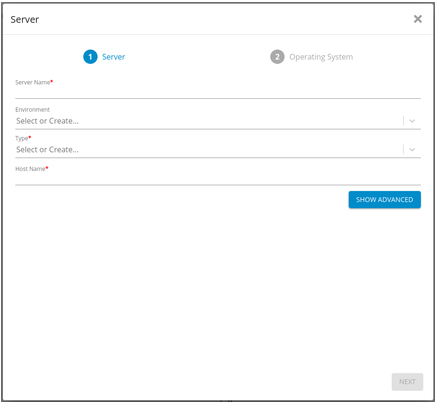
1. Create the Target Server
In Germain Workspace, navigate to:
Left Menu → Data Sources → Add Server
Create the server that GermainUX should monitor.
Configure the information required to identify and reach the target server.
2. Start the Network Monitor Wizard
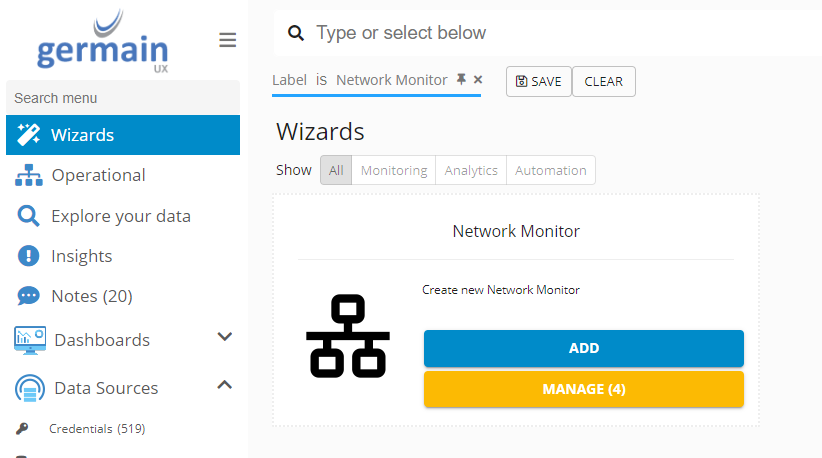
Navigate to:
Germain Workspace → Left Menu → Wizards → Network Monitor
The Wizard guides you through deployment of the network monitor.
3. Select the Source Server
Select:
Source Server
This identifies the server from which the network monitoring component will execute.
The source should have the required network connectivity to the target server.
4. Select the Target Server
Select the target server created previously.
The monitor will measure network connectivity and performance between the selected source and target.
5. Name the Monitor
Enter a descriptive Monitor Name or use the default.
Use a name that clearly identifies the monitored network path.
For example:
Network - App Server to API Server
or:
Network - Engine to Production Web Server
6. Select the Monitoring Node & Engine
Select:
Monitoring Node
and:
Engine
The selected Engine will execute the Network Monitor.
7. Configure the Schedule
Define how frequently the Network Monitor should execute.
Choose a frequency appropriate for:
-
Required detection speed
-
Network criticality
-
Target importance
-
Operational requirements
Critical network paths may require more frequent monitoring than non-critical systems.
8. Configure SSH Credentials — If Required
If the monitoring component executes through SSH, configure the required SSH credentials.
Use credentials with only the permissions required for the monitoring operation.
9. Complete Deployment
Complete the Network Monitor Wizard.
After deployment, verify that the Engine can reach the target and that network telemetry is being collected.
👤 Option 2 — Deploy User-Side Network Monitoring
GermainUX can also monitor network conditions experienced by actual users.
This capability works with:
-
GermainUX RUM JS
-
GermainUX RUM Browser Extension
If RUM monitoring is already deployed for the application, no separate infrastructure Network Monitor is required to collect supported browser-side network information.
1. Deploy RUM
Deploy GermainUX RUM JS or Browser Extension using the deployment method appropriate for the monitored application.
Verify that user sessions and browser telemetry are successfully received by GermainUX.
2. Select the UX Monitoring Profile
Navigate to:
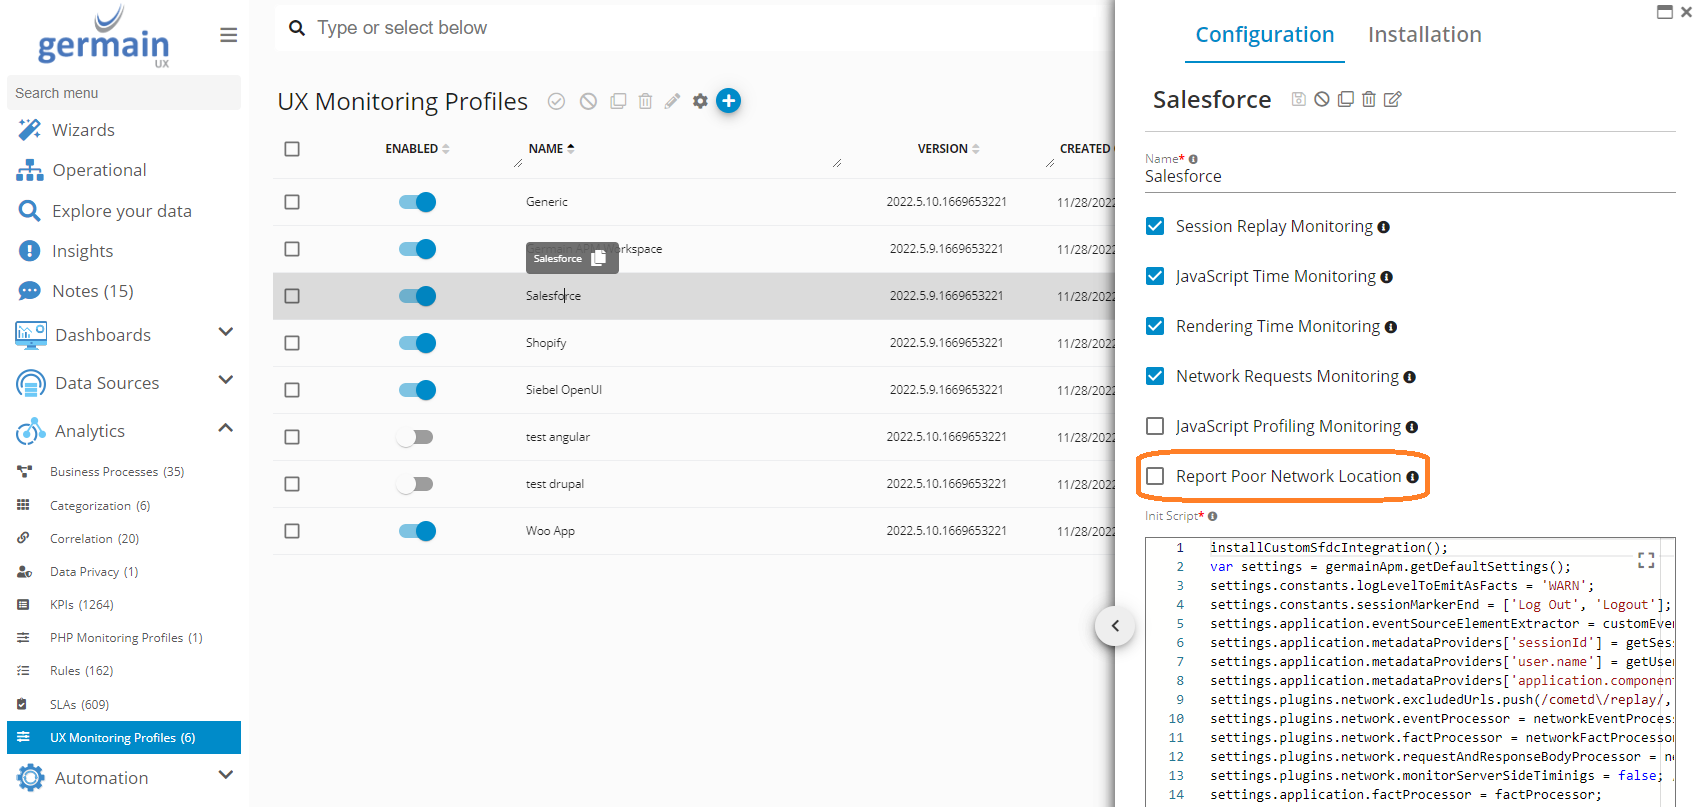
Germain Workspace → Analytics → UX Monitoring Profiles
Select the profile associated with the application.
The profile controls user-side monitoring for the application.
3. Enable Poor Network Location Reporting
Enable:
Report Poor Network Location
This allows GermainUX to report poor network conditions detected from monitored browsers.
4. Validate User-Side Network Monitoring
Access the application from a monitored browser and perform representative user activity.
Verify that GermainUX receives the expected network telemetry and associates it with the correct user session and application.
✅ Validate Deployment
After deployment, verify the monitoring approach appropriate for your environment.
Engine-Based
Confirm that:
-
Source server is correct
-
Target server is reachable
-
Monitoring Node and Engine are correct
-
Monitor executes according to schedule
-
Network response data is received
RUM-Based
Confirm that:
-
RUM is active
-
The correct UX Monitoring Profile is used
-
Network telemetry is received
-
Poor network conditions are detected when applicable
-
Network information is correlated with user sessions
📊 Next Steps
Once network monitoring is operational, configure:
-
Response-time thresholds
-
Poor network grades
-
SLA conditions
-
Dashboards
-
Alerts
-
Automation
See Configure Network Monitoring for configuration instructions.
ℹ️ Advanced Configuration
Network monitoring can be extended by creating multiple Network Monitors for different source-to-target paths and combining the resulting telemetry with application, infrastructure, and user-experience monitoring.
For user-side monitoring, advanced RUM configuration can be used to adjust the effective network grades considered poor according to the performance requirements of the application.
Please contact us for any help.
Component: Engine, RUM JS, RUM Extension
Feature Availability: 2017.1 or later