
⚙️ Configure Monitoring for MySQL
Configure GermainUX monitoring for MySQL to execute database queries, collect custom metrics, create KPIs, define SLAs, configure alerts, and monitor application-specific database conditions.
This guide assumes that the MySQL data source, credentials, and GermainUX Engine have already been deployed.
🔍 Configure a Database Query Monitor
Navigate to:
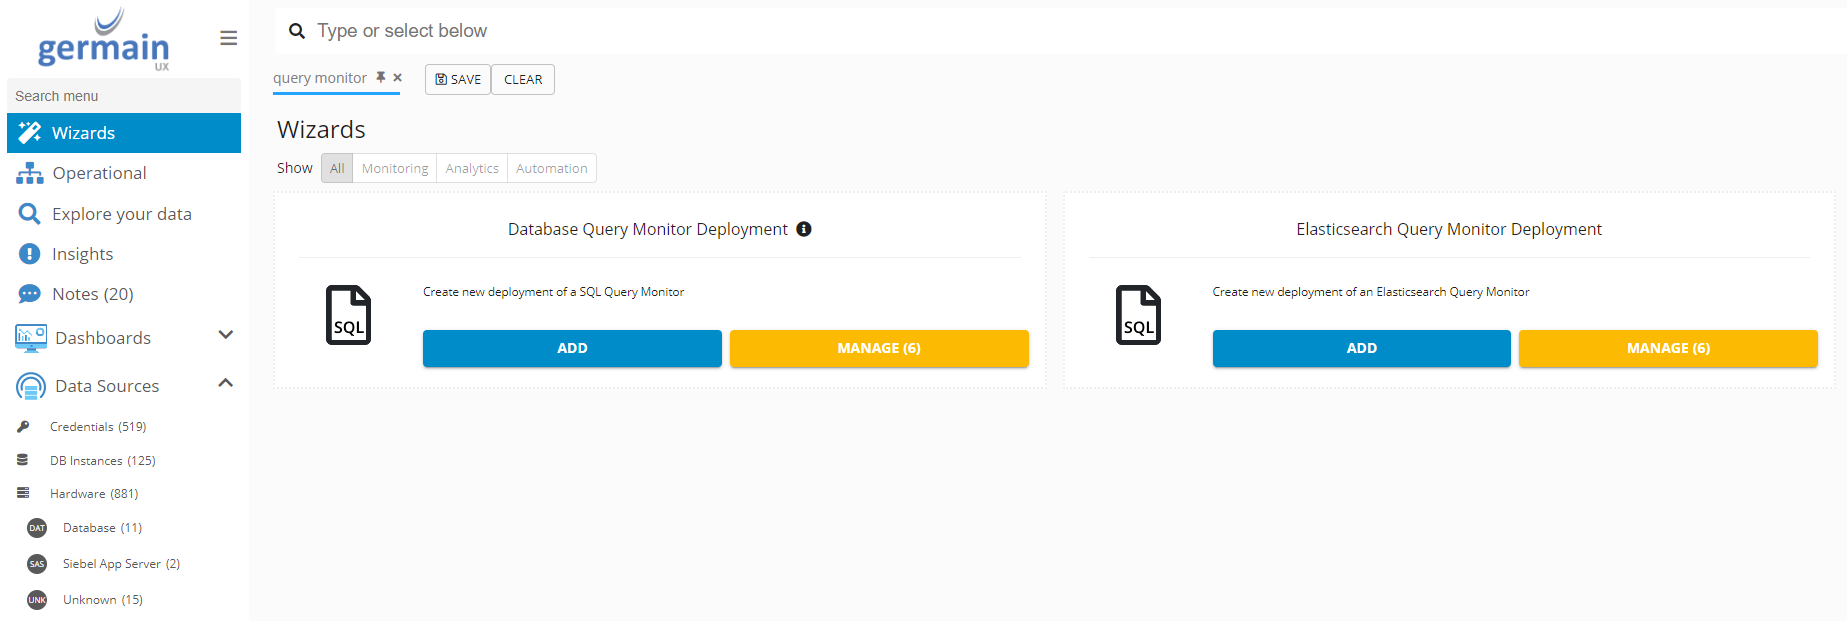
Germain Workspace → Left Menu → Wizards → Database Query Monitor Deployment
Use the Wizard to create a Query Monitor for MySQL.
A Database Query Monitor executes a configured SQL query according to a schedule and processes the returned information for GermainUX analytics and monitoring.
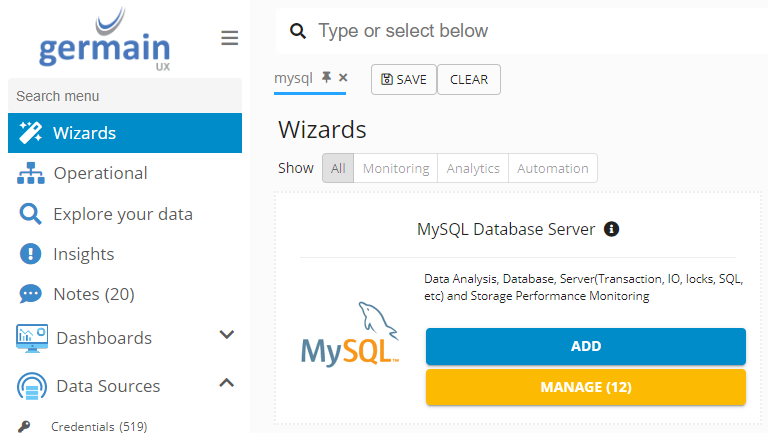
🗄️ Select the MySQL Data Source
Select the MySQL database connection configured during deployment.
Verify that the selected data source:
-
Connects to the correct MySQL instance
-
Uses the appropriate credentials
-
Points to the required database
-
Has permission to execute the monitoring query
✏️ Configure the SQL Query
Enter the SQL query GermainUX should execute.
Queries can retrieve information from:
-
MySQL system tables
-
Performance-related tables
-
Application tables
-
Business data
-
Other tables accessible by the monitoring account
This allows GermainUX monitoring to be customized for the requirements of each MySQL environment.
Examples include monitoring:
-
Database performance
-
Active connections
-
Storage conditions
-
Application processing states
-
Queue depth
-
Transaction counts
-
Failed operations
-
Custom operational metrics
🏆 Configure the KPI
Define the KPI associated with the information returned by the Query Monitor.
The KPI determines how the monitored data is represented and analyzed within GermainUX.
Examples include:
-
Query Response Time
-
Active Connections
-
Storage Utilization
-
Backup Status
-
Transaction Count
-
Failure Count
-
Application-Specific Database Condition
Use clear KPI names that identify what is being monitored.
📏 Configure the SLA
Create an SLA when the KPI should be evaluated against an expected condition or threshold.
For database KPIs, select:
Fact-based SLA
Define the condition that determines whether the monitored KPI is operating normally or requires attention.
For example:
Active Connections > Threshold
Available Storage < Threshold
Query Response Time > Threshold
Failed Transactions > 0
🔔 Configure Actions
Select the actions GermainUX should execute when an SLA condition is met.
Depending on your GermainUX configuration, actions can include:
-
Alerts
-
Reports
-
Scripts
-
Other configured operational actions
The monitoring flow becomes:
SQL Query → KPI → SLA → Alert / Report / Script
🔧 Select the Monitoring Node & Engine
Configure where the Query Monitor will execute.
Select:
Monitoring Node
The GermainUX Node from which the Engine operates.
Engine
The GermainUX Engine that will execute the monitor.
The selected Engine must have connectivity to the MySQL instance.
⏱️ Configure the Schedule
Define how frequently GermainUX should execute the SQL query.
Choose the schedule according to:
-
Required detection speed
-
How frequently the underlying data changes
-
Operational importance
-
Database workload
-
Query execution cost
Avoid unnecessarily frequent execution of resource-intensive queries.
✅ Verify the Monitor
After deploying the Query Monitor, locate it in:
Germain State
Confirm that:
-
The monitor is running
-
MySQL connectivity is successful
-
The query executes successfully
-
Data is being collected
-
The KPI receives the expected values
-
SLA evaluation operates as expected
📈 Configure MySQL Performance Monitoring
Create monitors and KPIs for the MySQL performance information required by your environment.
Depending on available system information, analyze conditions such as:
-
Database performance
-
CPU-related resource usage
-
Memory utilization
-
Disk I/O
-
Network activity
Choose only the telemetry relevant to the MySQL deployment and supporting infrastructure.
⏳ Configure Query Performance Monitoring
Configure monitoring for queries important to application performance.
Analyze conditions such as:
-
Query execution time
-
Slow-running queries
-
Execution plans
-
Index usage
-
Query-performance trends
Create KPIs and SLAs for query conditions requiring proactive detection.
🔗 Configure Connection Monitoring
Monitor database connection activity to identify conditions such as:
-
Excessive active connections
-
Unexpected connection growth
-
Connection utilization
-
Potential connection leaks
Configure thresholds according to the expected workload of the MySQL environment.
💽 Configure Storage Monitoring
Configure monitoring for database and tablespace storage.
Monitor conditions such as:
-
Disk utilization
-
Tablespace utilization
-
Available capacity
-
Data-storage growth
-
Log-storage capacity
Configure alerts before storage reaches levels that could affect database operation.
🛡️ Configure Backup Monitoring
Configure database queries and KPIs to monitor backup activity.
Monitor conditions such as:
-
Backup completion
-
Backup failure
-
Last successful backup
-
Backup frequency
-
Recovery-related information
Define SLAs and alerts according to your organization's backup and recovery requirements.
🚨 Configure Error & Event Monitoring
Configure monitoring for MySQL errors, warnings, or other database conditions requiring attention.
Error and event monitoring can be combined with:
-
KPIs
-
SLAs
-
Alerts
-
Reports
-
Scripts
Focus alerts on conditions requiring operational action rather than every informational database event.
🔍 Configure Application-Specific Database Monitoring
GermainUX can monitor MySQL tables beyond standard system tables.
This allows monitoring to be extended to application-specific and business conditions.
For example:
Application Table → SQL Query → KPI → SLA → Alert / Action
This can be used to monitor:
-
Processing states
-
Transactions
-
Queues
-
Failures
-
Volumes
-
Business conditions
-
Other application-specific information stored in MySQL
Grant the GermainUX database account only the access required for the selected data.
📊 Configure Dashboards & Reports
Use the MySQL telemetry collected by GermainUX to create real-time dashboards and automated reports.
Examples include:
-
MySQL health
-
Availability
-
Query performance
-
Connections
-
Storage
-
Backups
-
Errors
-
Custom KPIs
-
SLA status
-
Historical trends
Where appropriate, combine MySQL telemetry with application and infrastructure data for broader operational context.
🧪 Validate the Configuration
After configuring MySQL monitoring, verify that:
-
Queries execute successfully
-
Expected data is collected
-
KPIs are populated
-
SLA conditions evaluate correctly
-
Alerts and actions trigger as expected
-
Monitoring executes according to schedule
-
Query execution does not create unnecessary database load
Adjust queries, schedules, KPIs, and thresholds according to the behavior of your environment.
ℹ️ Advanced Configuration
GermainUX MySQL monitoring can be extended by creating additional Database Query Monitors for system tables, application tables, and other accessible database information.
This allows organizations to build MySQL monitoring specific to their applications while using GermainUX analytics, SLAs, alerts, reports, and automation to operationalize the collected data.
Please contact us for any help.
Component: Engine, JS Profiler, RPA Bot Recorder, RUM JS
Feature Availability: 2017.1 or later