
⚙️ Configuring Monitoring and Alerts for TIBCO with GermainUX
Configure GermainUX to collect and analyze JMX metrics and TIBCO Spotfire logs.
🔧 Configure TIBCO JMX Monitoring
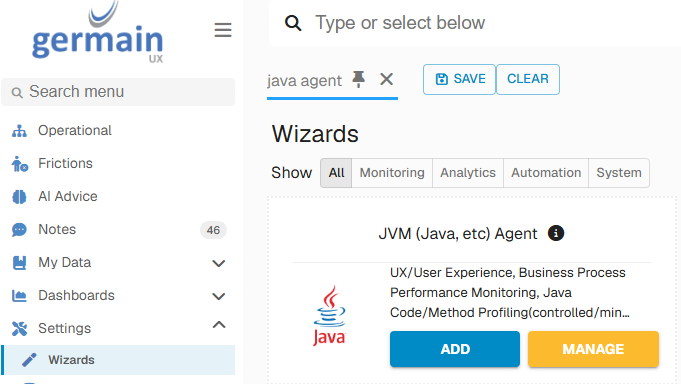
📂 1. Open the JVM Wizard
Go to:
Germain Workspace -> Left Menu -> Settings --> Wizards -> JVM
Use the JVM Wizard to deploy the JMX monitoring component.
💻 2. Select the Node and Engine
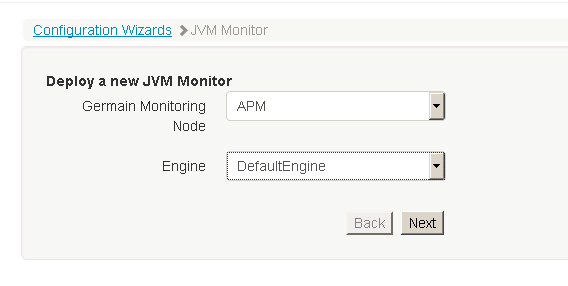
Select the GermainUX node and Engine that will execute the monitor.
Choose an Engine that:
|
Requirement |
|
|---|---|
|
1 |
Can reach the TIBCO server |
|
2 |
Can connect to the JMX endpoint |
|
3 |
Has access to the required credentials |
|
4 |
Can communicate with GermainUX |
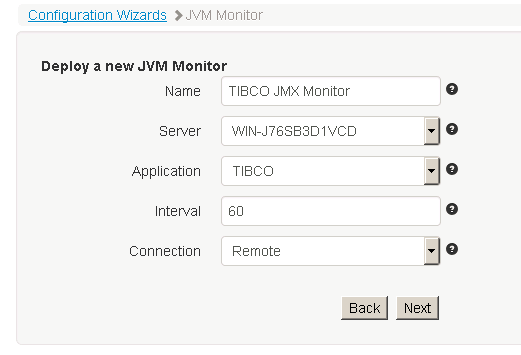
🎯 3. Select the Target
Select the:
|
Item |
|---|
|
Target server |
|
Application |
|
Connection type |
Make sure the selected application and environment correctly identify the monitored TIBCO instance.
🔗 4. Configure the JMX Connection
Specify the JMX target URL.
When the connection is secured, configure the required credentials.
Verify:
|
Item |
|---|
|
Host |
|
Port |
|
JMX URL |
|
Authentication |
|
Credentials |
|
Network access |
🔬 5. Configure Java Profiling — Optional
If GermainUX Java Profiler will also be used, configure the applicable profiling thresholds.
Profiling should be enabled only when the additional Java execution detail is required.
✅ 6. Review and Submit
Review the JMX monitoring configuration.
Confirm:
|
Configuration Item |
|---|
|
Node |
|
Engine |
|
Server |
|
Application |
|
Connection type |
|
JMX target URL |
|
Credentials |
|
Profiling configuration |
Submit the configuration.
📃 Configure TIBCO Spotfire Log Monitoring
TIBCO Spotfire monitoring uses dedicated log parsers and a directory monitor.
Configure the parsers required for the Spotfire logs available in your environment.
📜 Spotfire Action Log
Deploy the:
Spotfire Action Log Parser
Select:
|
Item |
|---|
|
Parser type |
|
Application |
Review and submit the configuration.
🚤 Spotfire Performance Log
Deploy the:
Spotfire Performance Log Parser
Select:
|
Item |
|---|
|
Parser type |
|
Application |
Review and submit the configuration.
🖥️ Spotfire Server Log
Deploy the:
Spotfire Server Log Parser
Select:
|
Item |
|---|
|
Parser type |
|
Application |
Review and submit the configuration.
📁 Configure the Spotfire Log Directory Monitor
After configuring the required parsers, deploy the:
TIBCO Spotfire Log Directory Monitor
Configure:
|
Item |
|---|
|
Directory monitor type |
|
Target log directory |
|
Appropriate Engine |
|
Application/environment |
Review and submit the configuration.
The Engine monitors the configured directory and processes supported Spotfire log files using the applicable parsers.
📊 Configure KPIs
Configure the KPIs required for your TIBCO monitoring use cases.
Depending on the monitoring source and TIBCO component, these can include KPIs for:
|
KPI |
|---|
|
Availability |
|
Performance |
|
JVM |
|
Memory |
|
Garbage collection |
|
Threads |
|
Transactions |
|
Errors |
|
Exceptions |
|
Logs |
|
Resource utilization |
Use the KPIs available for the selected GermainUX monitoring component.
⏰ Configure SLAs
Configure SLA thresholds for conditions requiring attention.
Examples include:
🚫 Availability
TIBCO Component = Unavailable
🔌 JMX
JMX Connection = Unavailable
⚡ Performance
Response Time -> Expected Threshold
💾 JVM Memory
Memory Usage -> Expected Threshold
 Errors
Error Count -> Expected Threshold
📈 Transactions
Transaction Failure Rate -> Expected Threshold
Use thresholds appropriate for each application and environment.
🧠 Configure Rules
Use GermainUX Rules for more advanced conditions.
Examples include:
|
Rule |
|---|
|
JVM Memory Increase + Performance Degradation |
|
Repeated TIBCO Errors + Transaction Failures |
|
Spotfire Log Error + Application Availability Issue |
|
Resource Saturation + Increased Response Time |
Rules can correlate TIBCO telemetry with other monitoring data available in GermainUX.
🔔 Configure Alerts and Watches
Configure notifications for conditions requiring attention.
Examples:
|
Trigger |
Action |
|---|---|
|
TIBCO Component Unavailable |
Alert Application Support |
|
JMX Connection Lost |
Alert Operations |
|
Critical Spotfire Error Detected |
Notify Spotfire Support |
|
Transaction Failures Above Threshold |
Notify Integration Team |
GermainUX can trigger alerts, Watches, reports, diagnostics, or approved automation.
📊 Configure Dashboards
Create dashboards according to the monitored TIBCO environment.
⚙️ TIBCO Operations
Monitor:
|
Area |
|---|
|
Availability |
|
Performance |
|
Errors |
|
Transactions |
|
SLA violations |
🏭 JVM
Monitor:
|
Item |
|---|
|
JVM health |
|
Memory |
|
Garbage collection |
|
Threads |
|
JMX metrics |
📉 TIBCO Spotfire
Monitor:
|
Item |
|---|
|
Action-log events |
|
Performance-log events |
|
Server-log events |
|
Errors |
|
Performance |
|
Historical trends |
🔗 Infrastructure
Correlate TIBCO telemetry with:
|
Resource |
|---|
|
CPU |
|
Memory |
|
Disk |
|
Network |
|
Database |
|
Operating system |
✅ Validate JMX Monitoring
After configuration, verify:
-
JMX monitor executes.
-
Connection succeeds.
-
Authentication succeeds.
-
JMX metrics are collected.
-
KPIs appear in GermainUX.
-
Expected values are populated.
-
SLA status is evaluated.
🔍 Validate Spotfire Log Monitoring
Generate or locate known Spotfire activity.
Verify:
-
Log files are generated.
-
Directory Monitor detects the files.
-
Correct parser processes each log type.
-
Events are generated in GermainUX.
-
Application and environment are correct.
-
Expected fields are populated.
-
Errors can be searched and analyzed.
🛠️ Troubleshooting
❓ No JMX Data
Verify:
|
Check |
|---|
|
Engine is running. |
|
JMX monitoring component is enabled. |
|
Target server is reachable. |
|
JMX port is reachable. |
|
JMX URL is correct. |
|
Credentials are valid. |
|
Required JMX metrics are exposed. |
❌ JMX Connection Fails
Verify:
|
Check |
|---|
|
Host |
|
Port |
|
Firewall |
|
Network routing |
|
JMX configuration |
|
Authentication |
|
Credentials |
|
TLS/security requirements |
⛔ Spotfire Logs Are Not Collected
Verify:
|
Check |
|---|
|
Spotfire is generating the expected logs. |
|
Log directory is correct. |
|
Engine can access the directory. |
|
Monitoring account has read permission. |
|
Directory Monitor is enabled. |
|
Correct parser is configured. |
|
Parser is associated with the correct application. |
✨ Some Spotfire Events Are Missing
Verify that the appropriate parser is deployed for the relevant log type:
|
Log Type |
|---|
|
Action |
|
Performance |
|
Server |
Review the source log to confirm that the expected event was actually written.
ℹ️ Get More Information
GermainUX can help determine which monitoring, analytics and automation capabilities are appropriate for your Tibco environment.
Feature Availability: 2017.2