
⚙️ Deploy Linux Monitoring
Deploy Linux monitoring with the GermainUX Engine to continuously monitor the availability, health, and performance of Linux servers.
GermainUX supports both local and remote Linux monitoring.
🚀 Configure via GermainUX Wizard
From GermainUX Workspace, navigate to:
Left Menu → Wizards → Monitor Server
Choose whether the Linux server will be monitored locally or remotely.
🖥️ Local Linux Monitoring
Use local monitoring when GermainUX is running on the Linux server being monitored.
1. Select the Monitor
Under Component Type, search for:
OS Monitor - Local
Select the appropriate Linux OS Monitor.
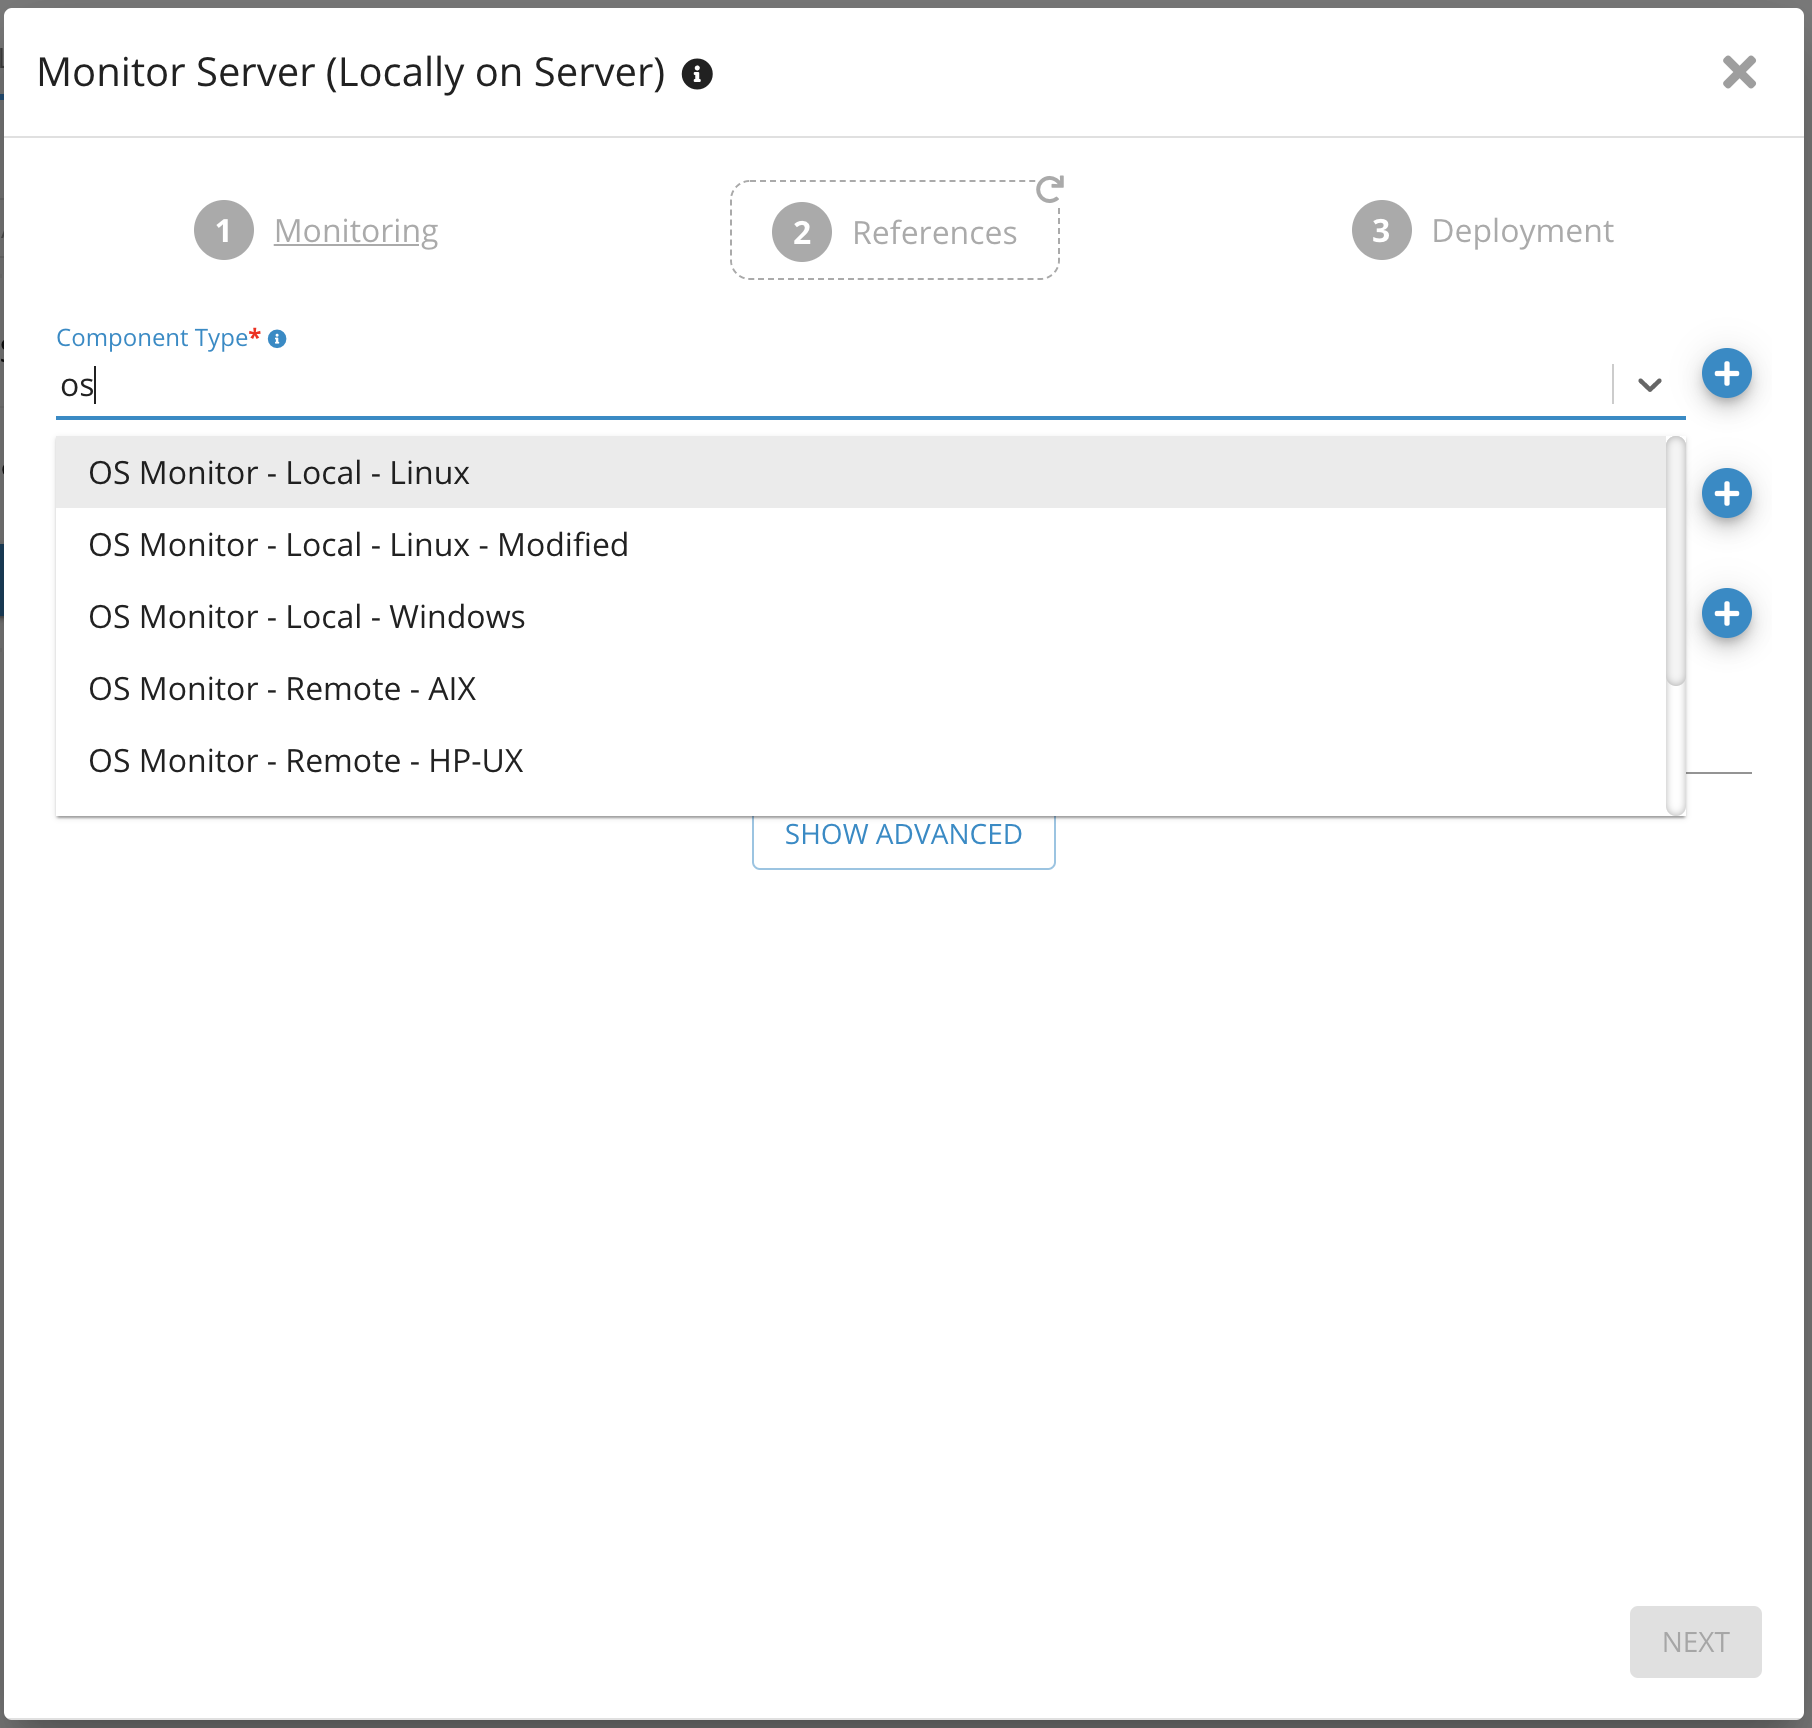
2. Select the Server
Under Monitored Server, select the Linux server you want to monitor.
3. Select the Application
Under Monitored Application, select the appropriate Operating System application.
Click Next.
4. Configure the Monitor
Provide a descriptive Monitor Name.
Select the appropriate:
-
Monitoring Node
-
GermainUX Engine
Configure the schedule defining how frequently Linux telemetry should be collected.
Complete the Wizard to activate monitoring.
🌍 Remote Linux Monitoring
Use remote monitoring when a GermainUX Engine will monitor the Linux server over the network.
Remote Linux monitoring uses SSH to periodically connect to the monitored server and collect operating-system telemetry.
1. Select the Monitor
Under Component Type, search for:
OS Monitor - Remote
Select the appropriate Linux OS Monitor.
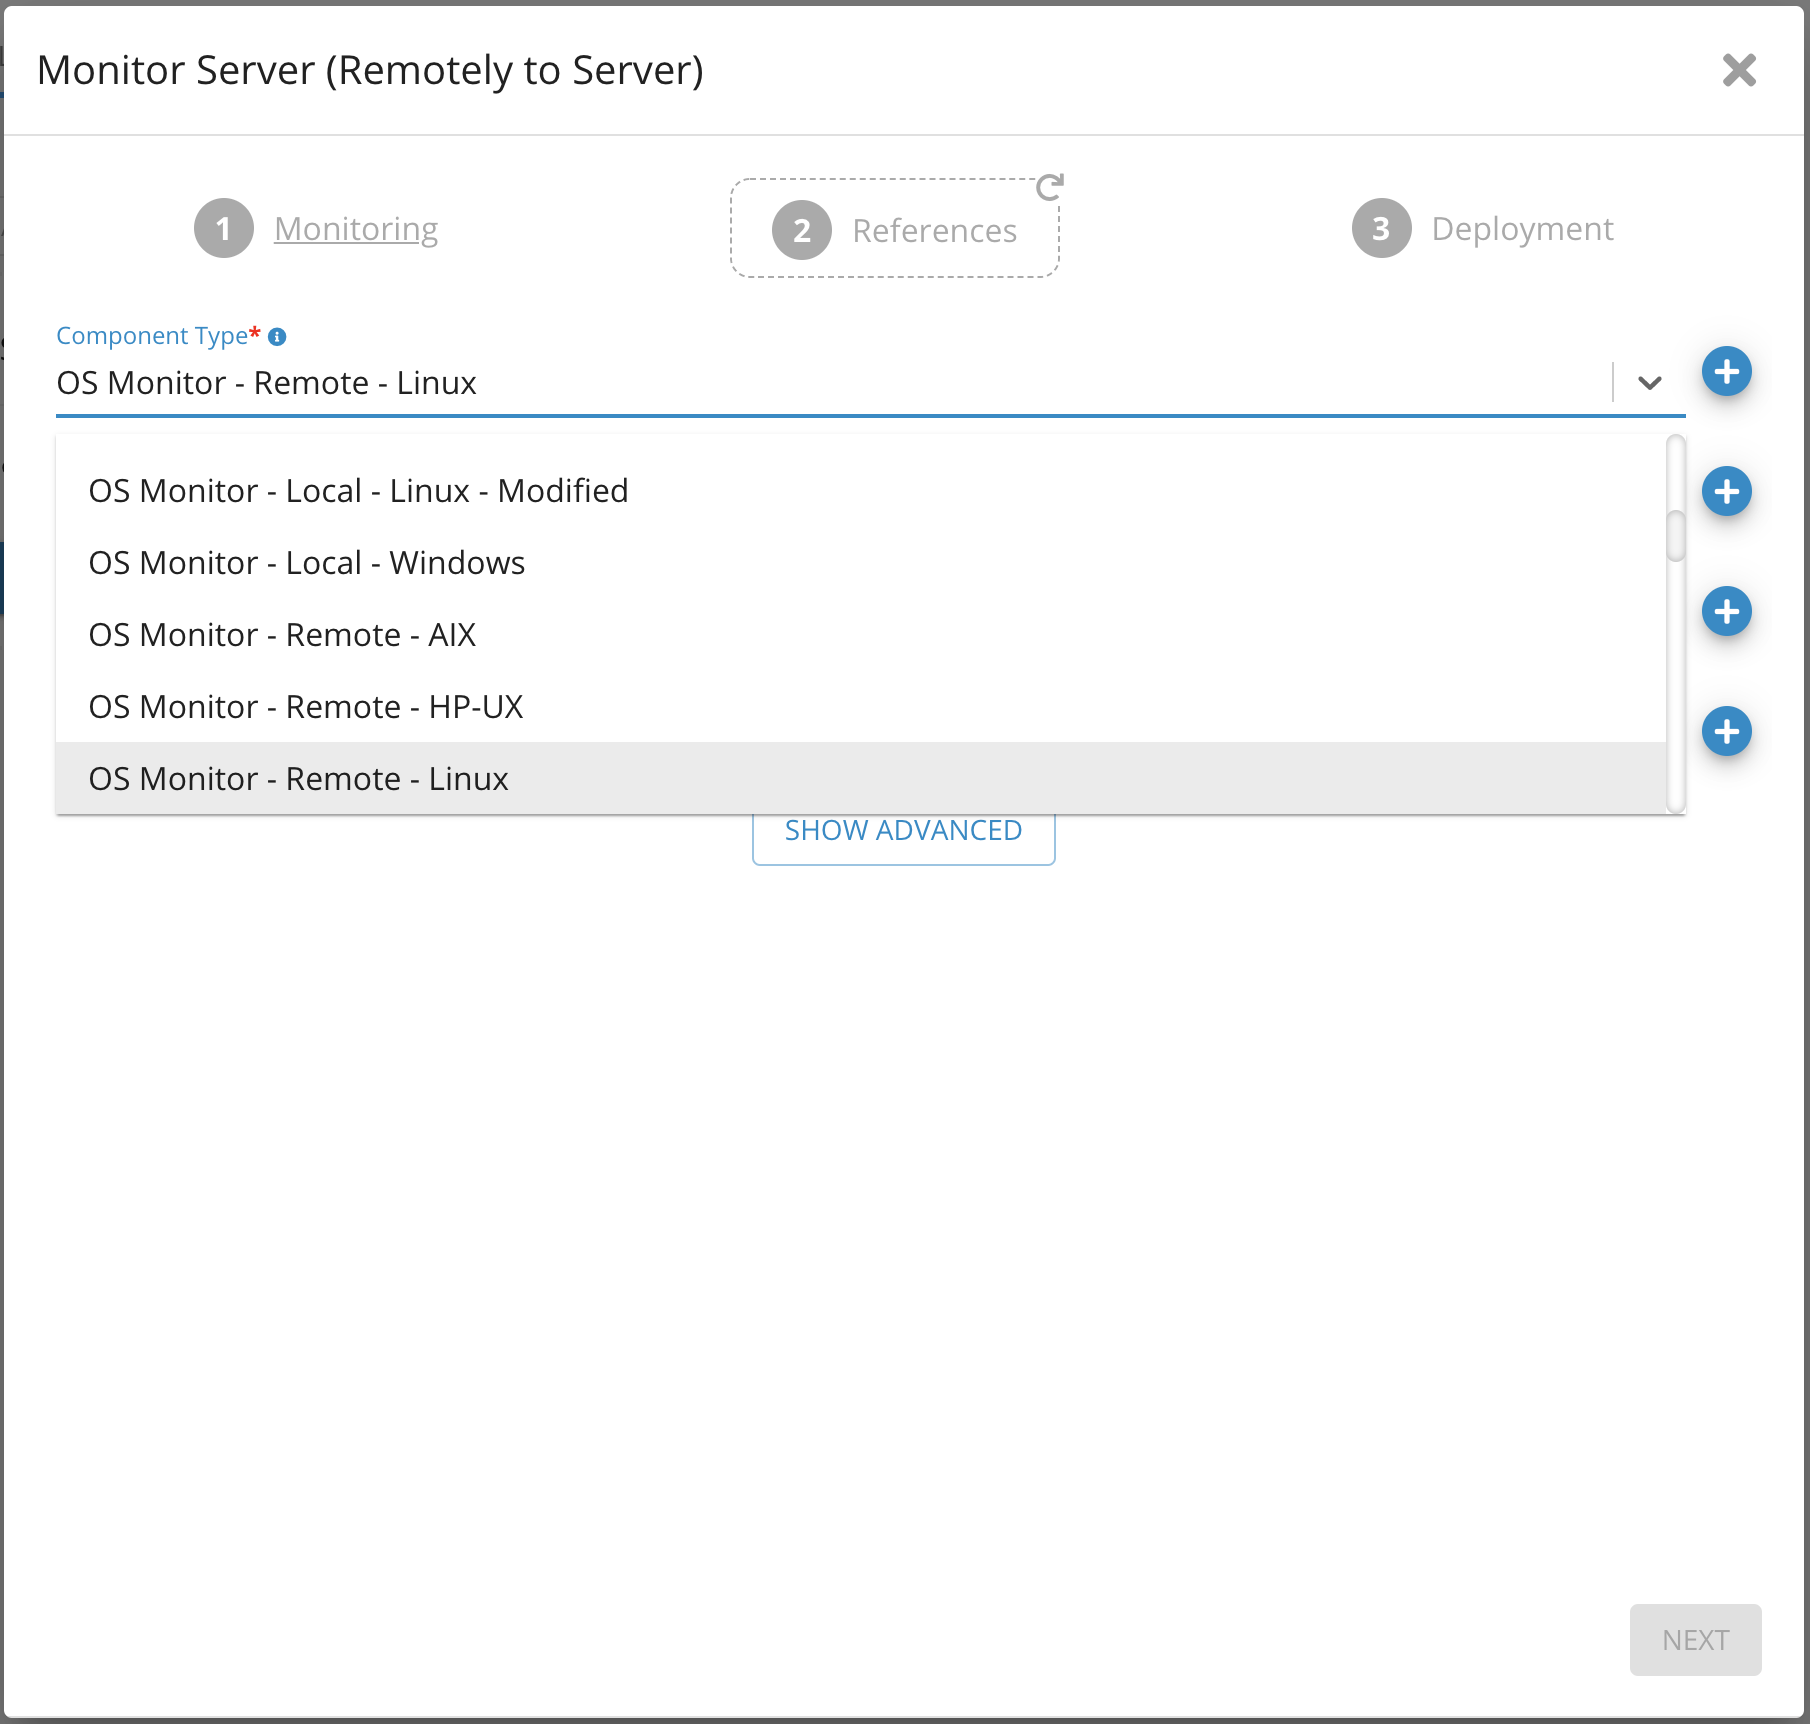
2. Select the Server
Under Monitored Server, select the Linux server you want to monitor.
3. Select the Application
Under Monitored Application, select the appropriate Operating System application.
4. Configure SSH
Provide the SSH credentials required to connect to the monitored Linux server.
The selected GermainUX Engine must have network access to the Linux server and permission to execute the commands required for monitoring.
Click Next.
5. Configure the Monitor
Provide a descriptive Monitor Name.
Select the appropriate:
-
Monitoring Node
-
GermainUX Engine
Configure the schedule defining how frequently Linux telemetry should be collected.
Complete the Wizard to activate monitoring.
⚙️ Configure Collected Linux Metrics
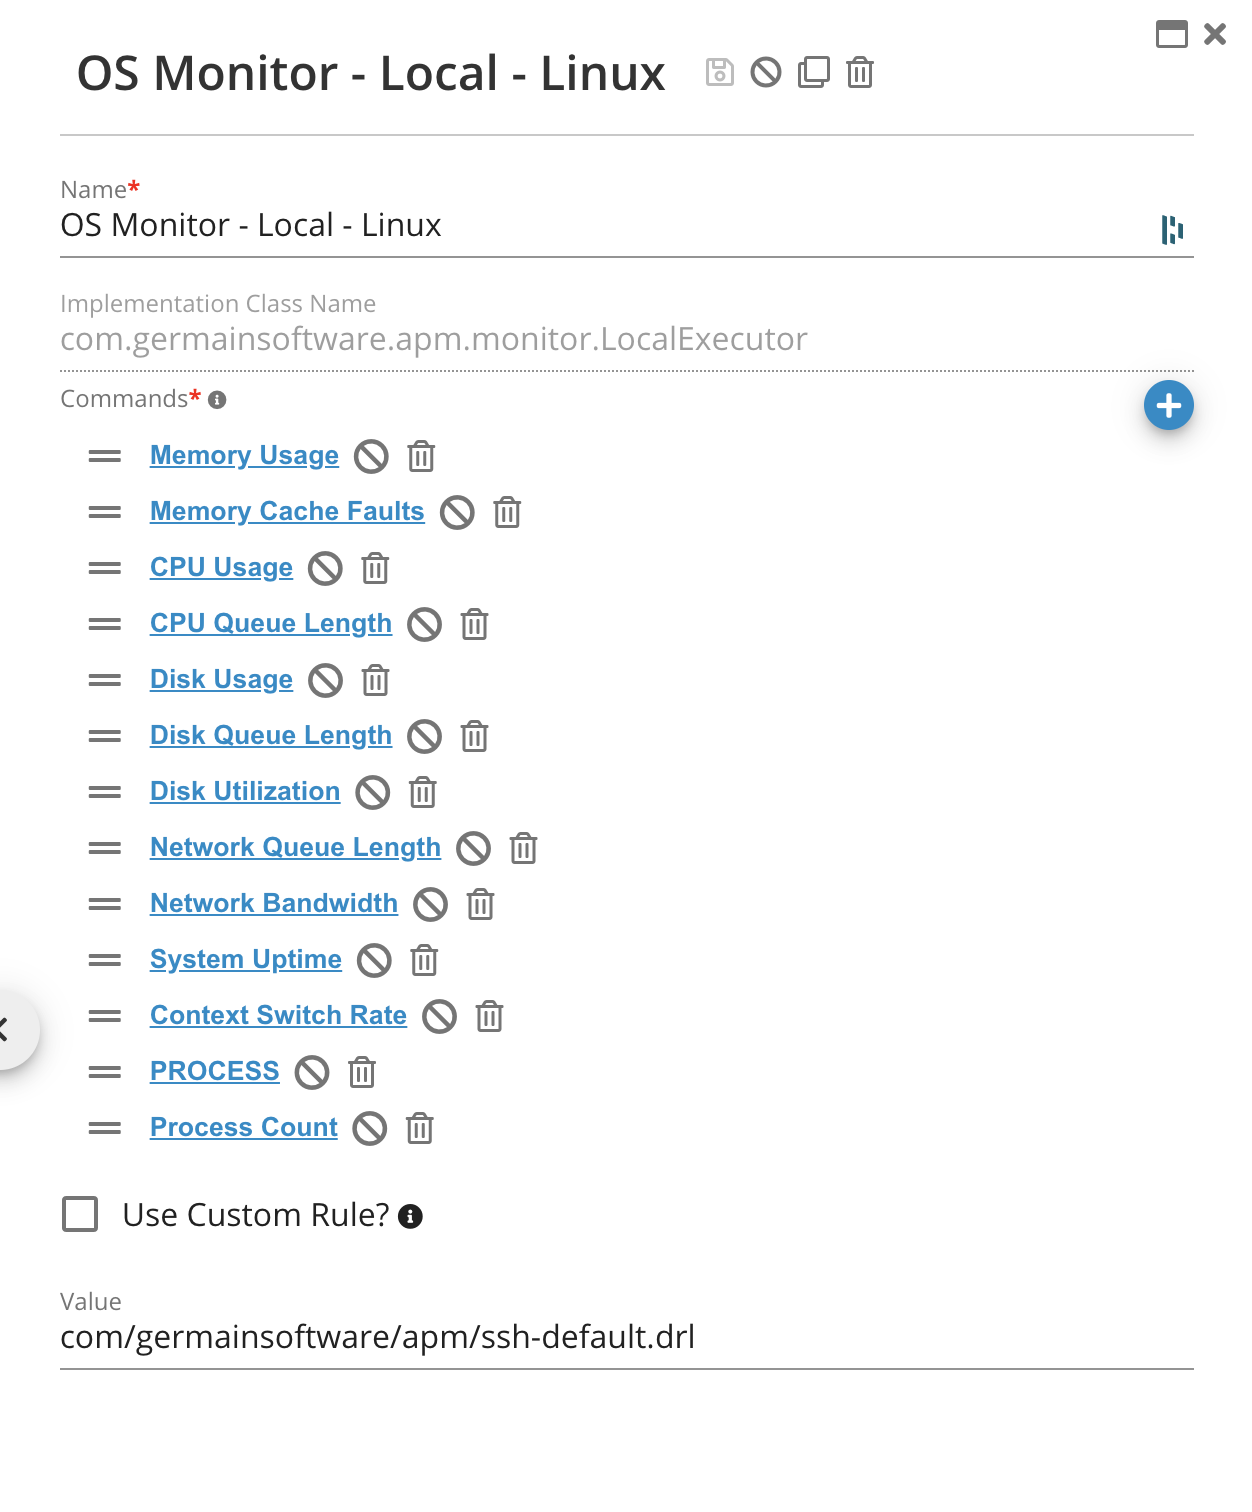
GermainUX collects Linux telemetry using standard operating-system commands.
Depending on the configured monitoring scope, these can include:
/bin/cat /proc/meminfo
sar -B 1 1
vmstat 1 2
df -l
iostat -d -x
netstat -inet -na --tcp
sar -n DEV 1 3
/proc/uptime
ps -A
These commands provide telemetry related to areas such as:
-
Memory
-
CPU
-
Virtual memory
-
Disk space
-
Disk I/O
-
Network activity
-
Uptime
-
Processes
Individual monitoring commands and OS metrics can be configured or disabled when they are not required.
⏱️ Configure Monitoring Frequency
Configure how frequently the Linux monitor should run based on your operational requirements.
More frequent monitoring provides greater visibility into short-lived infrastructure conditions but also increases monitoring activity and data volume.
Choose a frequency appropriate for the importance and workload of the monitored server.
✅ Validate the Deployment
Once monitoring is enabled:
-
Confirm the GermainUX Engine is running.
-
Verify connectivity to the monitored Linux server.
-
For remote monitoring, validate SSH connectivity and credentials.
-
Confirm Linux telemetry is being received by GermainUX.
-
Verify the expected CPU, memory, disk, network, process, uptime, and service data.
-
Review the monitoring schedule.
-
Configure or disable individual metrics as required.
Once validated, configure the appropriate KPIs, dashboards, alerts, SLAs, and automation for the server.
ℹ️ Get Help
The Germain Team can help you set this up. Contact GermainUX Support.
Component: Engine
Feature Availability: 2014.1 or later