
📊 Conversion Dashboard: Real-Time Monitoring of eCommerce Conversion
🧭 Overview
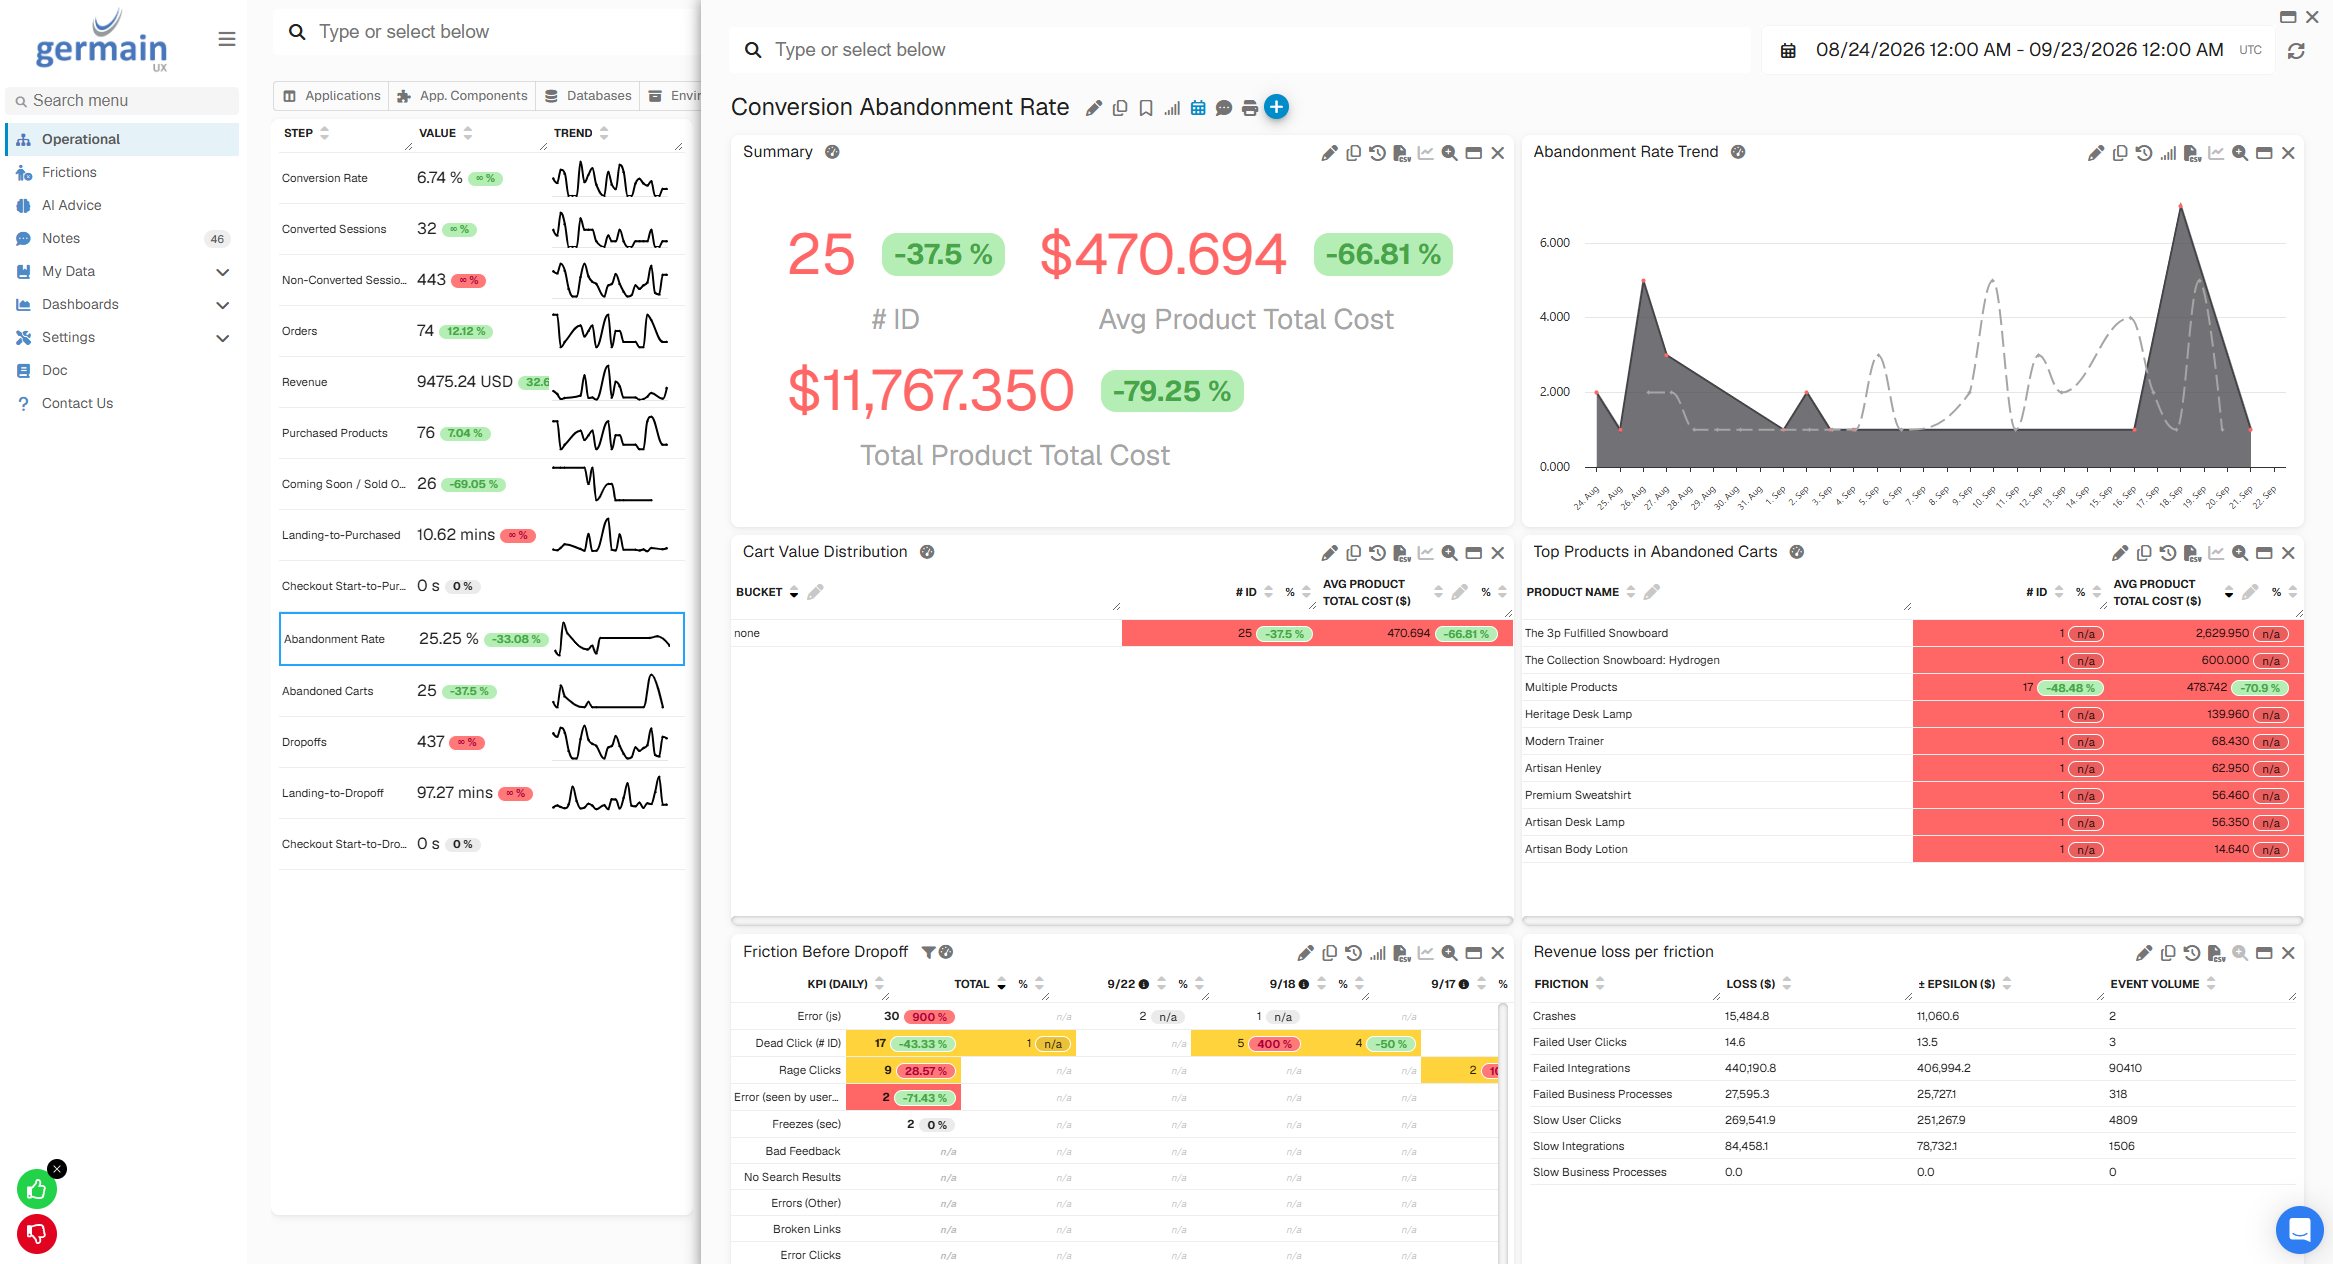
The Conversion Dashboard provides a real-time view of customer conversion and the conditions that may prevent visitors from completing desired outcomes.
It helps teams move beyond knowing how many visitors converted to understanding what may be preventing others from converting.
💡 Key Insights
Use the Conversion Dashboard to understand:
|
Metric |
Description |
|
|---|---|---|
|
1 |
Conversion Rate |
What percentage of visitors complete the desired outcome? |
|
2 |
Conversions |
How many successful conversions occurred? |
|
3 |
Abandonment |
Where are visitors abandoning? |
|
4 |
Journey & Funnel Performance |
Which steps lose the most visitors? |
|
5 |
Conversion Frictions |
Which detected frictions are associated with conversion? |
|
6 |
Errors |
Which errors affect converting journeys? |
|
7 |
Performance |
Are slow pages or transactions associated with abandonment? |
|
8 |
Affected Visitors |
How many visitors encounter each issue? |
|
9 |
Business Impact |
What potential conversion or revenue impact is associated with an issue? |
|
10 |
Trends |
Is conversion improving or declining? |
🔍 Investigate Conversion
When conversion changes, drill into the underlying data to identify the visitors, journeys, and conditions associated with the change.
Conversion Change → Conversion Frictions → Leading Factors → Affected Visitors → Individual Sessions → Likely Contributing Factors
Session Replay can then provide the context around an abandoned journey or negative customer feedback.
📦 Additional Resources
-
AI Insights & Recommendations
-
More Analytics Features
-
More Automation Features
-
Management Features.
ℹ️ Get Help
The Germain Team can help you set this up. Contact GermainUX Support.
Component: Workspace
Feature Availability: 2026.2 or later