

Overview
The SLA Violation Dashboard, called the Insights Dashboard in older versions, displays SLA violations by severity, priority, maximum variance, and other dimensions.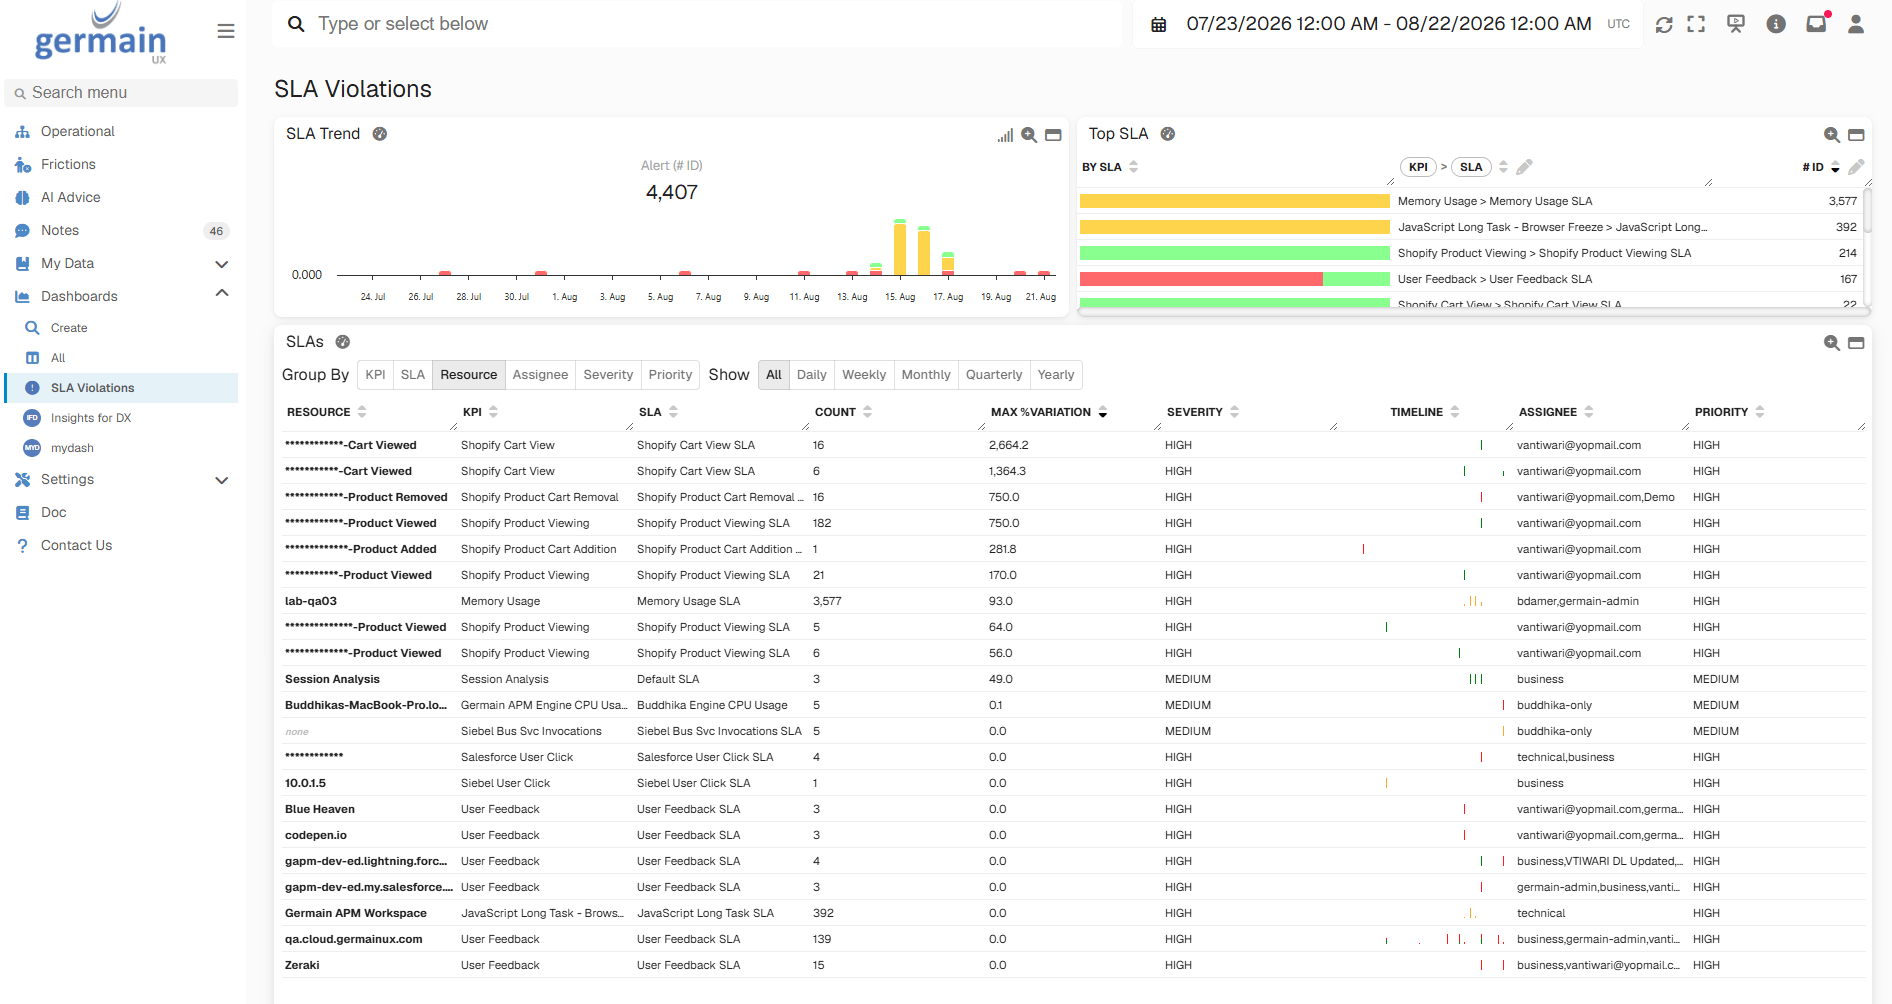
SLA Violation Dashboard
Additional Resources
Monitoring
Monitoring Management
Automated analysis
Rules for automated analysis
Action execution
Rules for action execution
Notifications
Notifications (SLA, etc)
Analytics
Other Analytics Features
Automation
Other Automation Features
Dashboard
Dashboards and Reports
Reports
Reports (Automatic, Scheduled)
Management
Management Features
Get Help
Contact GermainUX Support
The Germain Team can help you set this up.
Can't find what you need?
Search all GermainUX docs with Ctrl + K, or use the feedback buttons at the bottom of this page to tell us what is missing.
The content of this document is proprietary to GERMAIN SOFTWARE LLC.