
Operational Dashboard
📊 Overview
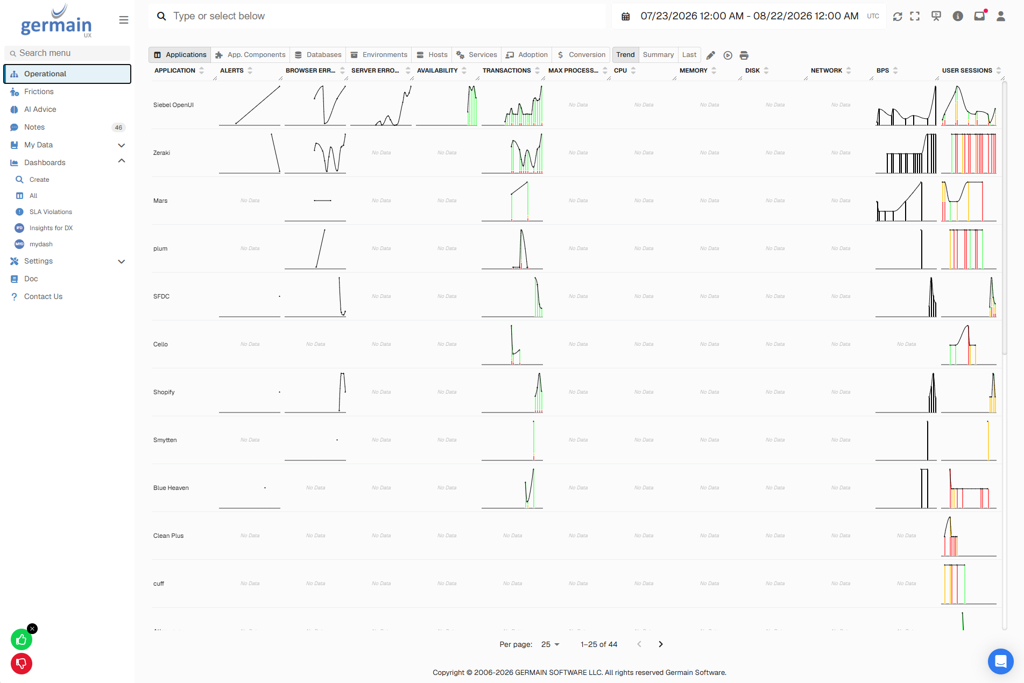
The Operational Dashboard provides a real-time, 360-degree view of the users, business operations, applications, and technologies monitored by GermainUX.
It is designed for teams that need to quickly understand what is happening now and where attention may be required.
Rather than investigating one KPI at a time, the Operational Dashboard brings together monitored KPIs and SLA status across applications, environments, services, infrastructure, adoption, and conversion.
What You Can Monitor
Depending on your GermainUX configuration, the Operational Dashboard provides views for:
|
View |
Purpose |
|---|---|
|
Technology Health |
Monitor technology availability, performance, errors, activity, and user experience. |
|
Real-time view of what users are experiencing while interacting with monitored applications. |
|
|
Real-time view of how efficiently employees complete work across monitored applications and business processes. |
|
|
Identify user struggles and other factors affecting successful application usage and adoption. |
|
|
Identify customer struggles, abandonment, and other factors affecting eCommerce conversion. |
Available views and metrics depend on the applications, technologies, KPIs, and monitoring configured in your environment.
👀 View Options
|
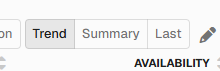
Trend |
Analyze how selected operational KPIs change over time. |
|
Summary |
View the most important operational indicators in one place. |
|
Last |
Get the last reading of any metric |
🚦 SLA Status
The Operational Dashboard aggregates SLA status across monitored KPIs so teams can quickly identify degraded or failing areas.
Users can drill into the available data to determine which application, component, service, environment, host, process, or other monitored entity is contributing to the condition.
🔎 Investigate an Issue
When an operational issue requires deeper investigation, drill into the underlying KPI and use GermainUX Analytics to move from the high-level condition to supporting evidence.
A typical workflow is:
Operational Condition → KPI → Pivot → Individual Instances → Analysis → Root Cause
Depending on the available monitoring data, the investigation can include related KPIs, affected populations, traces, errors, transactions, and Session Replay.
⚙️ Customize the Operational Dashboard
The Operational Dashboard can be customized to match your organization's operational requirements.
Authorized users can configure the information displayed so different teams can focus on the applications, technologies, business outcomes, and KPIs relevant to them.
📦 Additional Resources
ℹ️ Get Help
The Germain Team can help you set this up. Contact GermainUX Support.
Component: Workspace
Feature Availability: 2014.1 or later