
Frictions Dashboard
🚧 Overview
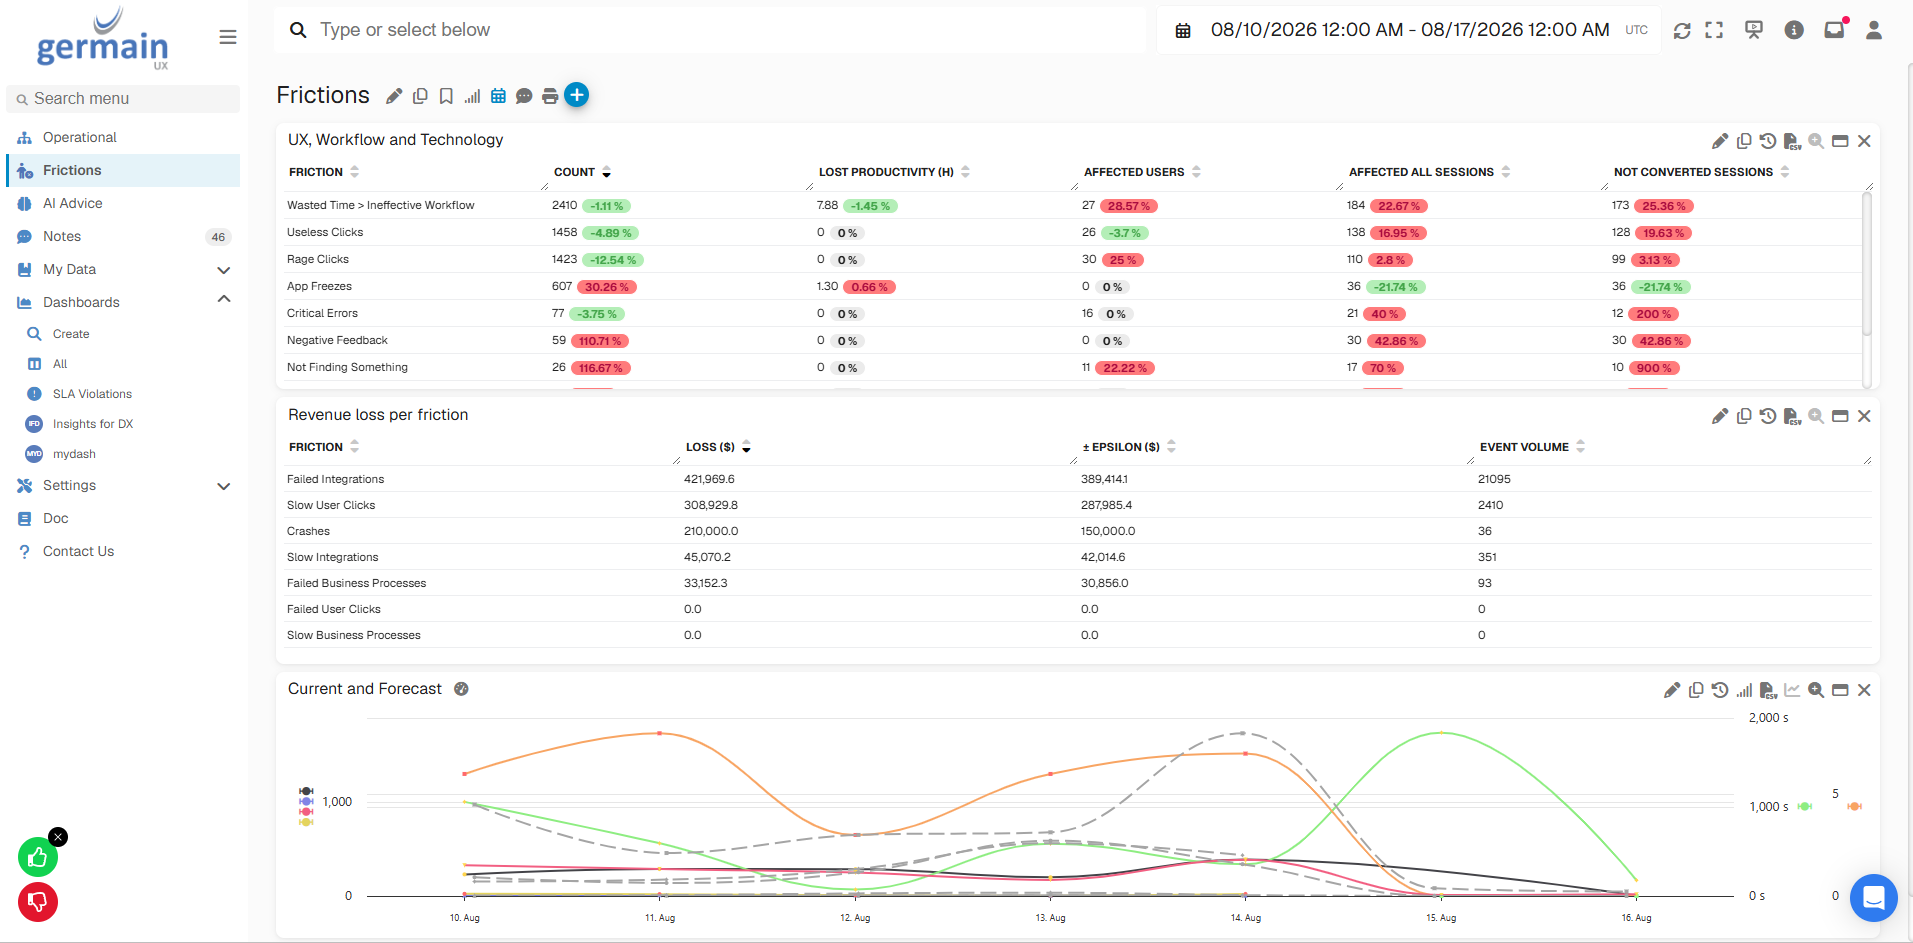
The Frictions Dashboard centralizes user and business frictions detected by GermainUX so teams can quickly identify what is negatively affecting conversion, adoption, productivity, and user experience.
Instead of manually reviewing individual sessions, errors, or events, the Frictions Dashboard brings detected friction together so teams can understand:
-
What friction is occurring?
-
How often is it occurring?
-
How many users or sessions are affected?
-
What is the potential business impact?
-
Which frictions should be investigated first?
🔎 What Is a Friction?
A friction is an observed condition that can negatively affect a user's ability to successfully complete an interaction, journey, or business process.
Depending on the monitored application and configured GermainUX capabilities, friction can include conditions such as:
-
Errors
-
Error Clicks
-
Dead Clicks
-
Rage Clicks
-
Slow interactions
-
Failed requests
-
Failed transactions
-
Workflow failures
-
Workflow delays
-
Abandonment
-
Repeated actions
-
User-facing errors
-
Other configured friction conditions
📊 Analyze Friction at Scale
The Frictions Dashboard aggregates detected friction across monitored users and sessions.
This allows teams to evaluate friction based on factors such as:
-
Number of occurrences
-
Sessions affected
-
Users affected
-
Frequency
-
Application or page
-
Workflow or journey
-
Friction type
-
Available business impact
This is important because the most frequently occurring friction is not necessarily the friction with the greatest impact.
🎯 Prioritize Friction
Use the Frictions Dashboard to identify which friction deserves attention first.
For example:
Friction → Frequency → Users Affected → Business Impact → Investigation
For conversion use cases, a lower-volume friction associated with a significant reduction in conversion may deserve more attention than a high-volume friction with little measurable conversion effect.
For productivity use cases, a friction affecting many employees repeatedly may have a larger cumulative impact than an isolated application error.
👥 Identify Who Is Affected
Frictions can be analyzed using available dimensions such as:
-
User
-
Session
-
Application
-
Page or screen
-
Business process
-
Journey step
-
Product
-
Browser
-
Device
-
Application version
-
Location
-
Other monitored attributes
This helps determine whether a friction is isolated or concentrated within a particular population.
🔬 Investigate a Friction
Select a friction to investigate the underlying evidence.
Depending on the available monitoring data, investigation can include:
-
Individual occurrences
-
Affected users
-
Affected sessions
-
Related errors
-
User actions
-
Transactions
-
Network activity
-
Business-process activity
-
Related KPIs
-
Session Replay
A typical investigation can progress from:
Friction → Affected Population → Individual Instance → Analysis → Session Replay → Likely Cause
🎥 Session Replay
When Session Replay is available, open an affected session to see what the user was doing and experiencing around the friction.
This can help determine what happened before, during, and after the detected condition.
Learn more about Session Replay.
🔗 Analyze Related Impact
A detected friction can be investigated together with other GermainUX KPIs.
For example:
Checkout Friction
→ Users affected
→ Conversion effect
→ Individual sessions
→ Related errors or performance
→ Session Replay
→ Likely cause
Or:
CRM Workflow Friction
→ Employees affected
→ Additional work time
→ Workflow step
→ Individual sessions
→ Related application issue
→ Likely cause
🧠 AI Analysis
Where AI capabilities are enabled, GermainUX can analyze friction data to help summarize patterns, identify important issues, and recommend potential improvements.
AI analysis can complement the underlying monitored evidence and help teams determine which frictions warrant further investigation.
⚡ From Friction to Action
Frictions can become part of a broader GermainUX operational workflow:
Detect → Analyze → Prioritize → Act → Validate
Depending on the configured Automation capabilities, a friction can lead to actions such as:
-
Alerting the appropriate team
-
Creating or updating a ticket
-
Performing additional analysis
-
Executing an approved automated action
-
Monitoring whether the friction continues
-
Validating whether the change improved the affected KPI
⚙️ Configure Frictions
Which conditions are identified as friction depends on the applications, technologies, KPIs, monitoring profiles, Rules, and other GermainUX capabilities configured in your environment.
The Germain Team can help configure friction detection and analysis for your organization's requirements.
Related Documentation
-
Analytics Dashboards
-
Analysis Dashboard
-
AI Advice Dashboard
-
Root-Cause Analysis
-
User Monitoring & Session Replay
-
Session Replay Player
-
Conversion Insights
-
Adoption Insights
-
Work Time Insights
-
Automation
ℹ️ Get Help
The Germain Team can help you set this up. Contact GermainUX Support.
Feature Availability: 2014.1 or later