
⚙️ Configuring Monitoring for Solaris with GermainUX: Steps and Best Practices
Configure GermainUX to collect availability, CPU, memory, disk, network, process, and other operating-system metrics from Solaris servers.
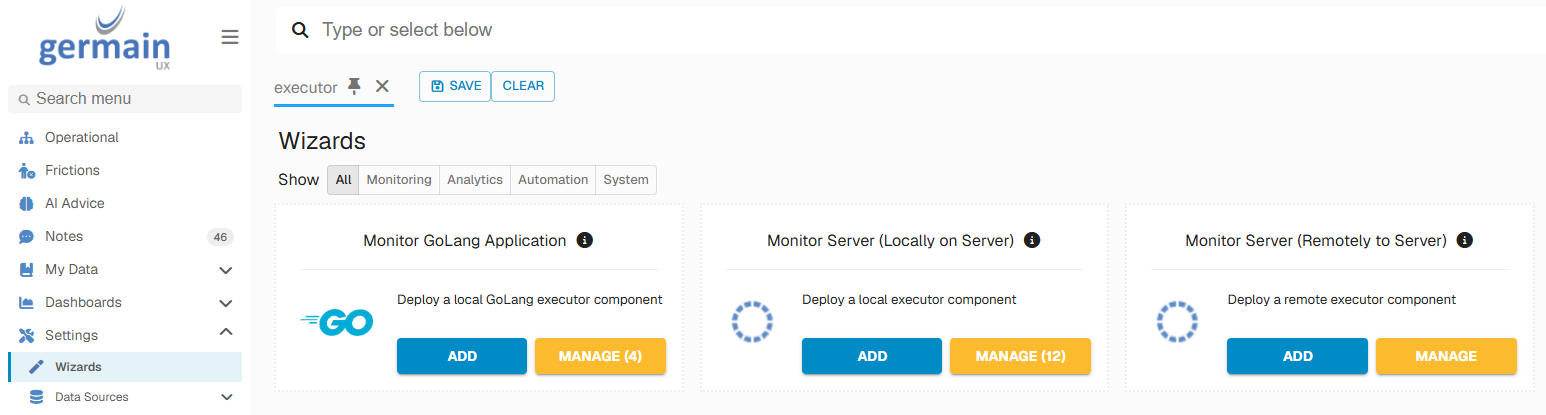
📂 1. Open the Monitor Server Wizard
Go to:
Germain Workspace -> Left Menu -> Settings → Wizards -> Monitor Server (Local or Remote)
Click Add to create a monitoring component.
Choose local or remote monitoring according to your deployment architecture.
🛰️ Remote Solaris Monitoring
Use remote monitoring when a GermainUX Engine or Agent connects to the Solaris server through SSH.
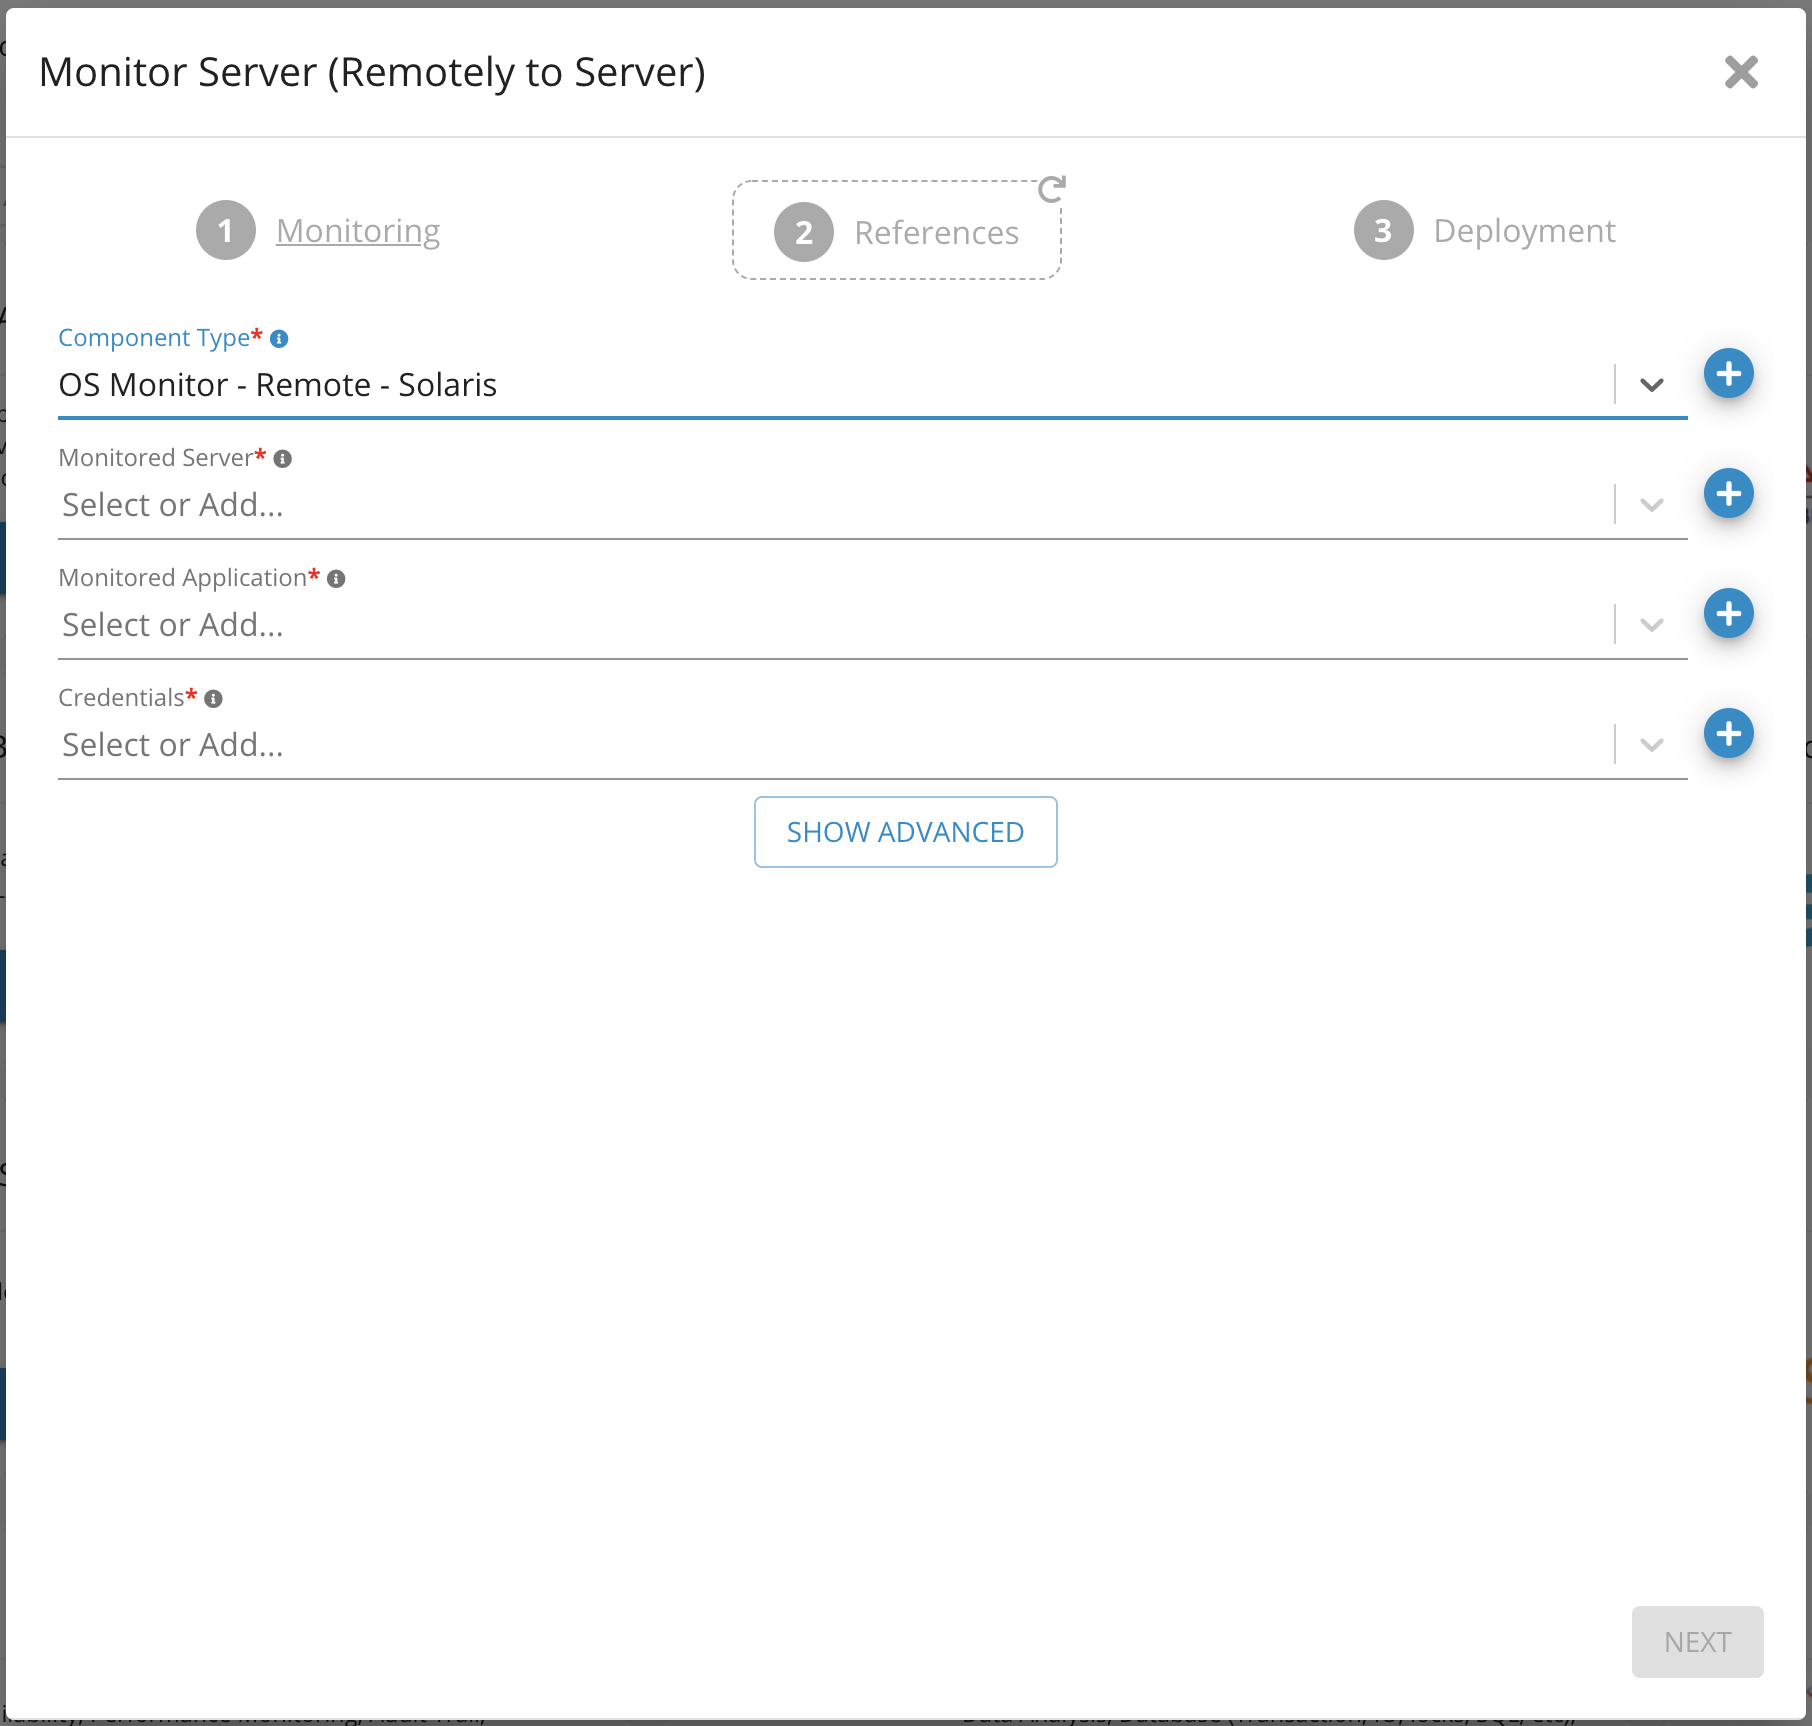
📁 2. Select the Component Type
Select:
OS Monitor - Remote - Solaris
💻 3. Select the Monitored Server
Select the Solaris server that you want to monitor.
This is the target server from which GermainUX will collect operating-system metrics.
🖥️ 4. Select the Operating System
Select the appropriate Solaris operating system for the monitored application/server.
This determines the operating-system commands and metrics used by the monitor.
🔑 5. Configure SSH Credentials
Provide or select the SSH credentials required to connect to the Solaris server.
The account must have permission to execute the required monitoring commands.
Use a dedicated monitoring account with the minimum permissions required whenever possible.
⚙️ 6. Configure the Monitor
Click Next and configure the monitoring component.
Provide a descriptive monitor name.
For example:
Solaris - Production - Application Server 01
A consistent naming convention makes it easier to identify servers in dashboards, alerts, and reports.
🔗 7. Select the Monitoring Node and Engine
Select the GermainUX node and Engine that will execute the monitoring component.
Choose an Engine that:
|
Requirement |
Details |
|---|---|
|
Can reach the Solaris server |
Can reach the Solaris server |
|
Can establish the required SSH connection |
Can establish the required SSH connection |
|
Has access to the configured credentials |
Has access to the configured credentials |
|
Can communicate with GermainUX |
Can communicate with GermainUX |
⏱️ 8. Configure the Schedule
Define how frequently GermainUX should collect Solaris metrics.
Choose a frequency appropriate for:
|
Consideration |
Details |
|---|---|
|
Server criticality |
Server criticality |
|
Required detection time |
Required detection time |
|
Infrastructure size |
Infrastructure size |
|
Monitoring overhead |
Monitoring overhead |
|
Operational requirements |
Operational requirements |
More frequent collection provides greater visibility but generates additional monitoring activity.
✅ 9. Finish the Configuration
Review the settings and click Finish.
The monitoring component will execute according to the configured schedule.
🏠 Local Solaris Monitoring
Use local monitoring when the monitoring component executes directly on the server or monitoring environment.
📂 1. Open the Monitor Server Wizard
Go to:
Germain Workspace -> Left Menu -> Wizards -> Monitor Server (Local or Remote)
Click Add.
🧰 2. Select the Local OS Monitor
Select the appropriate local OS Monitor component for the Solaris environment.
Do not select a Linux-specific component unless the monitored operating system is Linux.
💻 3. Select the Monitored Server
Select the server to monitor.
🖥️ 4. Select the Operating System
Select Solaris as the operating system when available for the selected monitoring component.
🔧 5. Configure the Component
Provide:
|
Field |
Details |
|---|---|
|
Monitor name |
Monitor name |
|
Monitored server |
Monitored server |
|
Monitoring node |
Monitoring node |
|
Engine |
Engine |
|
Execution schedule |
Execution schedule |
Click Finish to create the component.
📊 Configure Collected Metrics
Solaris monitoring uses operating-system commands to collect different categories of metrics.
Depending on the configuration, these include:
|
Category |
Solaris Command Examples |
|---|---|
|
System configuration |
|
|
CPU / Memory |
|
|
Disk capacity |
|
|
Disk I/O |
|
|
Network |
|
|
Uptime |
|
|
Processes |
|
Each monitoring command can be individually configured or disabled.
Disable collection when:
|
Reason |
Details |
|---|---|
|
The metric is not required. |
The metric is not required. |
|
The command is unavailable. |
The command is unavailable. |
|
Security policy prohibits execution. |
Security policy prohibits execution. |
|
Collection generates unnecessary overhead. |
Collection generates unnecessary overhead. |
|
An equivalent metric is collected through another monitoring source. |
An equivalent metric is collected through another monitoring source. |
🎯 KPIs
Solaris OS Monitor data can populate KPIs including:
|
KPI |
Purpose |
|---|---|
|
Memory Usage |
Monitor memory consumption |
|
Memory Cache Faults |
Identify memory/cache pressure |
|
CPU Usage |
Monitor processor utilization |
|
CPU Queue Length |
Identify CPU contention |
|
Disk Usage |
Monitor storage capacity |
|
Disk Queue Length |
Identify disk contention |
|
Disk I/O |
Monitor storage activity |
|
Network Queue Length |
Identify network congestion |
|
Network Bandwidth |
Monitor network throughput |
|
Network Bandwidth Usage |
Analyze network utilization |
|
Network Latency |
Monitor network performance |
|
OS Process |
Monitor operating-system processes |
|
Process Count |
Monitor the number of running processes |
📜 Configure SLAs
Configure SLA thresholds according to the expected behavior of each server.
Examples include:
🟦 CPU
CPU Usage -> 90%
💾 Memory
Memory Usage -> 90%
🗄️ Disk
Disk Usage -> 85%
⏳ CPU Queue
CPU Queue Length -> Expected Threshold
⚙️ Process
Required Process = Not Running
Use thresholds appropriate for your environment rather than applying the same values to every Solaris server.
💡 Configure Rules
Use GermainUX Rules when detection requires multiple conditions or more advanced logic.
Examples:
|
Scenario |
Example Condition |
|---|---|
|
High CPU combined with increased CPU queue length |
High CPU combined with increased CPU queue length |
|
High disk utilization combined with increased disk I/O |
High disk utilization combined with increased disk I/O |
|
Memory usage increasing continuously over time |
Memory usage increasing continuously over time |
|
Required process missing |
Required process missing |
|
Sudden increase in process count |
Sudden increase in process count |
|
Network degradation occurring with application errors |
Network degradation occurring with application errors |
Rules can also correlate Solaris telemetry with other monitored technologies.
🔔 Configure Alerts and Watches
Configure notifications for conditions requiring attention.
Examples:
Solaris Server Unavailable → Alert Infrastructure Team
Disk Usage -> Critical Threshold → Notify Server Owner
Required Process Missing → Alert Application Support
CPU Saturation + Application Degradation → Trigger Diagnostic Workflow
GermainUX can use detected conditions to initiate alerts, Watches, reports, or approved automation.
📈 Configure Dashboards
Create or configure dashboards to analyze:
|
Metric |
Details |
|---|---|
|
Server availability |
Server availability |
|
CPU usage |
CPU usage |
|
CPU queue length |
CPU queue length |
|
Memory usage |
Memory usage |
|
Memory cache faults |
Memory cache faults |
|
Disk usage |
Disk usage |
|
Disk I/O |
Disk I/O |
|
Disk queue length |
Disk queue length |
|
Network bandwidth |
Network bandwidth |
|
Network latency |
Network latency |
|
Processes |
Processes |
|
Process count |
Process count |
For infrastructure teams, group servers by:
|
Grouping |
Examples |
|---|---|
|
Application |
Application |
|
Environment |
Environment |
|
Server role |
Server role |
|
Data center |
Data center |
|
Business service |
Business service |
✅ Validate the Configuration
After creating the monitor, confirm that the expected KPIs are being generated.
Verify:
-
Monitoring component executes on schedule.
-
SSH connection succeeds when using remote monitoring.
-
Required Solaris commands execute successfully.
-
CPU data is collected.
-
Memory data is collected.
-
Disk data is collected.
-
Network data is collected.
-
Process data is collected.
-
KPIs appear in GermainUX.
-
SLA status is evaluated correctly.
-
Alerts and Watches operate as expected.
🔧 Troubleshooting
❌ No Solaris Data
Verify:
|
Check |
Detail |
|---|---|
|
Monitoring component is enabled. |
Monitoring component is enabled. |
|
Correct Engine is selected. |
Correct Engine is selected. |
|
Schedule is configured. |
Schedule is configured. |
|
Solaris server is reachable. |
Solaris server is reachable. |
|
SSH connectivity succeeds. |
SSH connectivity succeeds. |
|
Credentials are valid. |
Credentials are valid. |
|
Required commands are available. |
Required commands are available. |
|
Monitoring account has sufficient permissions. |
Monitoring account has sufficient permissions. |
🚫 SSH Connection Fails
Verify:
|
Check |
Detail |
|---|---|
|
Hostname or IP address |
Hostname or IP address |
|
SSH port |
SSH port |
|
Firewall |
Firewall |
|
Network routing |
Network routing |
|
Username |
Username |
|
Authentication |
Authentication |
|
SSH configuration |
SSH configuration |
 Some Metrics Are Missing
Verify that the corresponding monitoring command:
|
Check |
Detail |
|---|---|
|
Is enabled |
Is enabled |
|
Exists on the Solaris server |
Exists on the Solaris server |
|
Can be executed by the monitoring account |
Can be executed by the monitoring account |
|
Returns the expected output |
Returns the expected output |
Individual Solaris commands can be configured or disabled, so a missing metric does not necessarily indicate that the entire OS Monitor has failed.
🔬 CPU or Memory Data Looks Incorrect
Execute the corresponding Solaris command directly on the monitored server and compare its output with the GermainUX monitoring result.
Verify that the operating-system version and selected monitor type are appropriate for the target server.
🔍 Process Data Is Missing
Verify that:
ps -A
can be executed by the monitoring account and that process monitoring has not been disabled.
ℹ️ Get More Information
GermainUX can help determine which monitoring, analytics and automation capabilities are appropriate for your Solaris environment.
Component: Engine
Feature Availability: 2014.1 or later