
⚙️ Configuring Monitoring for Apache Tomcat with GermainUX
Configure GermainUX to collect and analyze Apache Tomcat availability, performance, JVM, connector, application, session, data-source, log, transaction, and user-experience data.
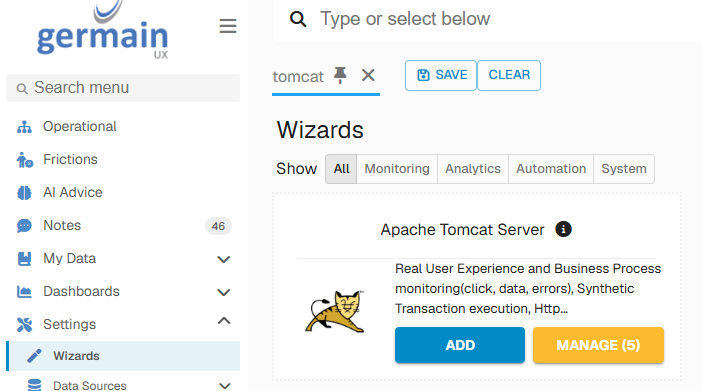
📂 1. Open the Tomcat Wizard
Go to:
Germain Workspace > Left Menu > Wizards > Tomcat
Select or create the Tomcat monitoring configuration.
🖥️ 2. Select the Monitored Server
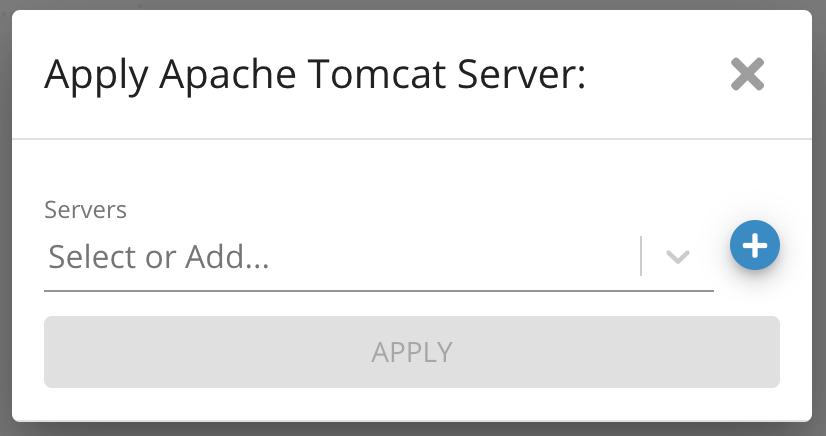
Select or create the server hosting Apache Tomcat.
Confirm that the server is associated with the correct:
|
Item |
|
|---|---|
|
1 |
Application |
|
2 |
Environment |
|
3 |
Host |
|
4 |
Server role |
📡 3. Select the Monitoring Node and Engine
Select the GermainUX node and Engine that will execute the Tomcat monitoring components.
Choose an Engine that can reach:
|
Target |
|---|
|
Tomcat |
|
JMX |
|
Required HTTP/HTTPS endpoints |
|
Accessible log files |
|
Supporting services |
🔗 4. Configure Tomcat Connection Settings
Configure the Tomcat connection information required by the selected monitoring methods.
Depending on the environment, this can include:
|
Field |
|---|
|
Host |
|
HTTP port |
|
HTTPS port |
|
JMX port |
|
Applications |
|
Credentials |
|
Timeout |
The exact fields depend on the Tomcat deployment and GermainUX version.
⚙️ 5. Configure JMX
When JMX monitoring is required, configure the JMX connection.
Provide or select:
|
Item |
|---|
|
Host |
|
Port |
|
JMX service URL |
|
Credentials |
|
Required security settings |
Use JMX to collect available metrics for:
|
Metric Area |
|---|
|
Connectors |
|
Thread pools |
|
Applications |
|
Sessions |
|
Data sources |
|
JVM |
🔌 6. Configure Connector Monitoring
Configure the connector metrics required for your environment.
Depending on the exposed Tomcat MBeans, monitor:
|
Metric |
|---|
|
Request count |
|
Error count |
|
Processing time |
|
Bytes received |
|
Bytes sent |
|
Current threads |
|
Busy threads |
|
Maximum threads |
|
Active connections |
Use thread-pool utilization together with traffic, response time, and error rate when defining thresholds.
☕ 7. Configure JVM Monitoring
Configure JVM metrics such as:
|
Metric |
|---|
|
Heap memory |
|
Non-heap memory |
|
Memory pools |
|
Garbage collection |
|
Threads |
|
Loaded classes |
|
CPU |
|
JVM uptime |
|
File descriptors, when exposed |
Use the Java monitoring configuration when deeper JVM monitoring is required.
👥 8. Configure Session Monitoring
When the required Tomcat session metrics are exposed, monitor:
|
Session Metric |
|---|
|
Active sessions |
|
Session creation |
|
Session expiration |
|
Rejected sessions |
|
Maximum sessions |
|
Average duration |
|
Maximum duration |
Avoid collecting individual session contents or identifiers unless explicitly required.
🗄️ 9. Configure JDBC Connection-Pool Monitoring
When Tomcat-managed data sources expose the required metrics, configure:
|
Metric |
|---|
|
Active connections |
|
Idle connections |
|
Maximum connections |
|
Connection-pool utilization |
|
Connection wait time |
|
Pool exhaustion |
|
Abandoned connections |
|
Connection failures |
Monitor the underlying database separately when deeper database root-cause analysis is required.
📃 10. Configure Tomcat and Application Logs
Configure monitoring for applicable log paths.
Examples include:
|
Log |
|---|
|
Catalina |
|
Manager |
|
Host Manager |
|
Application |
|
Access |
|
Garbage collection |
|
Startup and shutdown |
Configure patterns or rules for relevant conditions such as:
|
Condition |
|---|
|
Exceptions |
|
Out-of-memory errors |
|
Deployment failures |
|
Database connection failures |
|
Connector errors |
|
Authentication failures |
|
Resource warnings |
|
Class-loading errors |
|
Startup failures |
🔧 11. Configure Java Code Monitoring — Optional
When GermainUX Code Profiler is deployed, configure the required Java transaction and method monitoring.
Depending on the instrumentation, analyze:
|
Area |
|---|
|
Transactions |
|
Methods |
|
Exceptions |
|
SQL |
|
Database calls |
|
Outbound HTTP requests |
|
Integration calls |
|
Execution time |
Use profiling selectively according to troubleshooting and performance-analysis requirements.
🌐 12. Configure Real User Monitoring — Optional
For browser-based Tomcat applications, configure the appropriate UX Monitoring Profile.
Go to:
Germain Workspace > Left Menu > Analytics > UX Monitoring Profiles
Configure:
|
Feature |
|---|
|
RUM JS |
|
Session Replay |
|
User interactions |
|
Page performance |
|
Network monitoring |
|
JavaScript errors |
|
Browser errors |
|
Privacy |
|
Masking |
|
Exclusions |
|
Consent |
|
Retention |
When appropriate correlation information is available, GermainUX can associate browser activity with backend Tomcat and Java transactions.
🚀 13. Configure HTTP Monitoring — Optional
Configure HTTP or HTTPS monitoring for critical Tomcat applications and endpoints.
Validate:
|
Check |
|---|
|
Availability |
|
Response time |
|
HTTP status |
|
Expected response |
|
TLS certificate validity |
Process availability alone should not be used as proof that the application itself is usable.
🤖 14. Configure Synthetic Transactions — Optional
Create synthetic application workflows using GermainUX RPA Bot Recorder.
Examples:
Open Application → Authenticate → Execute Transaction → Verify Success
Configure:
|
Scenario Item |
|---|
|
Scenario |
|
Monitoring location |
|
Schedule |
|
Timeout |
|
Expected result |
|
Failure conditions |
|
Alerting |
📈 15. Configure Prometheus Monitoring — Optional
When Tomcat, JVM, application, container, or platform metrics are exposed through an approved Prometheus-compatible exporter, configure GermainUX Prometheus Metrics Monitoring.
Use only metrics exposed by an approved exporter.
⏱️ 16. Configure Monitoring Frequency
Configure how frequently each monitor should execute.
Use intervals appropriate for:
|
Consideration |
|---|
|
Application criticality |
|
Required detection time |
|
Infrastructure size |
|
Collection overhead |
|
Environment |
Not every Tomcat metric requires the same collection frequency.
🏅 17. Configure KPIs
Configure the KPIs relevant to the monitored environment.
Typical areas include:
|
KPI |
|---|
|
Tomcat availability |
|
Application availability |
|
HTTP response time |
|
HTTP errors |
|
Connector activity |
|
Thread-pool utilization |
|
JVM memory |
|
Garbage collection |
|
JVM threads |
|
HTTP sessions |
|
JDBC connection pools |
|
Application exceptions |
|
Java transactions |
|
Infrastructure resources |
🚩 18. Configure SLAs
Configure thresholds according to the architecture and normal workload.
Examples include:
✅ Availability
Tomcat or Critical Application = Unavailable
⏳ Response Time
Application Response Time > Approved Threshold
 HTTP Errors
HTTP Error Rate > Expected Baseline
⚙️ Thread Pool
Busy Threads Approaching Maximum
💾 JVM
Sustained Heap Utilization > Accepted Range
♻️ Garbage Collection
GC Duration > Accepted Range
👥 Sessions
Active Sessions Approaching Capacity
🔌 JDBC Pool
Active Connections Approaching Maximum
📜 Logs
Critical Error Detected
🛠️ Infrastructure
Resource Condition Threatens Application Availability
Use sustained-duration requirements and environment-specific baselines to avoid alerts caused by brief, harmless spikes.
🤖 19. Configure Rules and Automated Analytics
Use GermainUX Rules and analytics to identify conditions such as:
|
Condition |
|---|
|
Performance regression |
|
Error increase |
|
Thread-pool saturation |
|
JVM memory anomaly |
|
Garbage-collection anomaly |
|
Slow endpoint |
|
Slow transaction |
|
New application exception |
|
Server behaving differently from peers |
|
Post-release degradation |
|
Dependency affecting application performance |
🔔 20. Configure Alerts and Watches
Configure alerts for conditions requiring attention.
Examples:
Tomcat Unavailable → Alert Operations
Application Response Time Above SLA → Notify Application Team
Thread Pool Near Capacity → Notify Engineering
JDBC Pool Exhaustion → Alert Application and Database Teams
New Application Exception → Notify Development
Synthetic Transaction Failure → Alert Support
Notifications can be delivered through configured integrations such as email, SMS, Slack, or ServiceNow.
⚙️ 21. Configure Automated Actions
Configure only customer-approved operational actions.
Examples include:
|
Action |
|---|
|
Collect Tomcat status |
|
Collect JVM status |
|
Capture recent logs |
|
Capture diagnostic data |
|
Retest an endpoint |
|
Create an incident |
|
Update an incident |
|
Execute an approved script |
|
Run an approved SSH command |
|
Validate recovery |
Actions capable of restarting Tomcat, redeploying applications, terminating threads, or modifying production configuration require explicit authorization and operational safeguards.
📅 22. Configure Maintenance Windows
Define maintenance windows for:
|
Purpose |
|---|
|
Planned deployments |
|
Tomcat restarts |
|
Infrastructure maintenance |
|
Application releases |
Use maintenance windows to suppress expected alerts during approved maintenance activity.
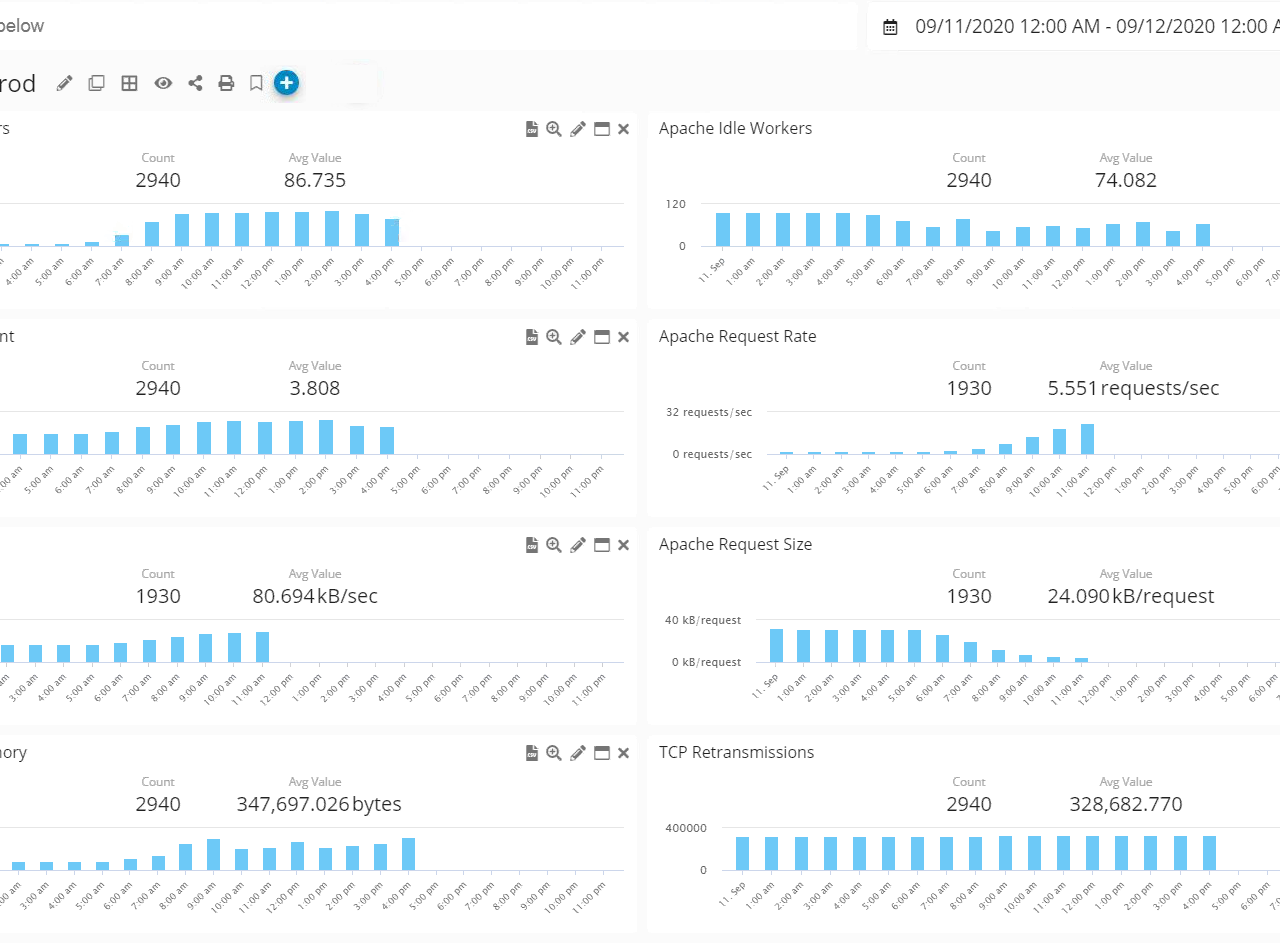
📊 23. Configure Dashboards
Create dashboards for different audiences.
⚙️ Tomcat Operations
Monitor:
|
Metric |
|---|
|
Availability |
|
Requests |
|
Response time |
|
HTTP errors |
|
Connectors |
|
Thread pools |
|
Applications |
🧠 JVM
Monitor:
|
Metric |
|---|
|
Heap |
|
Garbage collection |
|
Threads |
|
CPU |
|
Runtime health |
🚤 Application Performance
Monitor:
|
Metric |
|---|
|
Transactions |
|
Exceptions |
|
SQL |
|
External services |
|
Slow code paths |
📊 Capacity
Monitor:
|
Capacity Metric |
|---|
|
Threads |
|
Sessions |
|
JDBC connections |
|
Heap |
|
CPU |
|
Memory |
|
Disk |
🧑💻 User Experience
Monitor:
|
Metric |
|---|
|
User sessions |
|
Interaction performance |
|
Browser errors |
|
Backend transactions |
|
Business processes |
|
Session Replay |
✅ 24. Validate the Configuration
After configuration, verify:
-
Tomcat process and service availability.
-
HTTP and HTTPS connector status.
-
Selected JVM metrics.
-
Selected Tomcat metrics.
-
Required applications are monitored.
-
Thread-pool metrics are available when configured.
-
Session metrics are available when configured.
-
JDBC-pool metrics are available when configured.
-
Tomcat and application logs are collected.
-
Controlled application transactions are captured.
-
Java transaction tracing works when Code Profiler is deployed.
-
Browser-to-backend correlation works when RUM JS is deployed.
-
Synthetic transactions execute correctly.
-
Alerts work as expected.
-
Maintenance windows suppress expected alerts.
-
Approved automated actions work safely.
🚑 Troubleshooting
⛔ No Tomcat Metrics
Verify:
|
Check |
|---|
|
Engine is online. |
|
Tomcat server is reachable. |
|
Monitoring component is enabled. |
|
JMX is available when required. |
|
Credentials are valid. |
|
Required ports are reachable. |
|
Selected monitor is executing. |
❌ JMX Connection Fails
Verify:
|
Check |
Details |
|---|---|
|
JMX host |
JMX host |
|
Port |
Port |
|
Service URL |
Service URL |
|
Firewall |
Firewall |
|
Authentication |
Authentication |
|
TLS |
TLS |
|
Credentials |
Credentials |
|
Tomcat/JVM JMX configuration |
Tomcat/JVM JMX configuration |
🔍 Some Metrics Are Missing
The metrics available depend on:
|
Factor |
Details |
|---|---|
|
Tomcat version |
Tomcat version |
|
Java version |
Java version |
|
Exposed MBeans |
Exposed MBeans |
|
Enabled interfaces |
Enabled interfaces |
|
Permissions |
Permissions |
|
Application architecture |
Application architecture |
Verify that the expected MBean and metric are exposed by the target environment.
📃 Logs Are Missing
Verify:
|
Check |
Details |
|---|---|
|
Log path |
Log path |
|
File permissions |
File permissions |
|
Engine access |
Engine access |
|
File-monitor configuration |
File-monitor configuration |
|
Log rotation behavior |
Log rotation behavior |
|
Parser or rule configuration |
Parser or rule configuration |
🐌 Application Is Slow but Tomcat Metrics Look Normal
Correlate the request with:
|
Correlation Area |
Details |
|---|---|
|
Java transactions |
Java transactions |
|
SQL |
SQL |
|
Database performance |
Database performance |
|
External HTTP calls |
External HTTP calls |
|
Messaging |
Messaging |
|
JVM |
JVM |
|
Infrastructure |
Infrastructure |
|
Network |
Network |
A slow Tomcat-hosted application does not necessarily mean Tomcat itself is the bottleneck.
ℹ️ Get More Information
GermainUX can help determine which monitoring, analytics and automation capabilities are appropriate for your Tomcat environment.
Feature Availability: 2017.2