
Pivot Dashboard: Analyzing KPIs Through Dimensions for In-Depth Investigations
🔁 Overview
The Pivot Dashboard is the second level of GermainUX Analytics Dashboards.
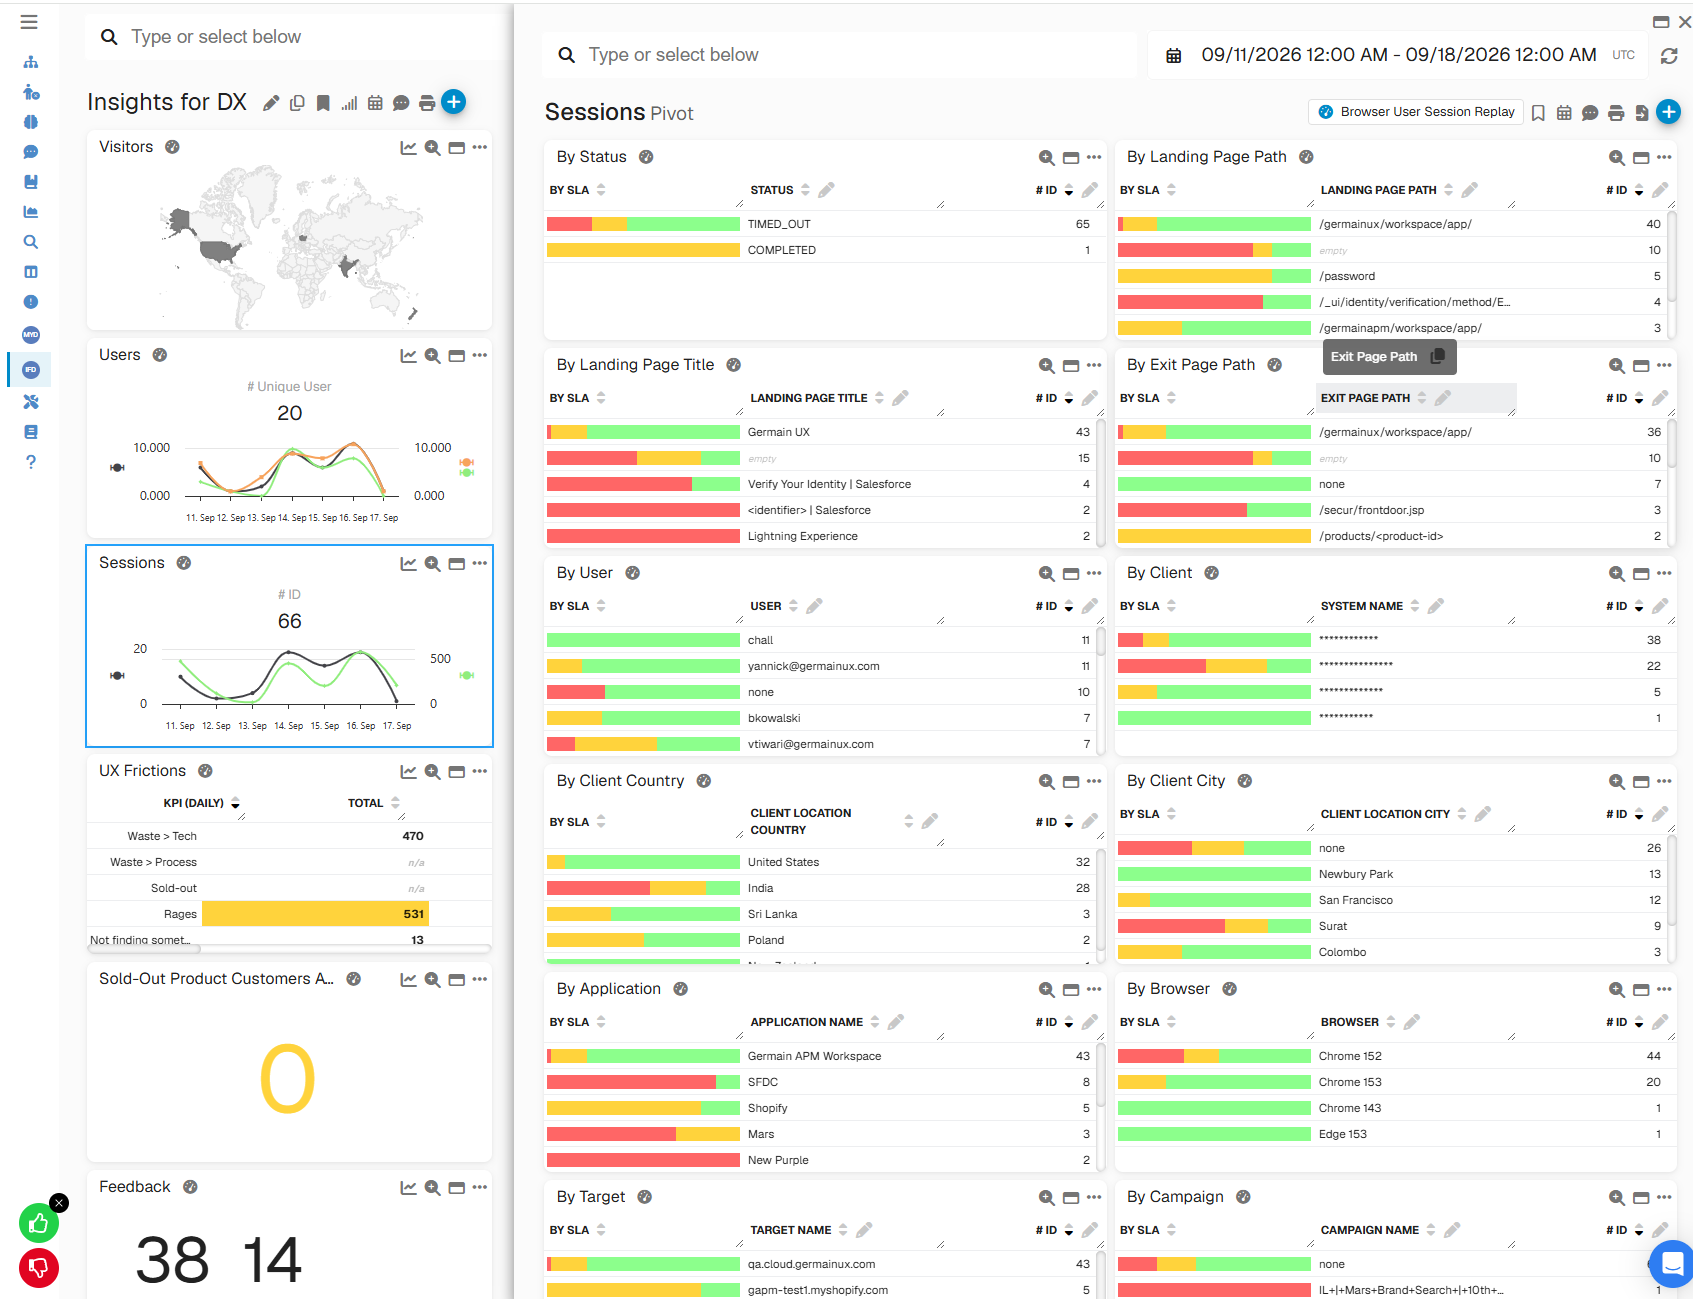
It breaks down an aggregated KPI by available dimensions to help determine where an outcome, change, or issue is concentrated.
For example:
Conversion Decline → Product → Journey Step → Device
or:
CRM Performance Issue → Page → User Group → Browser
🔎 When to Use
Use a Pivot Dashboard when an Aggregate Dashboard identifies something worth investigating and you need to determine:
-
Which users are affected
-
Which application or page is affected
-
Which product or journey step is affected
-
Which workflow or process is affected
-
Which device or browser is affected
-
Which region is affected
-
Which application version is affected
Available pivots depend on the KPI and monitored data.
📊 Open a Pivot Dashboard
Pivot Dashboards are generated from Aggregate Dashboards when you drill into an aggregated KPI.
They:
-
Inherit the originating dashboard's context
-
Inherit filters and visibility
-
Break the selected KPI into configured dimensions
-
Can be modified when a different analysis is required
-
Provide access to Drill-through and Analysis
🧮 Measures & Dimensions
The Pivot Dashboard can combine a KPI measure with one or more dimensions.
For example:
Conversion Rate by Product
Average Click Duration by Page
Lost Productivity by Workflow
Error Count by Application Version
This helps determine whether an issue is widespread or concentrated within a particular segment.
🔎 Filters
Filters are inherited from the originating Aggregate Dashboard and can be adjusted when required.
This allows investigators to narrow the analysis while preserving the original investigation context.
🔬 Continue the Investigation
From a Pivot Dashboard:
Pivot → Drill-through
to examine the individual records behind a segment.
Or:
Pivot → Analysis
to investigate relationships, baselines, Leading Factors, affected populations, and root causes.
Related Documentation
-
Analytics Dashboards
-
Aggregate Dashboard
-
Drill-through Dashboard
-
Analysis Dashboard
-
KPIs, Pivots & Measures
ℹ️ Get Help
The Germain Team can help you set this up. Contact GermainUX Support.
Feature Availability: 2014.1 or later